Postseason Managerial Report Card: Pat Murphy

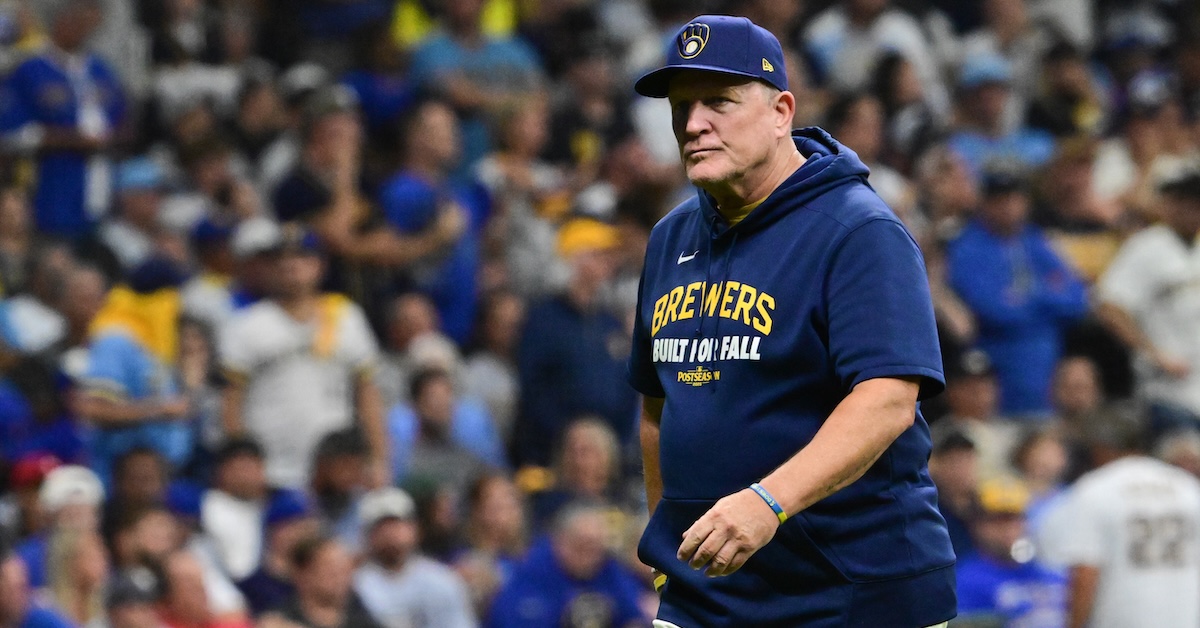
Hey kids, there’s a substitute teacher today! But I’ve been given the lesson plan, so we’re going to go ahead and talk about Milwaukee Brewers manager Pat Murphy — no spending the day watching old episodes of The Simpsons that I have on VHS, even though this classroom still has a functioning VCR for some reason. As your normal teacher, Mr. Clemens, would do, I’m going to grade Murphy based on his overall performance in the playoffs, rather than scrutinize every single micro decision made. If you’d like to see Mr. Clemens’ reports on the managers who lost in the various Division Series, you can find the American League write-up here, and the National League write-up here.
I find the Brewers fascinating, both because I’ve always appreciated them having the best logo in sports, and because I’m really bad at projecting them. While I had a better time of it than some others did this year, and at least only had them two wins short of the Cubs, the preseason ZiPS standings have repeatedly underestimated the Brew Crew. I’d love to be able to directly blame the computer for this phenomena, but ZiPS has actually done a solid job of projecting individual Milwaukee players. The problem is that when it comes time to guess exactly who will see the field, I’ve been giving them short shrift. In each of the last five seasons, if I had known precisely who would end up getting playing time, the preseason projections would have gone up by an average of just under four wins per year. It’s not simply that they’ve been healthier than expected, either; the Brewers tend to promote interesting players at a much faster pace than I expect them to, are very quick to understand what’s not working, and deploy role players extremely effectively.
OK, the bell rang, so let’s get going. Read the rest of this entry »