Imagine trading Mookie Betts. Chaim Bloom must have done that, must have considered all of the angles and potential outcomes of such a move, including the possibility that he would be saddled with it as his legacy — then sold principal owner John Henry on a vision of the Red Sox without the superstar right fielder in order to be hired as the team’s chief baseball officer in October 2019. That trade has not worked out well for the Red Sox, who have made the playoffs just once since winning the 2018 World Series, behaving more like a mid-market franchise than the league’s third-most valuable one. And while Bloom had put something of a stamp on the post-Betts roster, the rest of his vision will not be realized. On Thursday, the Red Sox fired him, kicking off a search for new leadership of their baseball operations department for the fourth time since Theo Epstein departed for the Cubs in October 2011.
Unlike predecessors Ben Cherington (2011–15) and Dave Dombrowski (2015–19), Bloom didn’t win a championship during his run to offset the team’s disappointing seasons. On his watch, the Red Sox went just 267–262 from the start of the pandemic-shortened 2020 season to the point of his dismissal, becoming more notable for their belt-tightening than for their on-field success. They made the playoffs only in 2021, when they went 92–70, finishing second in the AL East, then beating the Yankees in the Wild Card Game and the Rays in the Division Series before losing to the Astros in the ALCS. They finished last in the division in both 2020 (24–36) and ’22 (78–84) and fired Bloom while tied for fourth with the Yankees at 73–72, with just a 0.3% chance of making the playoffs. Read the rest of this entry »
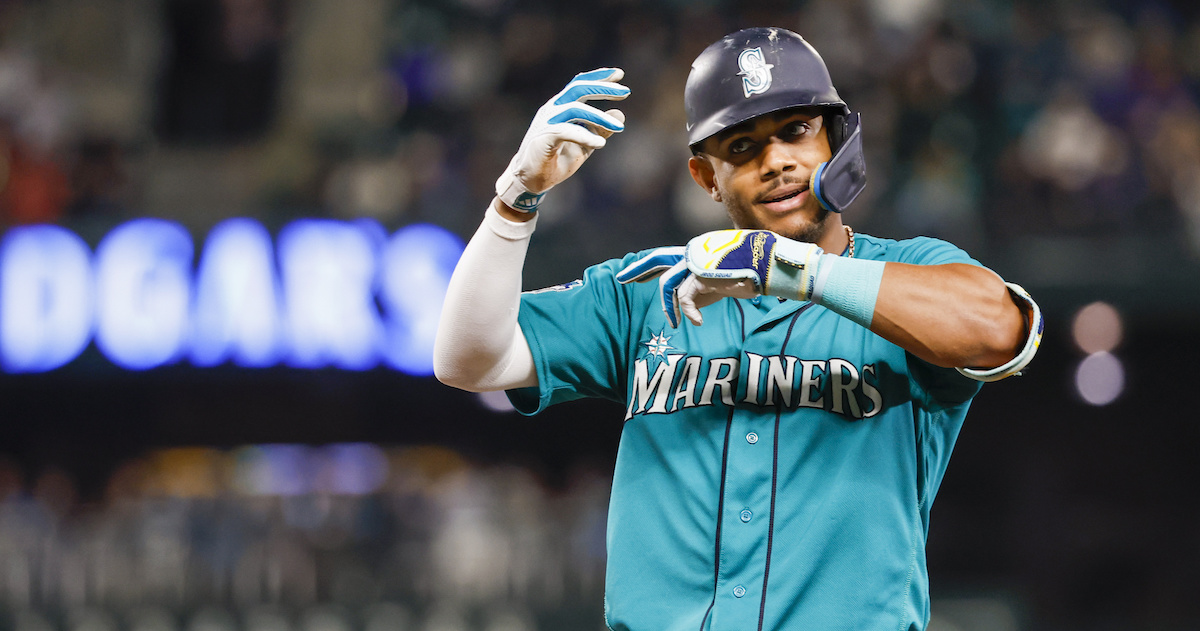
In the moment, the home run was huge. With the Mariners trailing 5-3 in the bottom of the 10th inning against the Angels on Monday night, needing a win to stay half a game ahead of the Rangers in the race for the third AL Wild Card spot, Julio Rodríguez chased a low sinker from José Marte and swatted it over the center field wall into the No Fly Zone, the personal cheering section of T-Mobile Park where the J-Rod Squad sits. The 402-foot blast was Rodríguez’s 30th of the year, meaning that it not only tied the game, it made the 22-year-old center fielder the third-youngest player to join the 30-homer, 30-steal club.
Counting to the point where the players joined the club by reaching the second milestone, only Mike Trout (21 years, 54 days in 2012) and Ronald Acuña Jr. (21 years, 248 days in 2019) reached 30 homers and 30 stolen bases in the same season at a younger age. Alex Rodriguez, like Julio Rodríguez, reached the mark in his age-22 season — and is the only other Mariner to accomplish the feat, but he was 23 years and three days old when he notched his 30th steal in 1998. Read the rest of this entry »
Apparently, the Yankees can’t have nice things even after shifting their focus to next season. Less than two weeks into his major league career, and just two days after he hit the fourth home run of his brief stay with the Yankees, long-awaited prospect Jasson Domínguez — nicknamed “The Martian” for his otherworldly collection of tools — has been diagnosed with a torn ulnar collateral ligament in his right elbow. He’ll soon undergo season-ending surgery that will likely sideline him for part of 2024 as well.
The 20-year-old Domínguez, who has been on prospect hounds’ radars since he signed out of the Dominican Republic for a $5.1-million bonus in 2019, entered the season ranked 50th on our Top 100 Prospects list and third on the Yankees list as a switch-hitting 50 FV prospect with a projected ETA of 2025. He did not figure in the Yankees’ immediate plans for this season, having split his 2022 campaign between A-level Tampa and High-A Hudson Valley. He finished the year with a 10-game cameo at Double-A Somerset; the last five of those games were in the Eastern League playoffs, capped by a two-homer, six-RBI performance in the championship series clincher.
This season, Domínguez hit .254/.367/.414 (117 wRC+) with 15 homers, 37 steals, and a 15.2% walk rate at Somerset, albeit with a dramatic improvement from the first half to the second. Before the All-Star break he scuffled, batting just .204/.345/.346 (95 wRC+) with 10 homers, 23 steals, and a 28.4% strikeout rate, numbers mitigated somewhat by his plate discipline (17.7% walk rate) and his age in a league where he was nearly four years younger than the average position player. He caught fire after the break, doing a better job of making contact and translating his 65-grade raw power into game power, hitting .354/.416/.549 with five homers and 13 steals from July 14 through August 20 while trimming his strikeout rate to 19.3%. He not only netted Player of the Week honors in the final week of his run at Somerset, he earned a promotion to Triple-A Scranton/Wilkes-Barre. Read the rest of this entry »
Zac Gallen couldn’t even wait until the sun went down to thumb his nose at my attempt to sort out the NL Cy Young race — or at least at the notion that he was out of it. While I mentioned Gallen in passing in a piece focused on Spencer Strider and a few other pitchers who appeared to have the best statistical cases for the award, I had little to say about Gallen, who spent much of this season as the league’s frontrunner but has faded in the second half, and was coming off back-to-back bad starts that had further puffed up his numbers. On Friday afternoon, the 28-year-old righty threw a three-hit complete-game shutout against the Cubs in a 1-0 win, prompting me to take a second look at situating him within the race as the candidates head into the home stretch.
Building off a 2022 campaign in which he posted a 2.54 ERA, 3.05 FIP, and 4.2 WAR en route to a fifth-place finish in the Cy Young voting, Gallen jumped out to the front of the race early this season. He ran off a streak of 28 consecutive scoreless innings from April 4–26, with an eye-opening 41-to-1 strikeout-to-walk ratio along the way. He finished June with a 2.72 ERA and 2.06 FIP, led the NL in FIP (2.85) and fWAR (3.8) at the All-Star break, and earned the starting nod for the All-Star Game opposite Gerrit Cole. He’s been the consensus pick for the Cy Young in four monthly polls of MLB.com voters.
Spencer Strider may be comically overpowering, but his bid to win the NL Cy Young is anything but a cakewalk. Over the course of his past two outings, he’s been hit for 10 runs in 8.2 innings, elevating his ERA from 3.46 to 3.83, higher than any pitcher who has won the award. The truth is that with less than four weeks to go in the season, no NL pitcher — not Strider, Blake Snell, Justin Steele, Zac Gallen or Zack Wheeler, just to run through a partial list of names — has a particularly strong statistical case to win. While each candidate’s remaining few starts may provide some clarity before voters send off their ballots, the race as it stands is worth a closer look.
I’m not a BBWAA voter in this or any of the annual awards this year, but I had been thinking about this race a bit lately thanks to a couple of questions from readers in recent chats and on social media. To that point, my default answer prior to those had been “Strider or Snell,” but I hardly had my mind made up. By a happy coincidence, all of this happened just as we introduced a Cy Young Projections leaderboard based on a simple model created by Tom Tango, using only earned runs, innings pitched, strikeouts, and wins — all counting stats, no rate stats. I know what the leaderboard says, and you can look as well, but I’ll save what it’s telling us about this race until later in this piece. Read the rest of this entry »
The Rangers have been sputtering, losing 15 of their last 19 since August 15 to turn a 3.5-game AL West lead into a three-game deficit, with the Astros, who just swept a three-game series from them at Globe Life Field, and Mariners both above them. Yet even as the team’s offense has dried up, Corey Seager has been on a tear. Since returning from a sprained right thumb at the beginning of August, the Rangers shortstop has homered 13 times in 30 games; this past week, he finally accumulated enough plate appearances to take over the AL leads in both batting average and wRC+. If not for Shohei Ohtani, Seager would have a pretty decent case for an MVP award, even with his absences.
Seager only missed nine games due to his thumb sprain, which he suffered on July 21 sliding into second base in a game against the Dodgers. That was his second trip to the injured list this year, as he also missed 31 games from April 12–May 17 due to a left hamstring strain. Yet the interruptions haven’t hindered him at all. Read the rest of this entry »
We haven’t seen much of Royce Lewis at the major league level yet, thanks in large part to a twice-torn anterior cruciate ligament. But what we have seen of the first pick of the 2017 draft has been impressive and, lately, otherworldly. On Monday against the Guardians, the Twins’ third baseman clubbed his third grand slam in an eight-game span, part of a longer hot streak that includes seven homers in his past 14 games.
Lewis’ latest slam came at the expense of Lucas Giolito, who was making his debut for the Guardians after being claimed off waivers from the Angels on September 1. Already down 2–0 in the second inning, Giolito was one strike away from a 1-2-3 inning when he lost the plot, issuing three walks, throwing a wild pitch, and allowing a single. That left the bases loaded for Lewis, who had already singled in the first inning. Giolito fell behind 2–0, then left Lewis a 92-mph belt-high fastball on the inner third of the plate. He hit a towering shot to left field; its 107.6-mph exit velocity was garden variety, but that 41-degree launch angle was majestic:
The slam broke the game open. Lewis would later add a two-run single off David Fry — the Guardians’ utilityman threw four innings of thankless relief — in what turned out to be a 20–6 romp. Those six RBIs gave Lewis 10 in a two-game span, as he went 3-for-5 with a three-run homer (off Jon Gray) and four runs driven in in the Twins’ 6–5 loss to the Rangers on Sunday. Only one player, the Orioles’ Ryan Mountcastle, has collected more RBIs in a two-game span this season (11 on April 10–11).
Lewis’ previous grand slams came at the expense of the Rangers’ Chris Stratton on August 27 and the Guardians’ Xzavion Curry on August 28:
The trio of salamis ties Lewis for this year’s lead alongside the Dodgers’ Max Muncy, the Astros’ Alex Bregman, and the Rangers’ Adolis García. Via the Elias Bureau and MLB.com’s Sarah Langs, he’s the first rookie with three grand slams in a span of eight games or fewer, and just the fourth player to bunch three such hits so closely, joining the Yankees’ Lou Gehrig (five games in 1931), the Tigers’ Jim Northrup (four games in 1968), and the Rangers’ Larry Parrish (eight games in 1982).
Including homers on August 23 (off the Brewers’ Corbin Burnes), August 24 (also off Stratton), and August 29 (off the Guardians’ Hunter Gaddis), Lewis is hitting .321/.400/.736 with seven homers and 22 RBI in 60 plate appearances over his last 14 games, all against the Brewers, Guardians, and Rangers. It’s a remarkable surge even from a player who has wielded a potent bat when available… but has unfortunately been rather scarce in recent years.
Recall that after reaching Double-A in 2019 and spending the following season at the Twins’ alternate training site, Lewis first tore his right ACL in February ’21 and missed the entire season. He was ready to go for the start of 2022 and bounced up and down between Triple-A St. Paul and the majors for the season’s first two months, making his major league debut on May 6 but playing just 11 games before returning to Triple-A. After another 10 games down on the farm, he returned to the majors on May 29, but three innings into what was his first major league appearance in center field, he re-tore his ACL — partially this time, not fully as in the first time — making a leaping catch at the wall and missed the rest of the season. For his time with the Twins, he hit a tantalizing .300/.317/.550 in 41 PA.
Lewis made his 2023 debut with Double-A Wichita on May 11 and, after two games, returned to St. Paul. After homering four times in eight games, he was back in Minnesota. Exactly one year after his last ACL tear, and one week before his 24th birthday, he homered off the Astros’ J.P. France in his second plate appearance, then added a game-tying single in the ninth. He played regularly at third base throughout June but strained an oblique on July 1, which sidelined him until August 15. He was hitting well before the injury, and he’s hit even better since coming back:
Royce Lewis Before and After Oblique Strain
Period
PA
HR
BB%
K%
AVG
OBP
SLG
wRC+
May 29–July 1
99
4
3.0%
28.3%
.326
.354
.474
129
Since August 15
85
7
10.6%
17.6%
.307
.388
.627
176
Total
184
11
6.5%
23.4%
.318
.370
.541
151
All statistics through September 4.
As you can see from those improved strikeout and walk rates, Lewis has taken a more disciplined approach since returning. He’s lowered his chase rate from 38.6% to 32.2% and his swing rate from 50.8% to 46.2%; meanwhile, his swinging-strike rate has dropped from 13.3% to 9.7%. He’s done a much better job upon reaching two strikes than before, improving from .220/.264/.280 (51 wRC+) with a 52.8% strikeout rate to .231/.333/.333 (91 wRC+) with a 33.3% strikeout rate. In late June, he spoke of adjusting his two-strike approach to a more aggressive, contact-oriented one. ViaThe Athletic’s Dan Hayes:
“It’s who I am,” Lewis said. “It’s just me being able to put the bat on the ball and make contact and make people do things. You’ve just got to play the game and when you strike out, no one is doing anything except for the pitcher. Honestly, I get frustrated after a while and I just go back to being like — what I said to (hitting coach David Popkins) is, ‘I’m going to turn into (Luis) Arraez today, just touch the ball. There’s a lot of grass out there.’”
…“It’s a mindset,” Lewis said. “Not waiting for a pitch you can drive because these guys are going to execute. If they dot one up on the outer third, that’s 0-1. Then they do it again, 0-2. ‘OK, great, now you’re 0-2.’ Now you’re battling and you’re looking for a pitch to drive at the same time, that doesn’t work. I looked at where some of our plans were going and how the pitchers were pitching us and they weren’t attacking us with our plan of getting a mistake. I was like, ‘Why don’t I just start being aggressive, putting the ball in play? I know I can at least touch it and go to right field.’”
Since returning, Lewis is hitting the ball in the air far more often, and harder in general:
Royce Lewis Batted Ball Profile
Period
BBE
GB/FB
GB%
FB%
EV
LA
Barrel%
HH%
Pull%
PulledFly%
May 29–July 1
67
1.32
43.3%
32.8%
87.7
9.7
9.0%
34.3%
37.3%
7.5%
Since August 15
58
0.55
29.3%
53.4%
91.2
22.2
10.3%
39.7%
44.8%
15.5%
Total
125
0.87
36.8%
42.4%
89.3
15.5
9.6%
36.8%
40.8%
11.2%
All statistics through September 3.
Note that Lewis is also pulling the ball more frequently and, as that last column illustrates, has more than doubled the frequency with which he hits fly balls in the air. Five of his 11 homers have come via pulled flies, one before the injury and four since returning.
For all of that, it’s worth noting that Lewis is riding a .368 BABIP, which is higher than any batting title qualifier save for Freddie Freeman (.375). That said, 15 other players with between 150–425 PA (around enough to qualify) have higher marks, including three of Lewis’ teammates and another former number one pick whom I checked in on about six weeks ago:
All statistics through September 4. Minimum 150 PA. * = qualified for batting title
When I wrote about Moniak, who’s in the midst of a breakout year with the Angels (despite a 2.8% walk rate and 34.8% strikeout rate), he had a .427 BABIP through 165 PA. Since then, through his next 151 PA, he’s produced a .365 BABIP — still incredibly high, just a bit behind Lewis, yet 72 points lower than that first stretch. That said, Julien, Solano, and Jeffers all have higher BABIPs than Lewis in at least 96 more PA, with Solano having more than twice as many PA.
It’s rare but not unheard of for so many teammates to sustain such numbers. Four other expansion-era teams have had four players with at least a .360 BABIP in 150 PA; in fact, the Twins entry in that group sustained those BABIPs through at least 350 PA for all four:
Expansion-Era Teams with Four Players with .350 BABIPs
All statistics through September 4. Minimum 150 plate appearances. Yellow = leads category.
Lewis has the highest wOBA-xwOBA differential by a seven-point margin, the third-largest differential in batting average, and the fourth-largest in slugging percentage. Note that the top six players in that table are all short of qualifying for the batting title; those gaps tend to shrink as the sample sizes increase.
While it’s tempting to chalk up some of the differentials to Lewis’ 76th-percentile speed, his eight hits on grounders and line drives that have stayed in the infield don’t move the needle that much, and none of his five doubles are the result of hustling to stretch singles. On the contrary, a 398-footer that he hit off the Rangers’ Andrew Heaney at Target Field on August 24 would have been a home run in 24 of the other 29 ballparks.
Even if his production is a bit beyond the bounds of sustainability, Lewis’ return has helped to shore up the Twins’ third base situation. The team made the Replacement Level Killers list ahead of the trade deadline, with Jose Miranda, Kyle Farmer, Willi Castro, and Solano combining with Lewis’ first stint to hit a meek .247/.317/.353 for a 90 wRC+ and 0.5 WAR. With Lewis making 14 of the team’s last 18 starts at third (plus four more at DH) and Jorge Polanco, Castro, and Farmer seeing time in the period between that article’s publication and Lewis’ return, the group is up to .260/.333/.388 (101 wRC+) with 1.8 WAR. The Twins have widened their AL Central lead from three games to seven since that list ran and from 4.5 games to seven since Lewis’ return. He’s just been part of the parade, as the Twins as a team have hit .275/.362/.489 since August 15, good for a 134 wRC+ (fourth in the majors) and 6.42 runs per game (third).
On a team whose biggest stars, namely Carlos Correa and Byron Buxton, have disappointed, Lewis has helped pick up the slack, and if what he’s done isn’t as sustainable as it is flashy, his in-season evolution is certainly encouraging. After three mostly lost seasons, the Twins can’t ask for much more than that.
Jay Jaffe: Good afternoon folks, and welcome to my first chat of this sweltering (in Brooklyn where it’s 92 degrees) September!
2:03
Jay Jaffe: Hope you all had nice long weekends. Just before the weekend I did this about Tony Gonsolin’s Tommy John surgery, a now-outdated snapshot of the Dodgers’ rotation (ugh) and a look at TJS trends in general https://blogs.fangraphs.com/tony-gonsolin-and-recent-tommy-john-surger… I’m working on something on Royce Lewis for tomorrow.
2:03
KC Pain: Better Star Wars name, Cal Quantrill or Akil Baddoo?
2:04
Jay Jaffe: Baddoo is a name that seems seems straight out of Phantom Menace, though I’d also believe that Quantrill flew alongside Luke Skywalker in A New Hope and/or Empire Strikes Back.
2:04
v2micca: Even three years in, I really dislike the extra innings ghost-runner rule. Which is more likely, the rule is eventually applied to post season play, or the rule is removed from regular season play. (Yes, I know there is a third option but I want to know which you think is more likely of the first two)
2:06
Jay Jaffe: I’d say more likely to be applied to postseason play BUT I very, very much doubt that will happen. The move to do so in regular season just makes life simpler for teams (and players), and they tend to like it because it gets them home earlier, but I don’t see anybody hungering to have a playoff game decided that way.
Between Shohei Ohtani, Félix Bautista, and now Tony Gonsolin, the fragility of ulnar collateral ligaments has been an all-too-frequent topic of conversation within the past week. Gonsolin, in case you haven’t heard, is headed for Tommy John surgery on Friday, while we’re still waiting to hear whether the UCL injuries of Ohtani and Bautista are significant enough to merit going under the knife. Between that trio and the Rays’ Shane McClanahangoing down earlier this month — and the fact that neither Gonsolin nor McClanahan are the first members of their teams’ rotations this year to need such surgery — it certainly feels as though we’re dealing with a lot of Tommy Johns lately, so it’s worth cutting through the numbers.
First, however, let’s spare a few paragraphs for Gonsolin and the Dodgers. The 29-year-old righty was coming off an All-Star season in which he posted a 2.14 ERA and 3.28 FIP in 130.1 innings, and owned similarly impressive career marks (2.51 ERA, 3.45 FIP) despite his intermittent availability due to injuries, which included a six-week absence near the end of last season due to a forearm strain, and just two appearances totaling 3.1 innings afterwards, one of them a four-out start in the 2022 Division Series. After spraining his left ankle during fielding drills in early March, he was playing catch-up and never seemed to find a comfort zone. He began the regular season on the injured list, finally debuting on April 26, and while his run prevention numbers looked good in the early going, his peripherals told another story, and his average fastball velocity was down. On June 11, manager Dave Roberts alluded to some health issues with Gonsolin, noting that his between-starts recovery “hasn’t been great,” and wondering if he was having trouble getting loose or pacing himself. In his next start two days later, Gonsolin threw six shutout innings but averaged just 91.1 mph with his four-seamer, two full ticks below last year.
To that point, Gonsolin had a 1.93 ERA but a 4.25 FIP, and soon he began to get roughed up on a routine basis. Over his next seven starts, he allowed four or more runs six times, producing a 7.25 ERA. Following a 3.1-inning, five-homer, 10-run stinker on August 18, Gonsolin’s second bad start out of three, Roberts told reporters that Gonsolin had been pitching through an unspecified “arm issue” for four to six weeks and would likely head to the injured list. On Sunday, the Dodgers acknowledged that surgery was an option, and on Monday it was revealed he’d undergo Tommy John on September 1. Read the rest of this entry »
While Bryce Harper made the quickest return from Tommy John surgery of any position player on record, it came with a cost. Not surprisingly, he didn’t hit the ball as hard as usual in the early months of his return, or do as much damage because he wasn’t elevating it with consistency. At one point, he went 166 plate appearances without a home run, the longest drought of his career, but even then, he remained a reasonably productive hitter. Lately he’s been heating up, crushing the ball while helping the Phillies climb to the top of the NL Wild Card race.
In the fourth inning of Monday night’s game against the Angels in Philadelphia, Harper demolished a Lucas Giolito fastball that was playing in the middle of the road:
The homer — a 111.9-mph scorcher with a projected distance of 429 feet — was Harper’s fourth in a seven-game rampage, during which he’s hit .500/.613/1.037. It was his eighth homer of the month, his highest total since he hit nine in September/October 2021 (and 10 in August of the same season) en route to his second MVP award. He maxed out at seven homers in May of last season, the month he was diagnosed with a torn ulnar collateral ligament in his right elbow. Read the rest of this entry »