We decided to make a leaderboard that combines THE BOARD! with our Minor League Leaderboards. There are a ton of new features to review, but if you are the type of person that attempts to assemble furniture without reading the instructions, here’s the link:
https://www.fangraphs.com/prospects/the-board-scouting-and-stats
If you are still with us, we have a lot to cover. This combined leaderboard is similar to a feature we tested on our prospects landing page where the prospect list that Eric and Kiley have compiled is joined with our minor league stats.
Here’s a list of the new features:
- THE BOARD: Scouting + Stats!
- Revamped Minor League Leaderboards
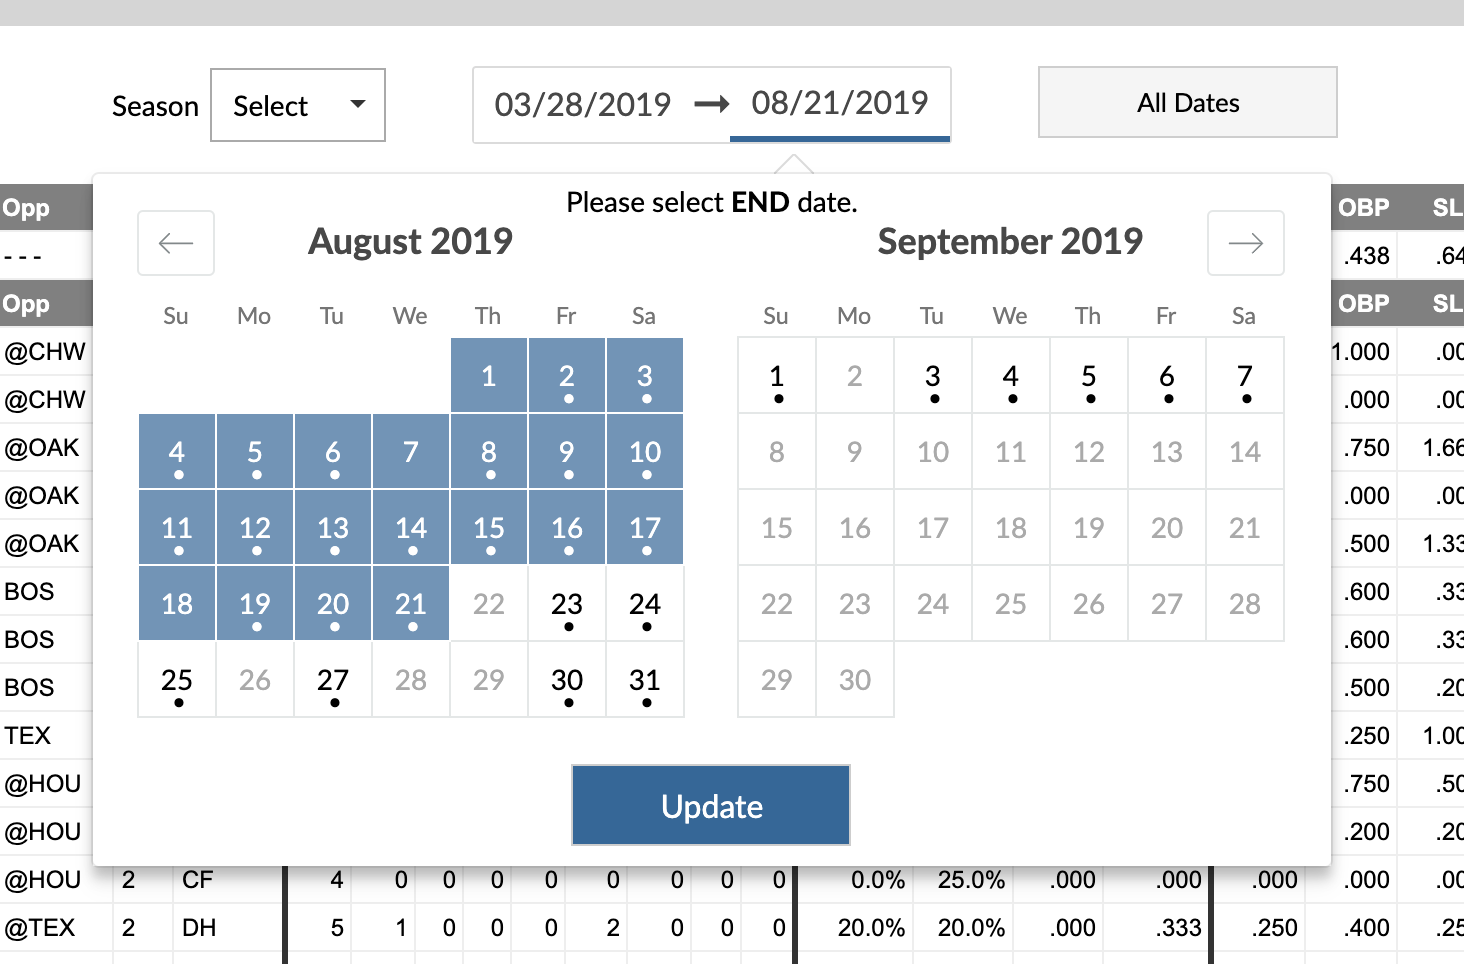
- Added the ability to select multiple seasons
- Added the ability to filter by organization
- Added three new league filters: Upper (AAA/AA), Mid (A+/A), and Low Levels (A-/R)
- Revamped Custom Reports
- Your custom reports can be displayed as a tab (blue instead of green) on the leaderboard.
- The interface to add and change stat columns is all-new.
- You can choose to include row numbers in your report.
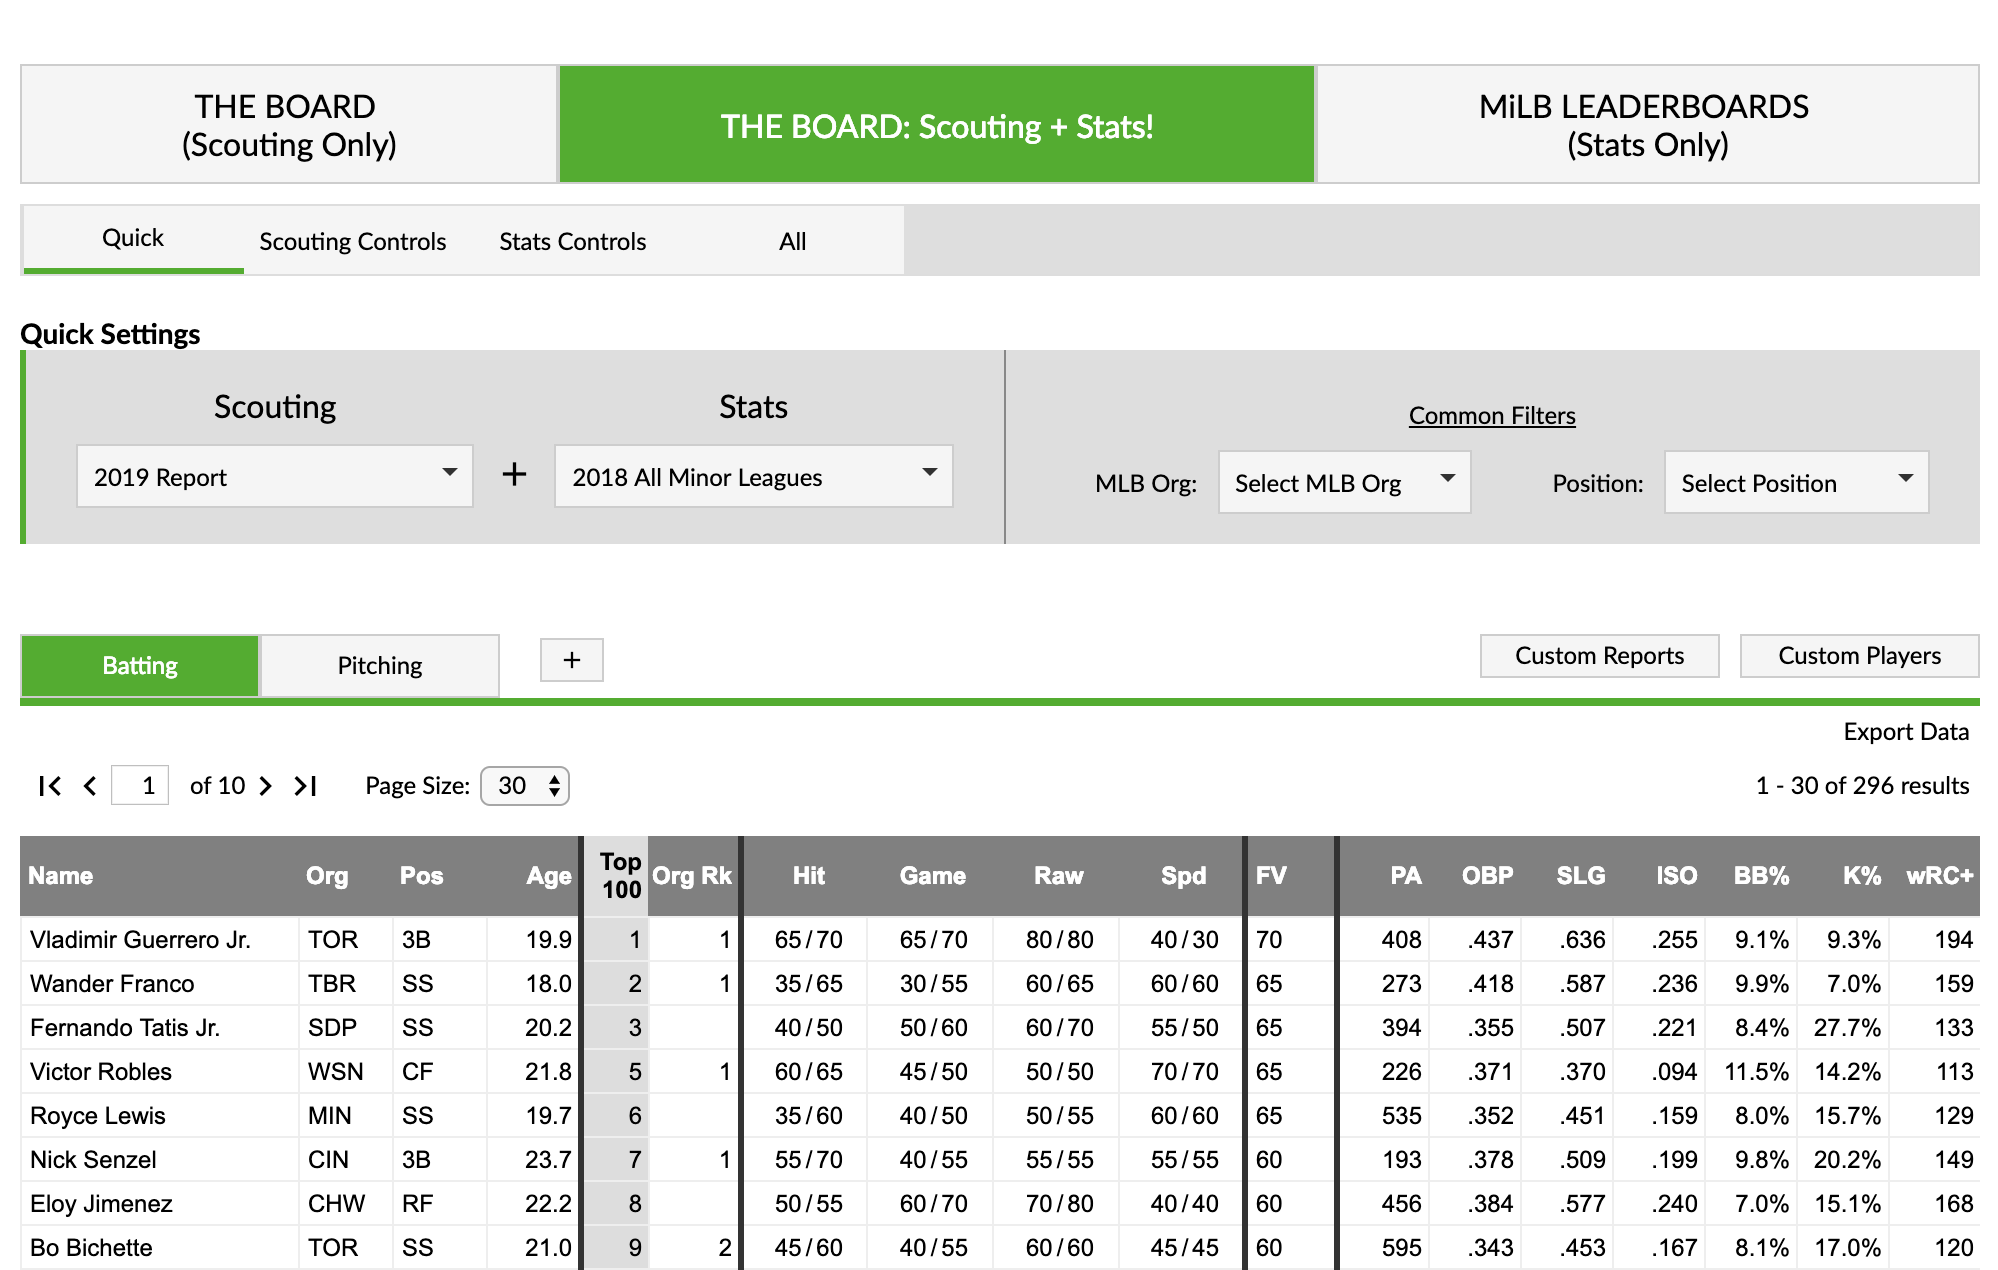
THE BOARD: Scouting + Stats!
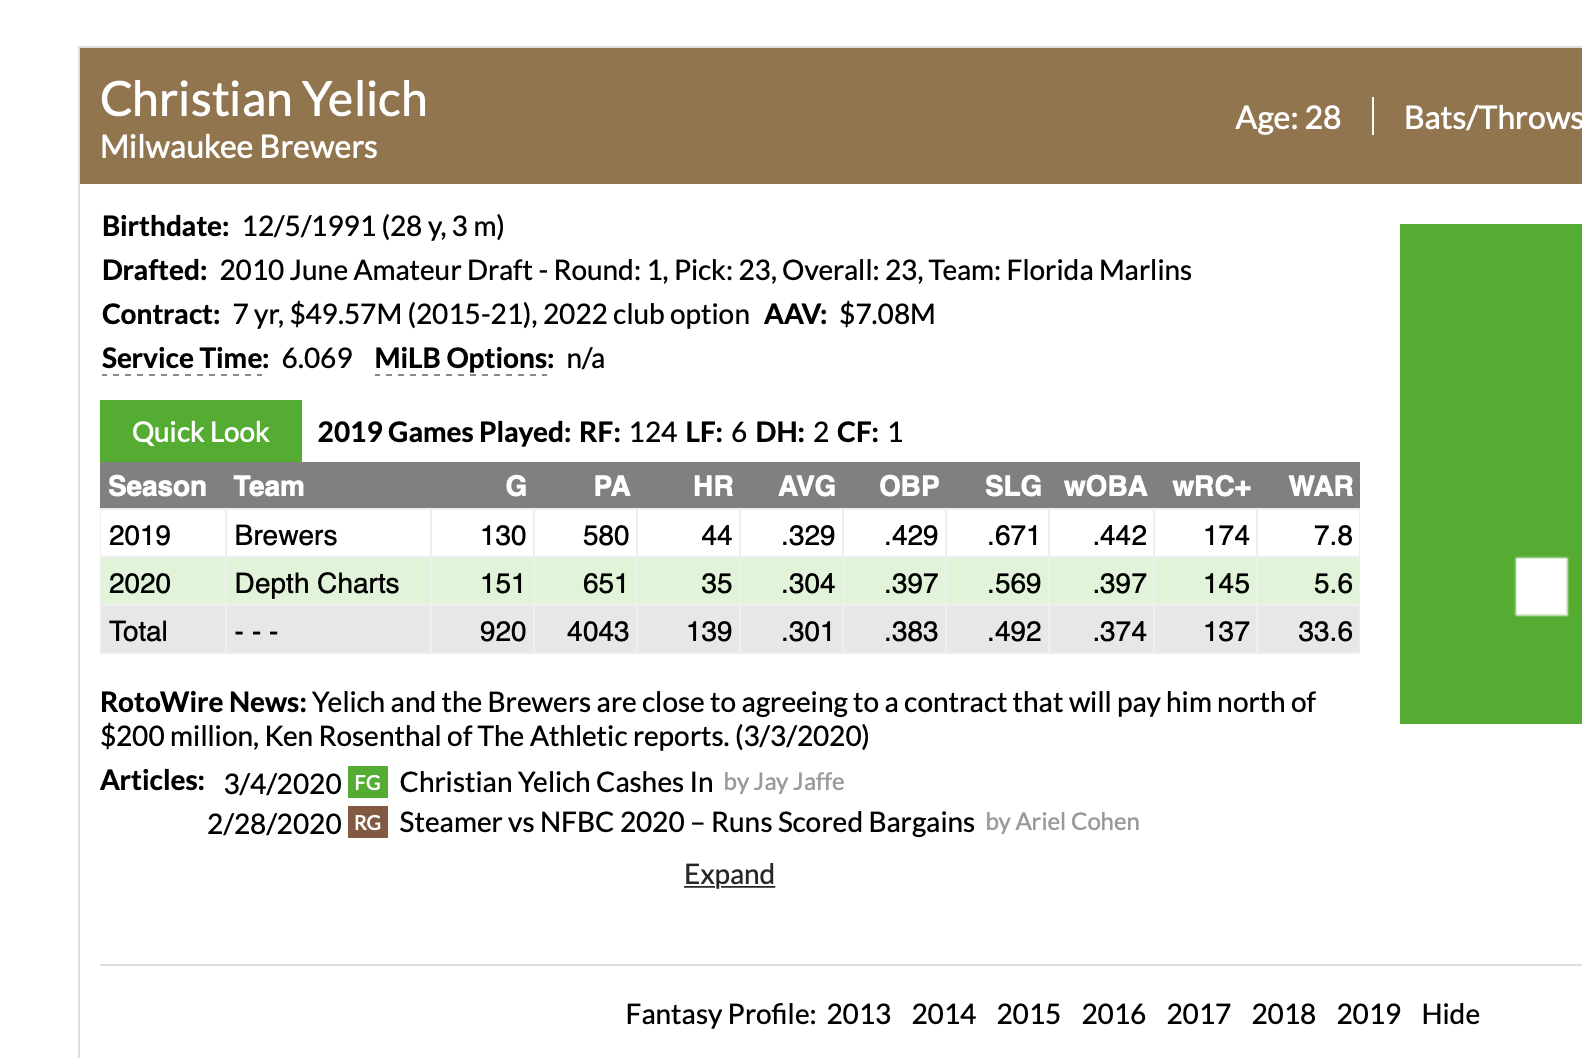
You can think of the combined leaderboard as a Venn diagram or a SQL inner join. Minor league players who are not in the selected prospect list will not appear on the combined leaderboards. Likewise, players without any minor league stats (Shohei Ohtani) are not available on this leaderboard.
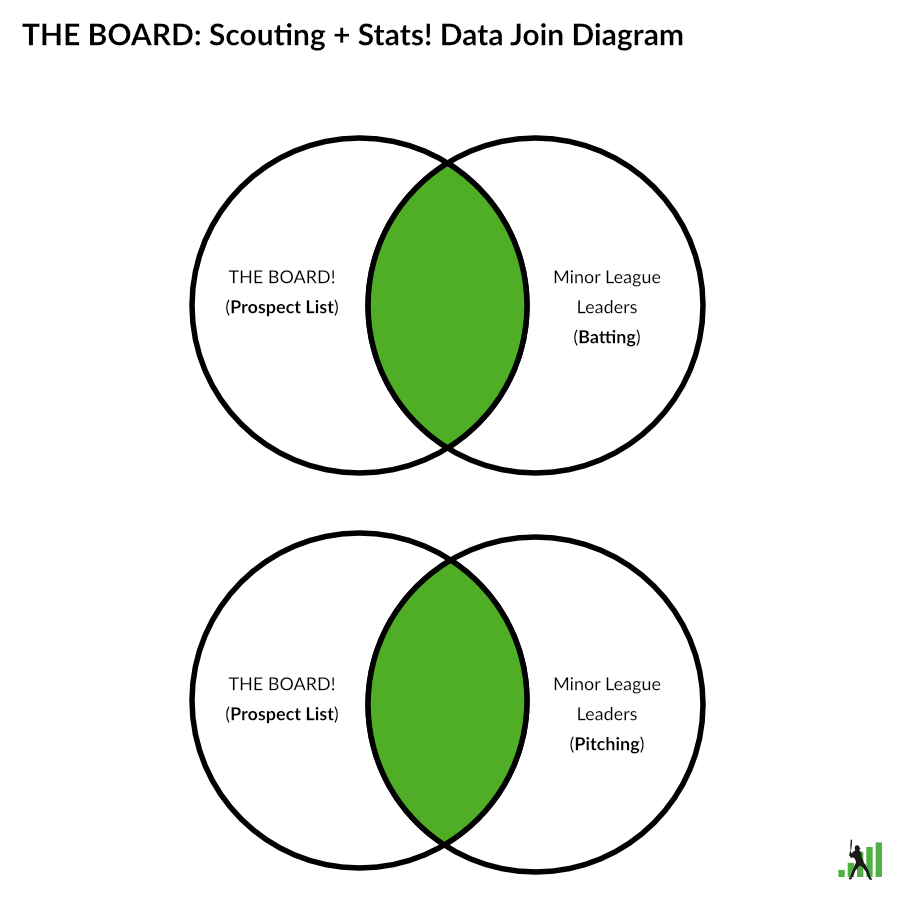
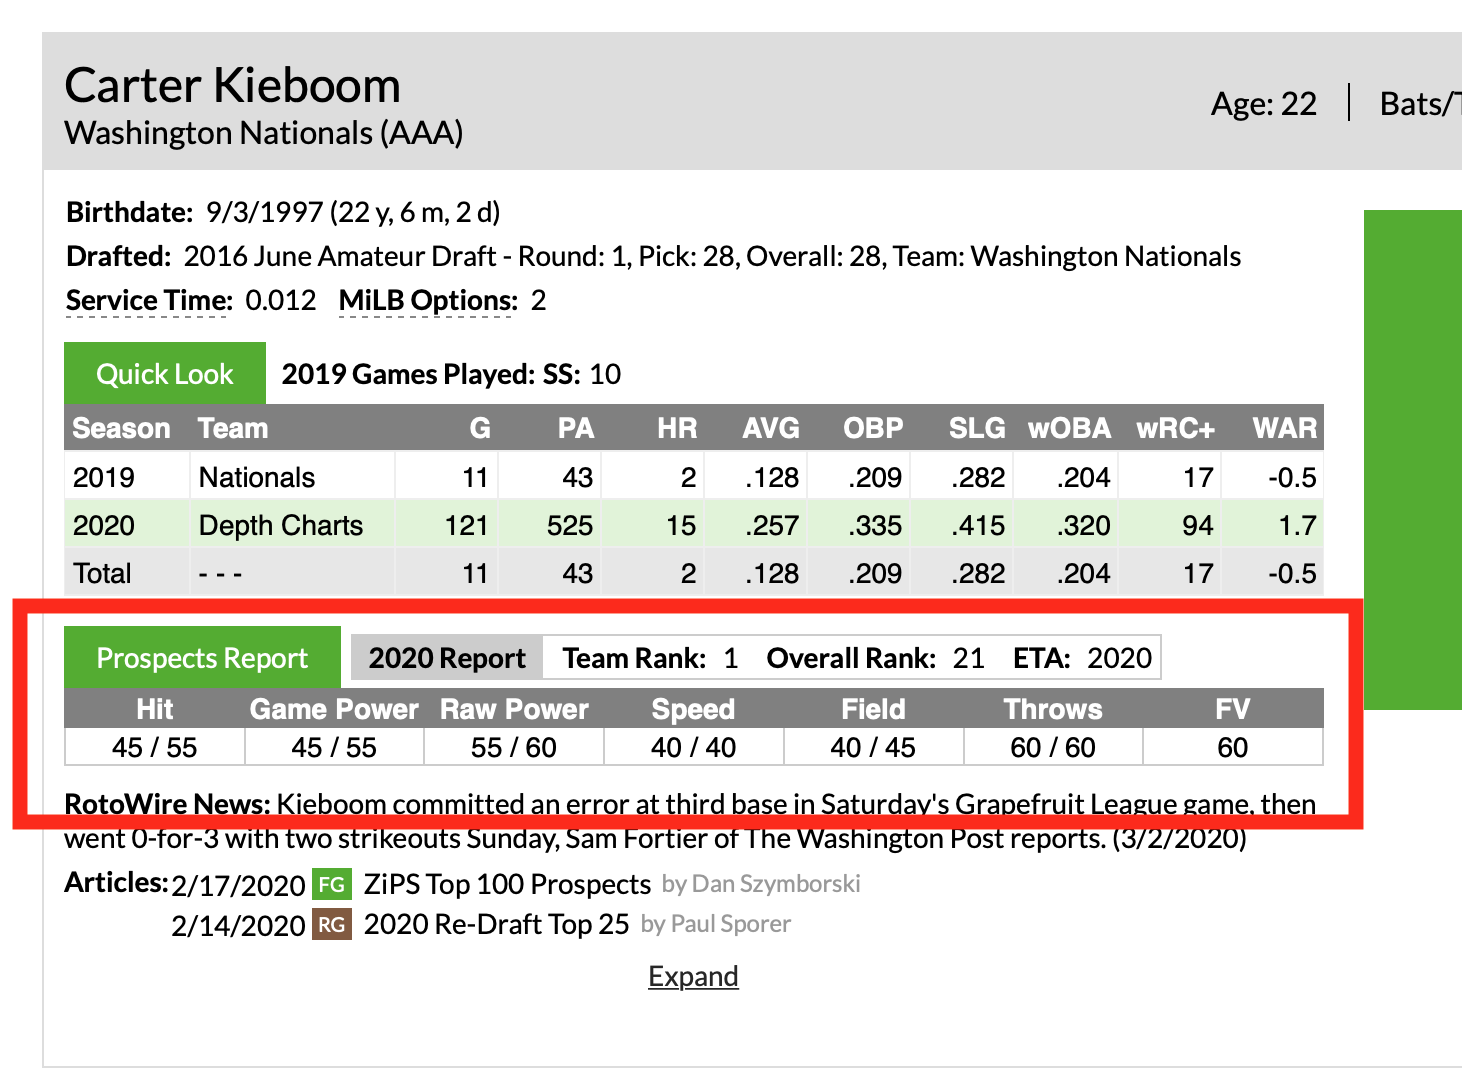
Unforunately, you also can’t mix batting and pitching stats on the same leaderboard; these are still different data sets (pictured in the above data join diagram). The scouting report data is position agnostic, but the stats data still behaves like our traditional leaderboards, so you can only combined one stat data set with the scouting data set.
The filters are organized by the source of data they control. For example, scouting grade filters are on the scouting tab, while the playing time filter appears on the stats tab.
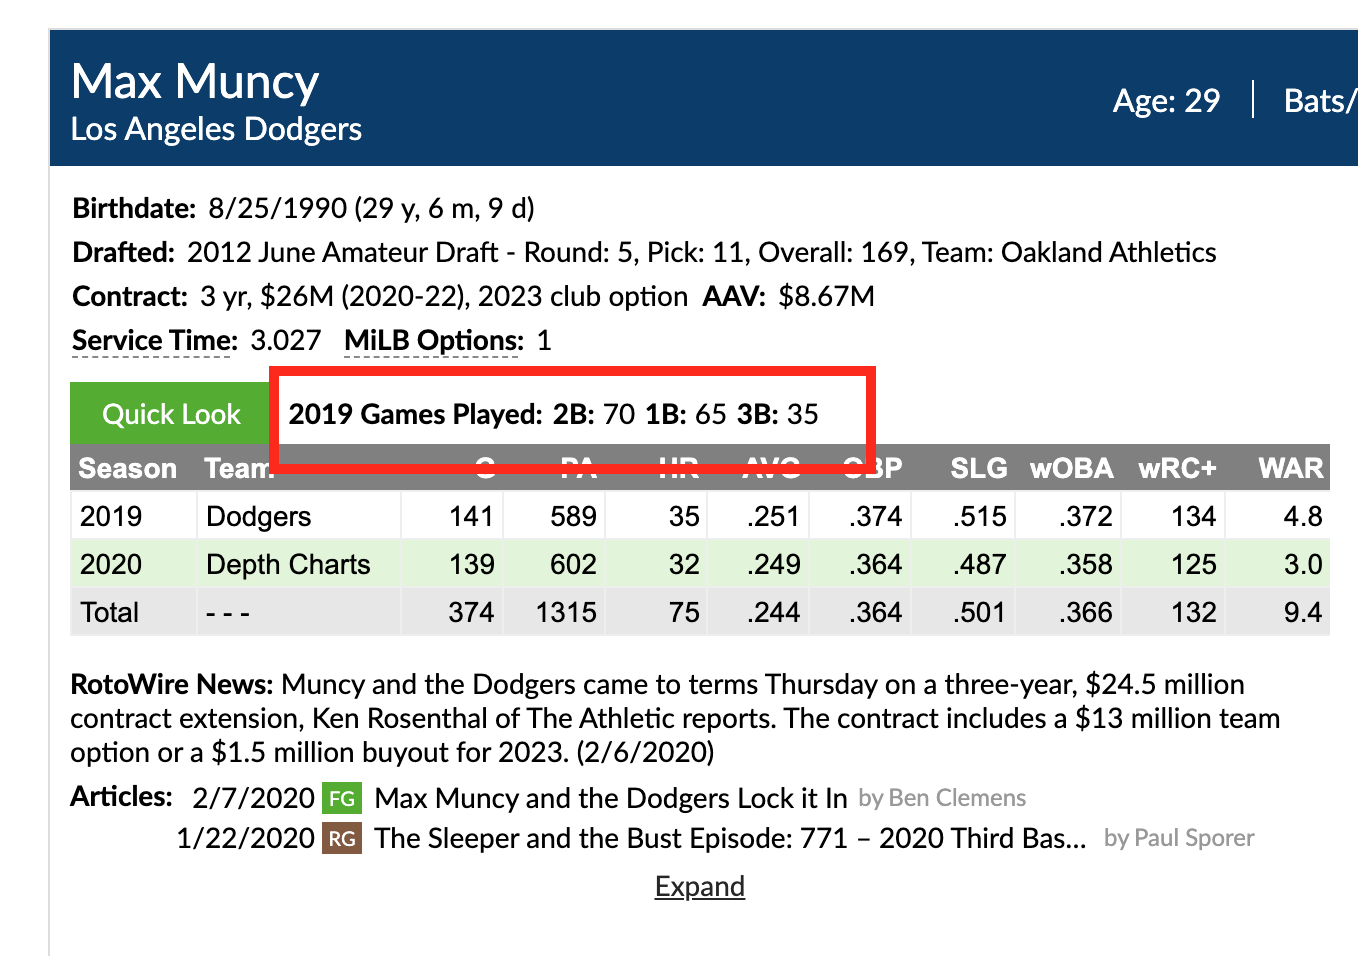
Since there is the possibility of duplicate filters for position and organization, we have those two filters located under common filters. Both filters use data from the scouting data set, so you could look at the stats of a traded prospect regardless of what system he accrued those stats. The position filter uses Eric and Kiley’s classification, instead of what position our leaderboards have for a player. This might change in the future if we deploy more advanced control options.
Important Notes:
- A leaderboard can only contain either batting or pitching stats.
- Right now, we are only including scouting information from prospect lists. There are plans to include draft and international players in the future.
Minor League Leaderboards
The Minor League Leaderboards have been redesigned, and we added a few new features. We added the ability to select multiple seasons and either aggregate them (default option) or have them split into multiple years. The “Split Seasons” option splits the player’s stat line by both season and team. An organization filter has been added so you can group stats across levels by the MLB organization instead of just being able to filter using the affiliate teams. We also included a few new league filters that groups tiers of levels: Upper (AAA/AA), Mid (A+/A), and Low Levels (A-/R). These will allow you to aggregate stats across those tiers.
We don’t always carry legacy tools, but we are keeping the old minor league boards around at least for a bit. These will be available in the leaders menu, but they won’t be the main link. You should be aware these might not always exist, and we are not going to continue developing them. If you are using them as a data source for research, please considering migrating to the new Minor League Leaderboards.
Custom Reports
The Custom Reports for the combined leaderboard and the Minor League Leaderboards are all-new. While FanGraphs has well-established stat groups: Standard, Advanced, and Batted Ball, combining scouting and stats data left us with too many combinations to include everything; this is where the new custom reports come in.
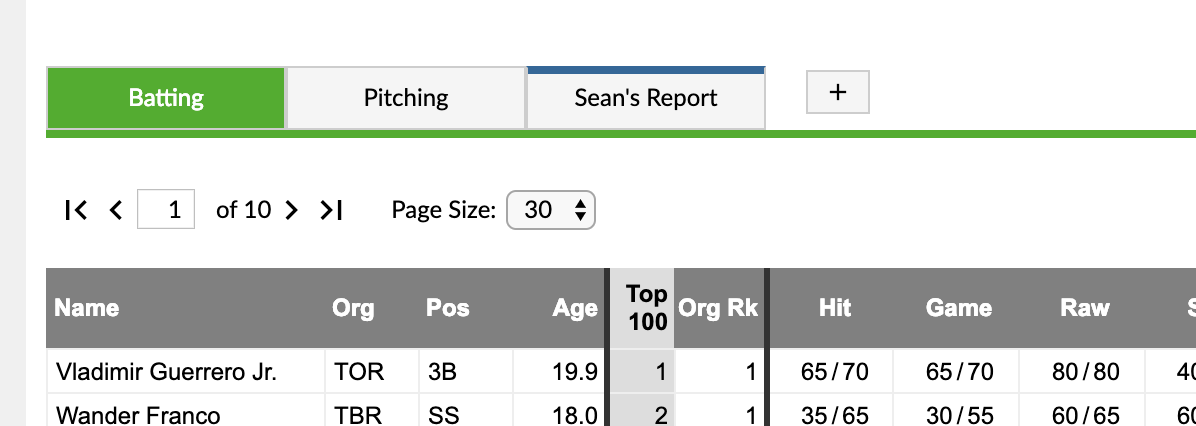
Like the old custom reports you are able to create a leaderboard with your choice of stat columns, filters, and players, but now they can be displayed as blue tabs on the leaderboard for quicker access. You can create a new report by clicking the plus button.
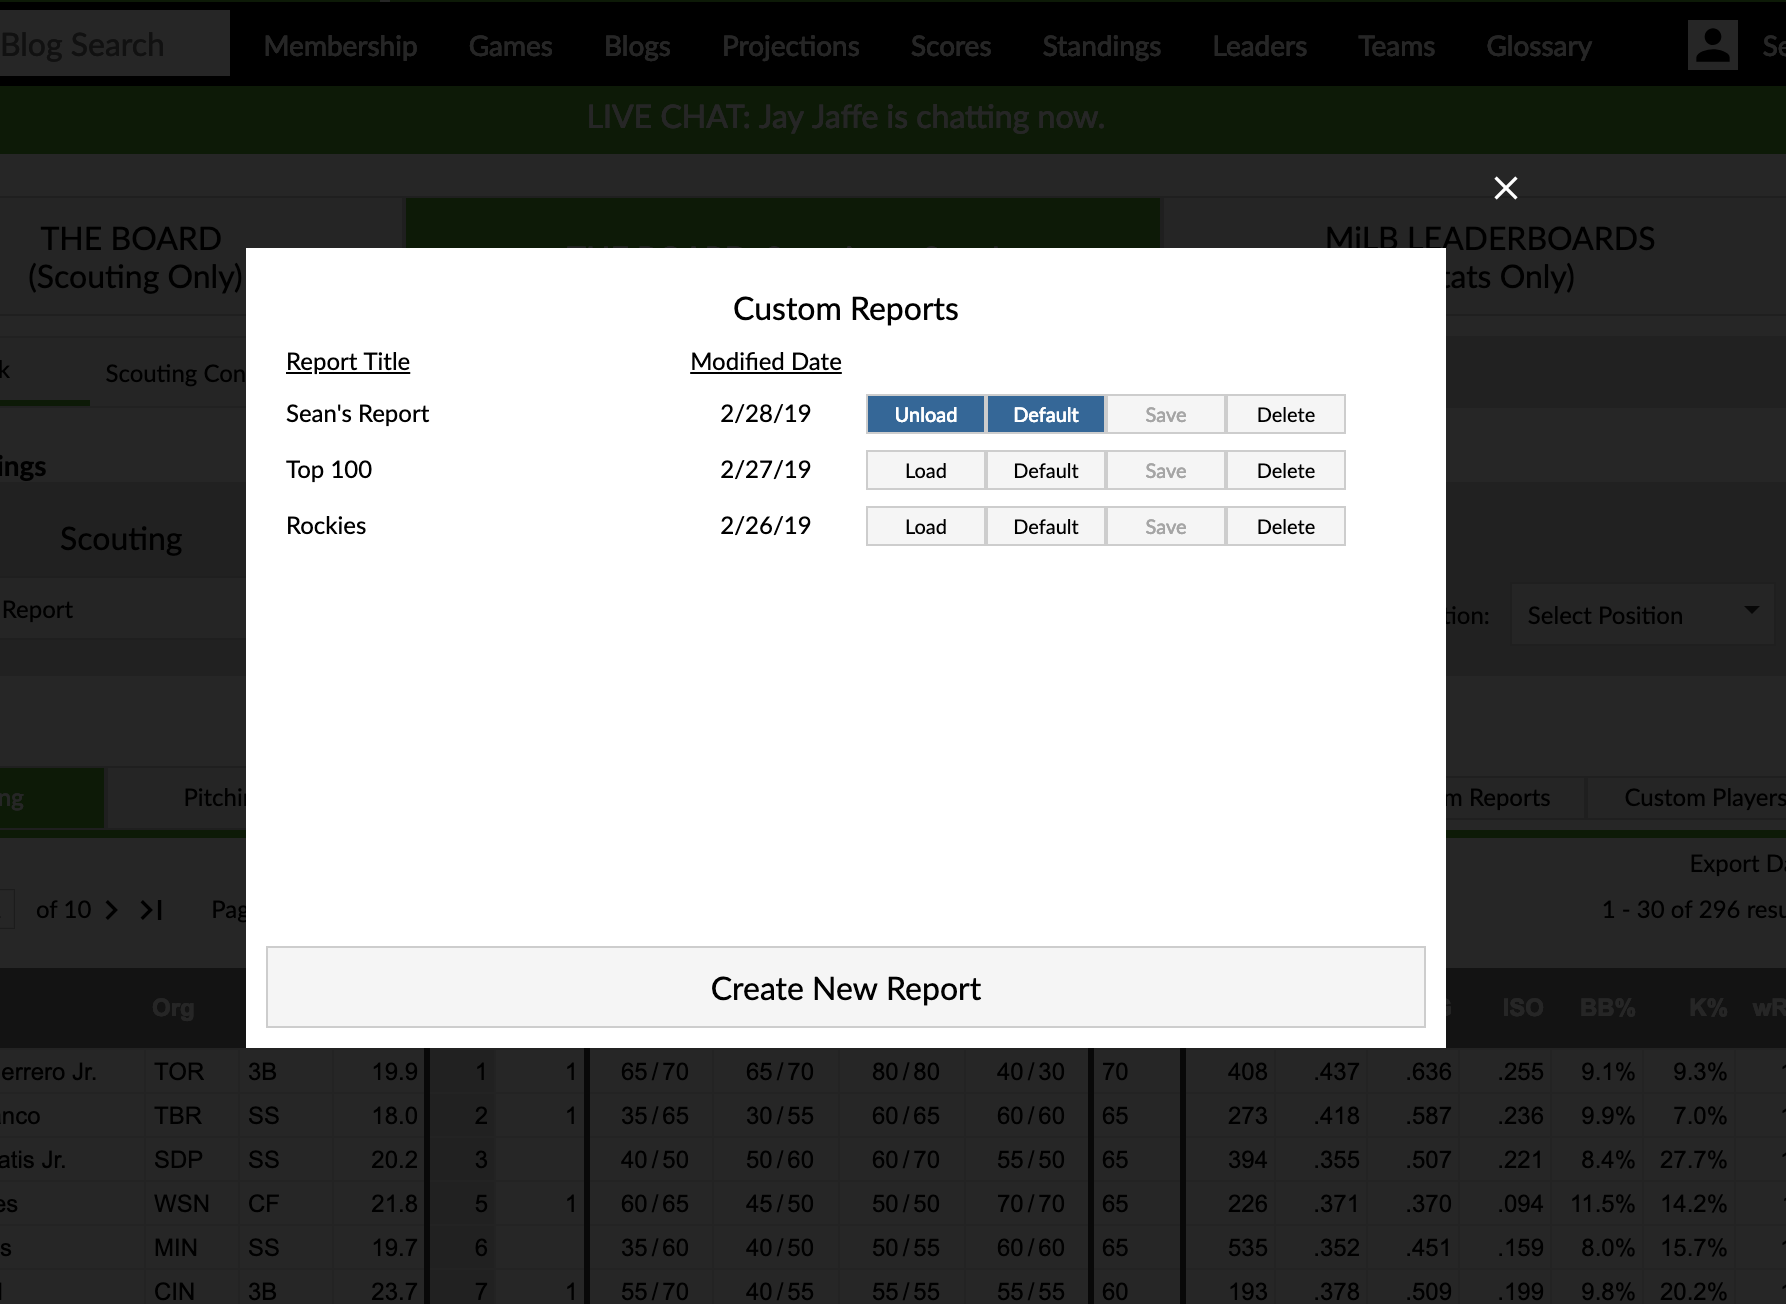
All of your reports for the specific leaderboard are housed in the Custom Reports dialog box accessible from the Custom Reports button on the data grid. In that dialog box, you can manage your reports including loading them into the tab bar and making them load in to the tab bar by default.
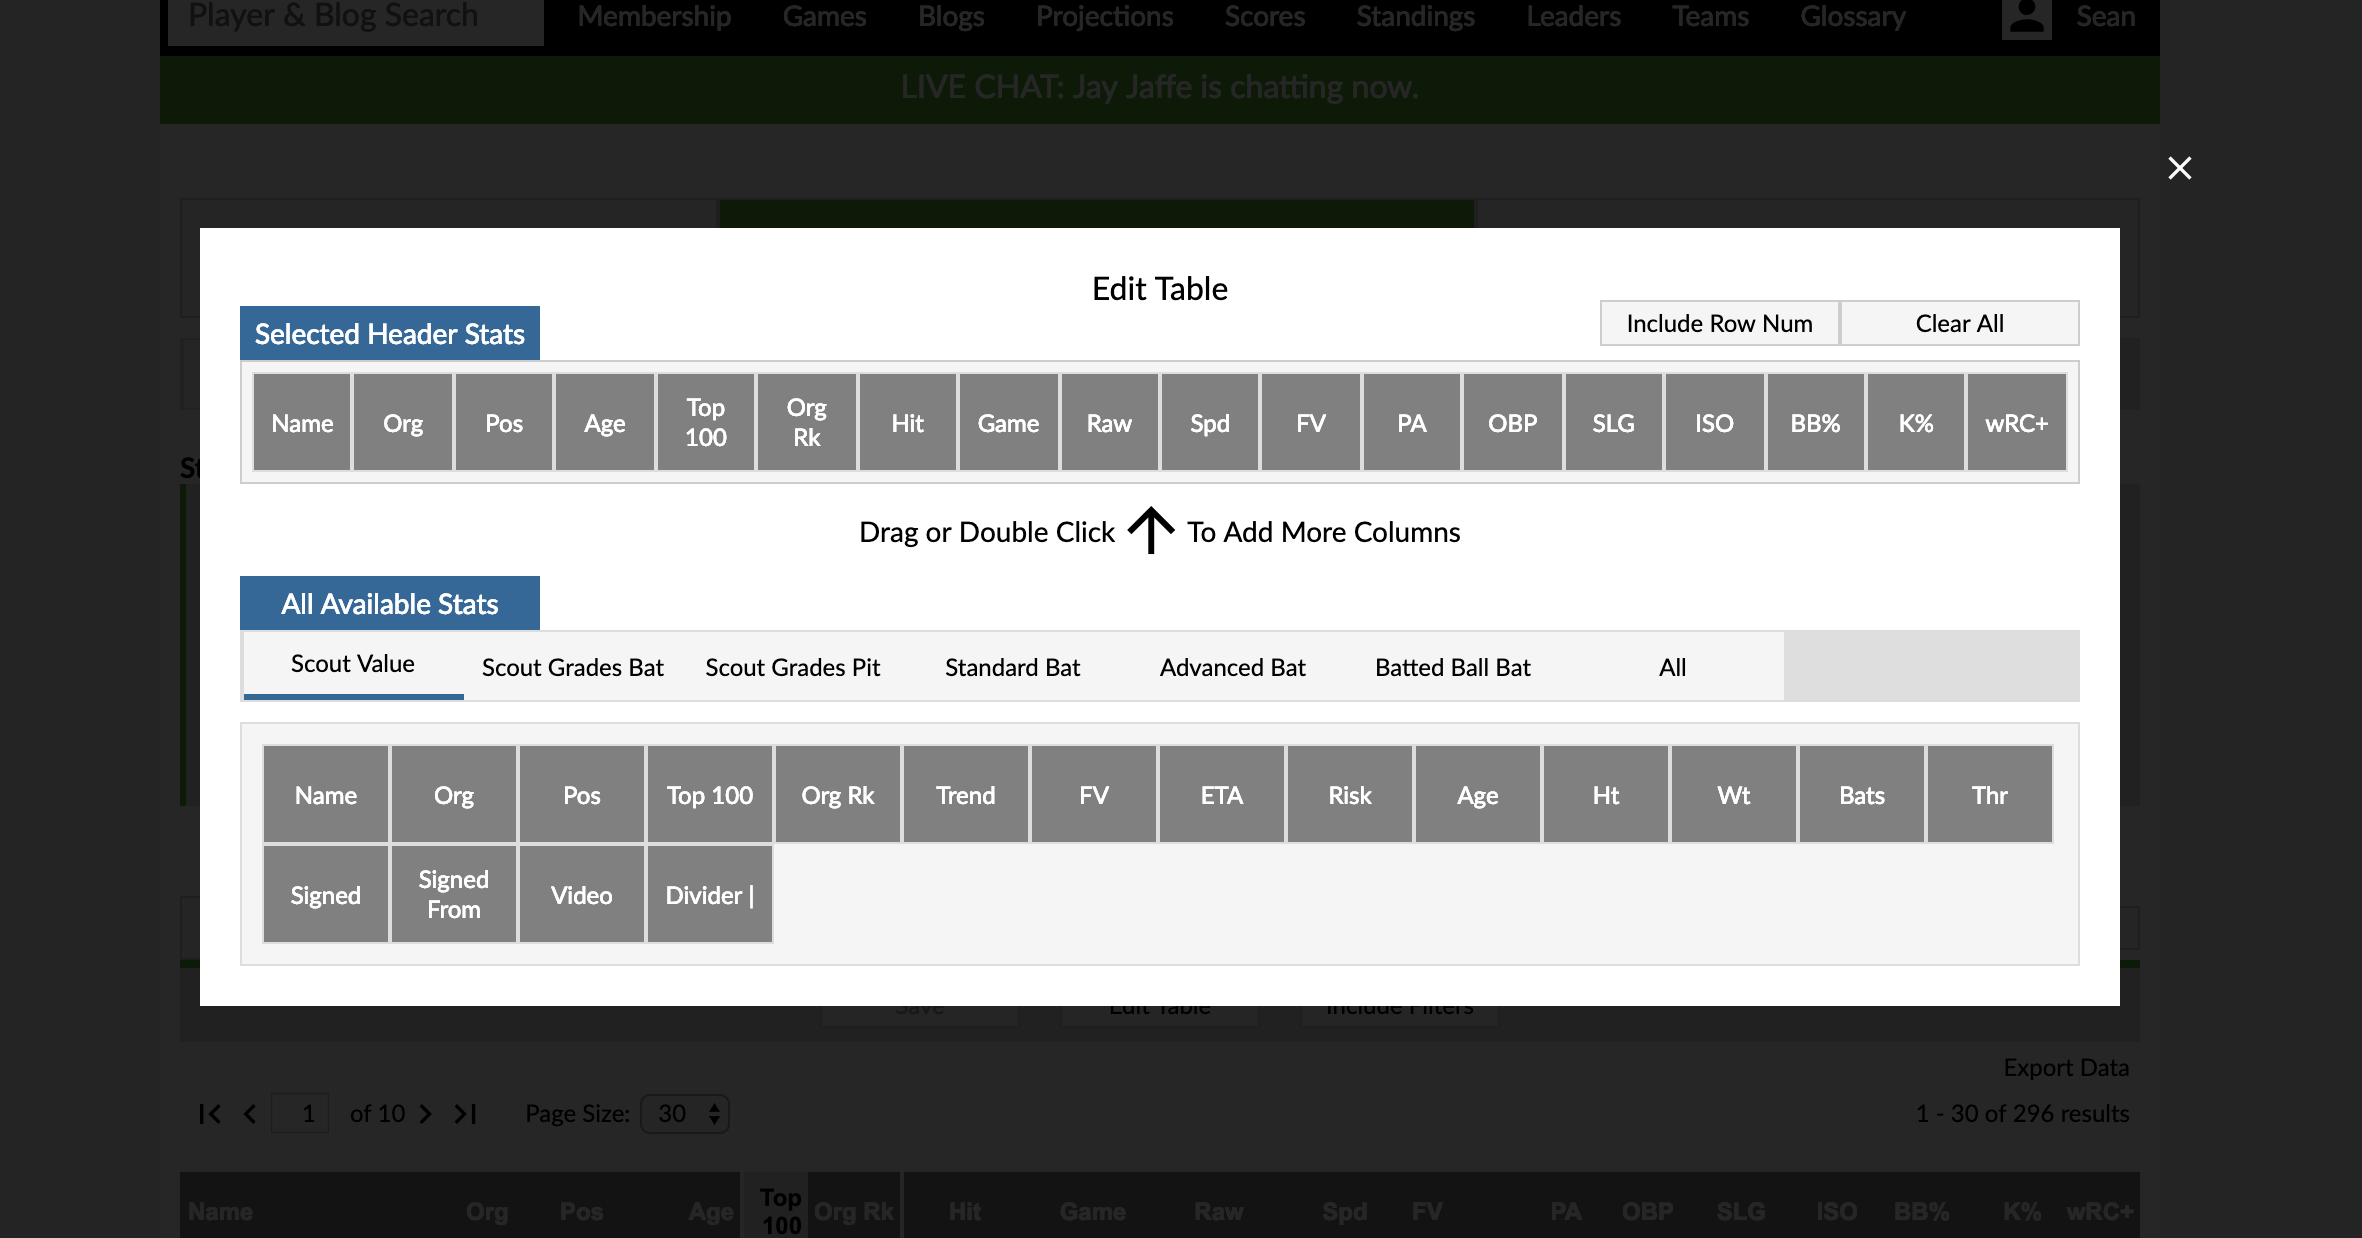
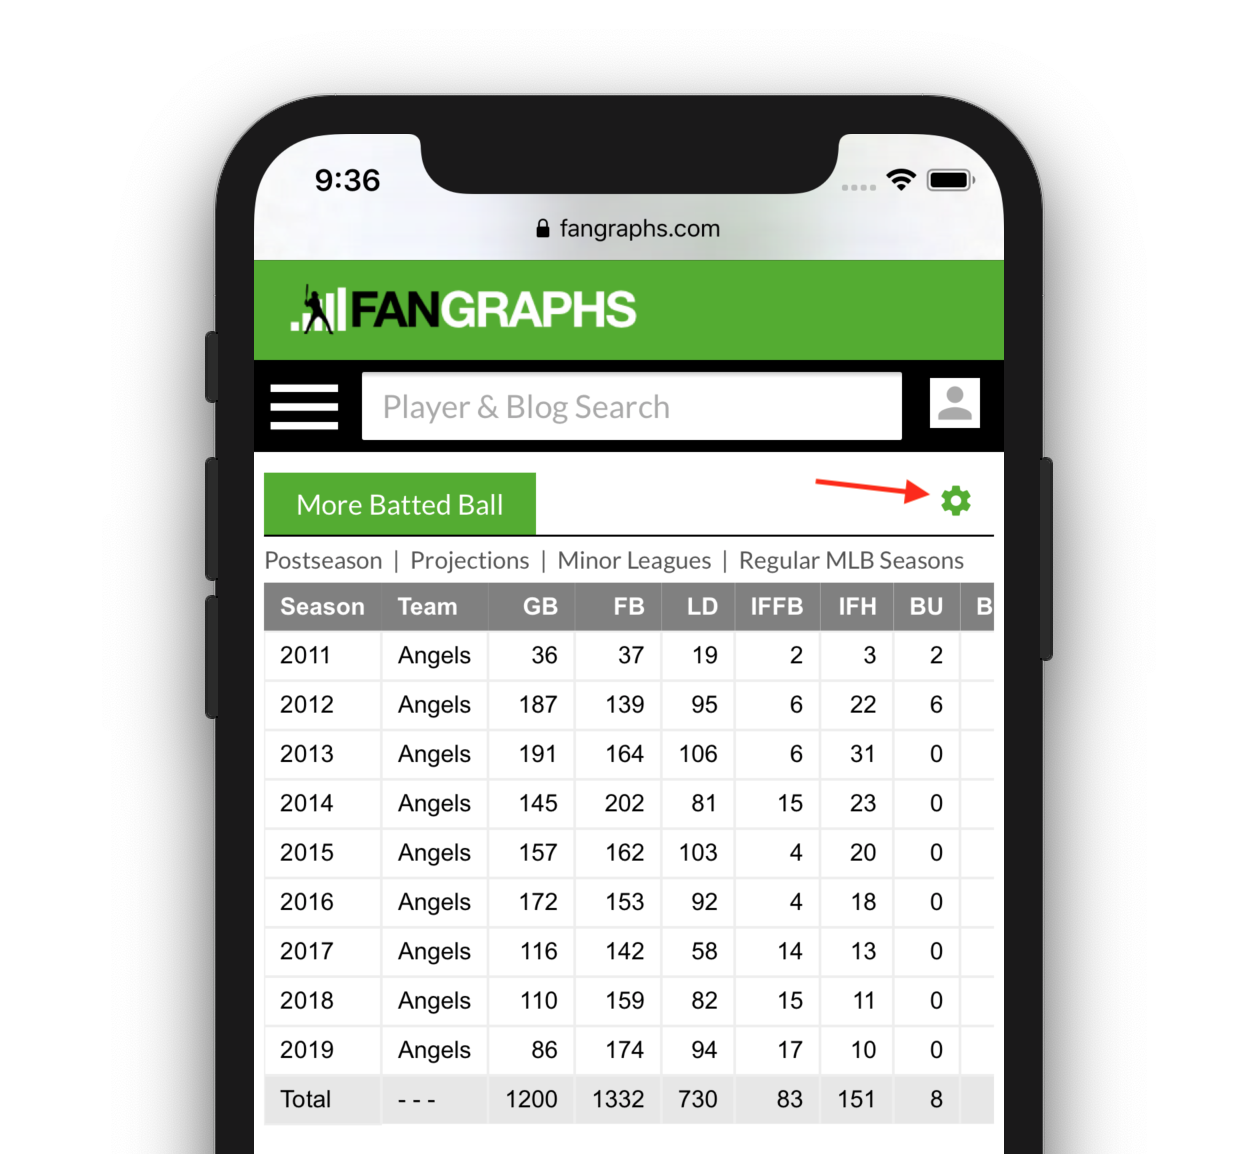
The interface to change the stat columns on the table is also completely new. You can either double click (long press on mobile) or drag/drop stats to customize your report. The columns are organized by the default tab they appear in. Once again, you can’t mix batting and pitching stats, but mixing scouting columns is cool.
Important notes:
- Each report has an owner.
- The owner is the only one who can modify, save, or delete that report.
- You also must be signed into your FanGraphs account to modify, save, or delete any report.
- However, every report is viewable by anyone if you have the URL with the report id in it.
- You can create a copy of a report by viewing it and clicking to create a new report.
- “Edit Table” allows you to choose different columns on the table.
- Turning off the “Include Filters” button allows you to create a report that is agnostic to filters including custom players. This can be used if you want to create a tab with certain stats acting like native tabs.
- Your older minor league reports are still available, though you won’t be able to save them.
Future Notes
- We are in the process of determining how to handle the “current” level for prospects. It’s an addition we want to add to THE BOARD, but it’s not ready for this update.
- While these tools are conceptually connected, they don’t share data between them, so going from the Minor League Leaderboards to THE BOARD: Scouting + Stats! won’t retain settings and filters.
- Custom Reports “belong” to the tool you created them in, so you can’t make one in the leaderboards and use it with the combined leaderboard. This might change in the future, but it’s a restriction for now.