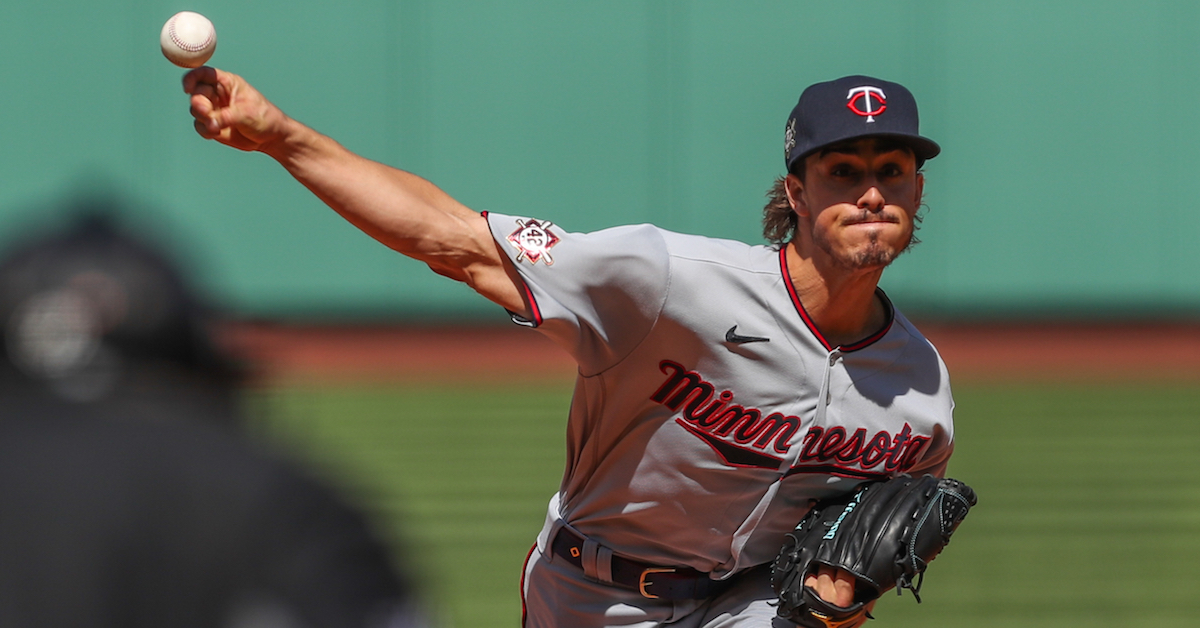
Joe Ryan’s name is well-known to FanGraphs readers, particularly those who are into pitching analytics. As Jake Mailhot wrote when profiling him back in January, the 25-year-old Minnesota Twins right-hander succeeds in part because of an extreme vertical approach angle. Thrown from an atypical arm slot, Ryan’s four-seamer — despite averaging a modest 92 mph — is especially effective up in the zone. As Eric Longenhagen and Tess Taruskin wrote last month, “Throughout his time in the minors, Ryan’s strikeout rate has left many scratching their heads.”
His ability to miss bats has thus far translated to the big leagues. Since debuting with the Twins last September, the former Tampa Bay Rays prospect — Ryan came to Minnesota as part of last July’s Nelson Cruz deal — has allowed just 23 hits, with 41 strikeouts, in 36-and-two-thirds big league innings.
Ryan — No. 6 on our 2022 Minnesota Twins Top Prospects list — discussed his approach angle, and the repertoire that goes with it, prior to a recent game at Fenway Park.
———
David Laurila: The majority of FanGraphs readers are familiar with your pitching profile. That said, how would you describe it?
Joe Ryan: “I’m not sure. I don’t think about it too big-picture, or try to analyze myself in that way. Simplistically, I’m a strike-thrower that fills up the zone, tries to hit my spots, and pitches to my strengths. I’m also always trying to develop new pitches and make everything else better, and more consistent. I’m not trying to overhaul, but rather I tinker a lot. Maybe not a lot, but I am always wanting a little more.” Read the rest of this entry »
Kyle Freeland and the Rockies were set for a tense arbitration session. He had asked for $7.8 million; they countered with $6.425 million. That was the fourth-largest gap between team and player across all of baseball. But good news for people who don’t like contentious negotiations: That’s all in the past, because both parties agreed to a five-year extension that supersedes the arbitration dispute and should keep Freeland in Denver for the foreseeable future.
The deal, which buys out three seasons of free agency, has all kinds of bells and whistles. At its core, it’s a five-year, $64.5 million contract, which will pay him $7 million, $10.5 million, $15 million, $16 million, and $16 million for the next five years. If Freeland pitches 170 innings in ‘26, he’ll trigger a player option for the 2027 season, which would pay him $17 million. But wait, there’s more! If Freeland finishes in the top five in Cy Young voting in either 2022 or ’23, he can opt out after ’24; if he’s showing Cy Young form, he’d presumably do so.
This deal is somehow the largest contract the Rockies have given to a pitcher since Darryl Kile and simultaneously not one of the top five deals signed by starting pitchers since the end of last season. As befits a deal that is simultaneously large and small, I’m of two minds about it. Read the rest of this entry »
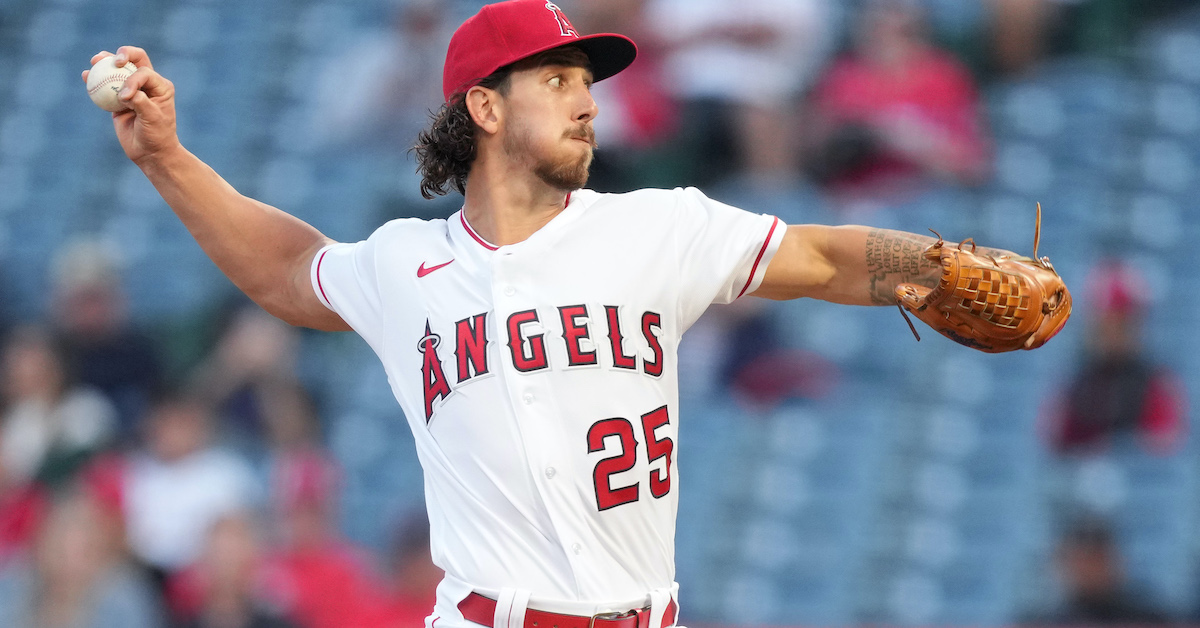
When the Angels signed Michael Lorenzen this offseason, it was hard to say what to expect from him. A longtime member of the Reds’ bullpen for nearly his entire major league career, he entered his first time through free agency looking for an opportunity to start again; making that jump to the rotation came with all sorts of uncertainty. But after just two starts for his hometown team, the early returns have been promising.
The former 38th overall pick began his career as a member of the Reds’ rotation, making 21 starts during his rookie season back in 2015 but posting a 5.45 ERA and a 5.48 FIP and getting relegated to the bullpen by the end of the year. He enjoyed a bit of success in shorter outings the next year and wound up in that role for the rest of his time in Cincinnati. At various points during his time there, Lorenzen regularly expressed a desire to return to the rotation, but spring injuries often played a role in pushing him back to the bullpen. In 2016, it was a sprained ligament in his elbow; in ‘18, a shoulder injury. He was on track to join the rotation last spring until another shoulder injury derailed that plan again.
The fact that Lorenzen made it through spring training without an injury and actually made a start this season has to be seen as an accomplishment. Not only that, but his first outing against the Marlins was outstanding: two hits over six innings and a single run that scored on a Jesús Sánchez solo home run. He didn’t walk a batter and struck out seven. His next start was a much stiffer challenge against the Astros in Houston, where he lasted into the fourth inning but was done in by a lapse in command, issuing a walk and hit by pitch both with the bases loaded. He wound up allowing four runs on four hits and two walks in 3.1 innings of work, striking out two.
While the start in Houston didn’t go as well as his first, Lorenzen has shown some interesting changes to his pitch arsenal that could indicate some more success on the horizon. In his postgame comments after his Angels debut, he discussed his pitch profile:
“I worked really hard this offseason to get my stuff where it needs to be. It’s a lot more fun in the rotation. I’m able to use everything and set guys up certain ways for the next time through. It’s just more fun to do that instead of being limited. I have too many pitches to be limited in the bullpen, so I was just able to take advantage of my pitch profile.”
Even as a reliever, Lorenzen continued to use a full, six-pitch repertoire. He leaned on his four-seam fastball and cutter for the most part, but also sprinkled in a sinker, changeup, slider, and curveball. Read the rest of this entry »
Less than two weeks into the 2022 season, the Braves and Dodgers crossed paths for the first time, not only rekindling the rivalry between the teams that have met in the last two National League Championship Series en route to World Series wins but also presenting the chance for their recent free agent additions Freddie Freeman and Kenley Jansen to receive some well-deserved fanfare in the presence of their old pals. Freeman figured prominently in Monday night’s game, clubbing a solo homer in his first plate appearance against his old team, furthering a strong start with his new one, while Matt Olson, the Braves’ choice to fill his sizable shoes, collected his fourth three-hit game of the young season and briefly took over the major league lead in WAR and the NL leads in batting average and on-base percentage. His team ended up on the short end of a 7-4 score, and he took an 0-for-4 on Tuesday, though the Braves evened the series in a 3-1 victory closed out by Jansen.
Few players in recent memory have been placed under the microscope as swiftly as the 28-year-old Olson. On March 13, he was still the first baseman for the A’s, though amid the team’s umpteenth teardown, multiple suitors had expressed interest in trading for him. A day later, he was suddenly the new first baseman for the Braves, as the defending champions acquired him in exchange for four players, effectively slamming the door on the Freeman era. The day after that, Olson became a franchise cornerstone himself by agreeing to an eight-year, $168 million extension. Read the rest of this entry »
The Learning and Developing a Pitch series is back for another season, and once again we’ll be hearing from pitchers on a notable weapon in their arsenal. Today’s installment features a veteran left-hander, Jake Diekman, and a young right-hander, Griffin Jax, on their signature sliders.
———
Jake Diekman, Boston Red Sox
“I learned a slider in my first year of college, or maybe in my senior year of high school. It was my breaking ball. If you’re under 16 years old, you should not throw a curveball or slider. That’s my opinion. You should just develop a heater — maybe a two-seamer — and a changeup.
“When I started [throwing a breaking ball], I threw it from over-the-top. It was curveball/slider-ish. When you’re 18 years old — this was back in 2005 — no one really gave a care if it was… I mean, we just saw it break. It was, ‘Oh yeah, that’s a breaking ball.’ Now they classify [pitches]. And there are sliders that look like curveballs, and sliders that look like cutters.
“My slider two years ago is different from any slider I’ve ever thrown. You just evolve. Sometimes you’ll keep the same slider for three, four years in a row, and then you start throwing it in spring training or in the offseason and you’re like, ‘I don’t know how to throw this thing anymore.’ You have to find a different seam, different thumb placement, a different whatever. Read the rest of this entry »
Pitchers are scary. I know this because I recently watched an outing byMatt Brash, who, despite his nonexistent command that day, used a scorching heater and two breaking balls to stymie a formidable Astros lineup. He walked six, but those free passes went along with five strikeouts and just two hits allowed. The Mariners won by a score of 7 to 2. So it goes.
Pitchers are scary, and they’re getting scarier, in large part because they’ve developed the ability to throw harder and harder. It probably doesn’t even bear repeating at this point, but because it’s the subject we’re on, let’s refresh ourselves. Back in 2008, the first year with PITCHf/x data, pitchers averaged 91.8 mph on their four-seam fastballs. Last season, they averaged 93.8. That the league as a whole has gained two miles per hour is indicative of substantial change.
It’s 2022 now. It’s early, but so far, pitchers have been averaging 93.9 mph on their fastballs, for an uptick of 0.1 mph. Such a small difference might not seem like much, or something we should focus on right now. But this is merely a cursory glance. We haven’t even separated the starters from the relievers, and it’s the latter group that most people associate with triple-digit wizardry. Are bullpens hiding the fact that rotations aren’t quite stretched out yet due to an abbreviated spring? Let’s find out:
Yesterday, I wrote about the intentional walk heard ‘round the world. It was mostly reflex, really. When someone issues a strange intentional walk, I can’t help but dig through the numbers. But this one, I was quite sure from the start, was bad. The math was just a way of rubbernecking, staring at a baseball accident from across the highway and saying “Wow, I wonder how that happened?”
But in doing so, I didn’t engage Joe Maddon on his weird, hipster-glass-wearing turf. Maddon didn’t say he was trying to minimize run expectancy (though he should have been). He didn’t say he was trying to maximize his team’s chances of winning the game (though he should have been). He said he was trying to “avoid the big blow,” or prevent a big inning in other words.
Bad news, Joe! Using the same simulation I used to estimate run and win expectations, I can work out the chances of a “big blow” for some arbitrary definition of big. Take my initial simulation. I estimated that the Rangers stood to score roughly 1.75 more runs in the inning when Corey Seager came to the plate, before any intentional walk shenanigans. We aren’t limited to looking at that in terms of average runs, though. It can also be expressed as some likelihood of scoring zero runs, one run, two runs, etc:
Richie Palacios barely missed a beat when he returned to action last year. Sidelined for two seasons due to a torn labrum followed by a minor-league summer that never happened, the 24-year-old Brooklyn-born infielder/outfielder came back to slash .297/.404/.471 over 428 plate appearances between Double-A Akron and Triple-A Columbus. His wRC+ was a healthy 141.
Palacios had gotten off to a strong start after being taken by Cleveland in the third round of the 2018 draft out of Towson University. Playing at the lower rungs of the minors, he batted .361 with a .960 OPS in his 45-game introduction to pro ball. He arrived with baseball bloodlines. His older brother, Josh Palacios, made his major league debut with the Toronto Blue Jays last year and is now with the Washington Nationals, while their uncle, Rey Palacios, played for the Kansas City Royals from 1988-90.
Richie Palacios — No. 32 our newly-released Cleveland Guardians Top Prospect list — discussed his post-injury learning curve, and his “Let The Kids Play” approach to the game he grew up with, during a November stint in the Arizona Fall League. Read the rest of this entry »
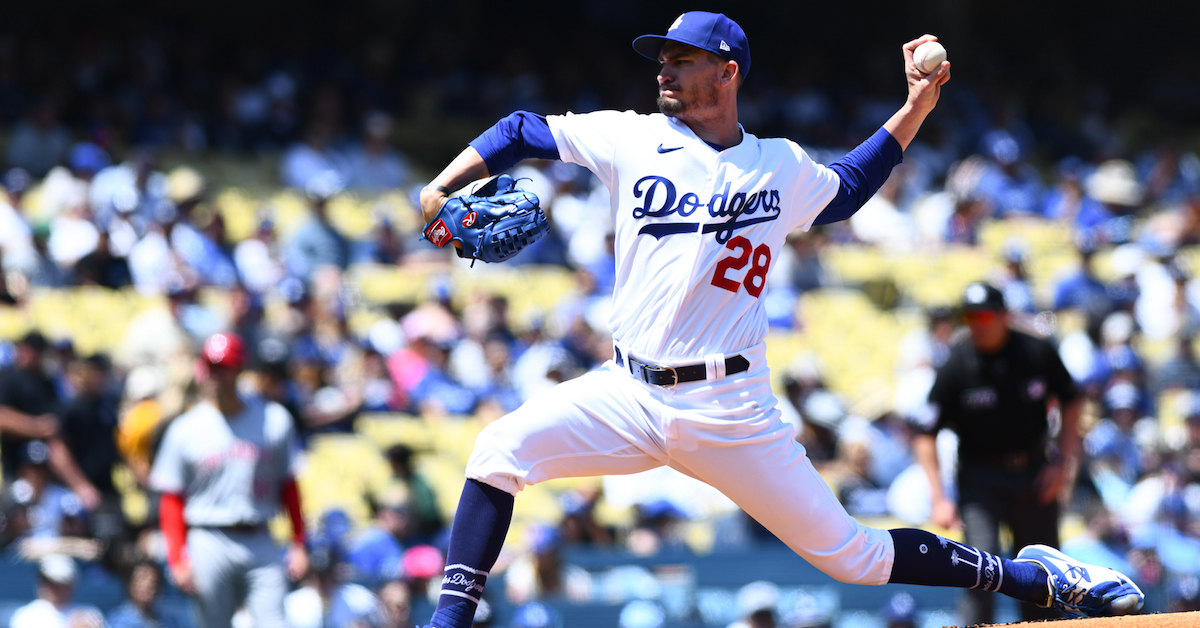
Clayton Kershaw isn’t the only Dodgers lefty who has been putting up zeroes. So far in the young season, Andrew Heaney has thrown 10.1 innings without allowing an earned run through his first two starts, including one on Sunday, when he held the Reds to just one hit over six innings while striking out 11. In the wake of a disappointing 2021 campaign, Heaney has overhauled both his delivery and his repertoire, and it has quickly paid dividends for the Dodgers.
The 30-year-old Heaney signed a one-year, $8.5 million deal with Los Angeles on November 10, a surprisingly quick and lucrative signing for a pitcher coming off such a forgettable season. He didn’t crack our Top 50 Free Agents list, but he was the first free agent signed to a major league deal last fall, that after reportedly more than a dozen teams, including the Blue Jays, Cardinals, Nationals, Red Sox, and Reds, expressed interest.
Heaney spent the first four months of the 2021 season with the Angels, whom you may recall actually acquired him from the Dodgers in exchange for Howie Kendrick in what was effectively a three-way deal with the Marlins back in December ’14, at the dawn of the Andrew Friedman era. On the heels of three years of more or less league-average work with the Angels — and fewer injuries than usual — Heaney was hit for a 5.27 ERA through the first four months of last season, though his FIP was a more promising 4.06. As suggested by his .319 BABIP at the time, the gap between those two numbers owed something to his pitching in front of one of the majors’ worst defenses, and so his July 30 trade to the Yankees in exchange for prospects Janson Junk and Elvis Peguero made some sense. Old friend Eno Sarris summarized Heaney’s appeal:
Very interested to see what Matthew Blake does with Andrew Heaney. He’s always off the charts by advanced metrics (104 Stuff+, 107 Command+, top 25 K-BB), has high spin, low slot 4-seamer, and has underperformed his estimators. Tough park, but maybe some clay here to be molded.
Heaney began his Yankees career in inauspicious fashion on August 2, serving up four homers in four innings — or really, four homers in the span of six batters while making his second run through the Orioles’ lineup. Things went downhill so quickly that by the end of the month he had lost his rotation spot, and made just one relief appearance after September 13. He was tattooed for a 7.32 ERA and 6.93 FIP in just 35.2 innings for New York, and finished the year with a 5.83 ERA and 4.85 FIP, his worst marks in any of the five seasons in which he’s pitched at least 50 innings.
Even given those gaudy numbers, it’s not hard to see the more tantalizing aspects of Heaney’s performance, some of which Sarris referenced. He stuck out 26.9% of all batters while walking just 7.3%; his strikeout-walk differential of 19.5% ranked 31st among the 129 pitchers with at least 100 innings last year, and was within 0.3% of the likes of Joe Musgrove, Walker Buehler, Alex Wood, and Frankie Montas, all of whom had successful seasons. Per Statcast, his 32.5% chase rate placed him in the 91st percentile, and the 2,443 rpm spin rate on his four-seam fastball put him in the 90th percentile.
That good stuff was undone by his allowing 2.01 homers per nine, the majors’ sixth-highest rate among pitchers with at least 100 innings. Heaney’s 89.3 mph average exit velocity (36th percentile), 40.8% hard-hit rate (32nd percentile) and 9.4% barrel rate (21st percentile) were nothing to write home about, either. His fastball averaged 92.0 mph, but on contact, it was hit for a .271 average and .537 slugging percentage.
As The Athletic’s Fabian Ardaya summarized, the Dodgers and other teams interested in Heaney liked his skill set enough to overlook last year’s results:
“His fastball possesses the type of characteristics teams crave. When he’s right, he’s shown an ability to miss bats. Los Angeles has shown an ability to better access that with certain arms, tailoring their pitching development to individualized results in a collaborative effort from the front office on down.”
In short order, the Dodgers have worked with Heaney to rebuild his mechanics, adjusting his arm slot, correcting his tendency to become too rotational, and placing him in the middle of the rubber instead of moving from side to side in search of a fleeting advantage. Their biggest move, however, was to junk Heaney’s curveball, which had below-average horizontal and vertical movement, in favor of a sweeper, a popular new variant of the slider that gets more horizontal movement. According to Sarris, on the Dodgers’ staff alone, seven pitchers including Buehler, Julio Urías, Blake Treinen, and Evan Phillips added a sweeper or adjusted their breaking balls to become one last year (Urías calls his version a slurve). Wrote Sarris in October. “[F]or most Dodgers sliders, the difference between the spin axis the batter sees, and the movement he expects from that spin axis — a phenomenon known as seam-shifted wake — is significant. That unexpected movement is up and out, so these sliders generally have less drop and more sweep than they appear they will as they spin out of the hand.”
When Heaney signed, Baseball Prospectus‘ Michael Ajeto correctly anticipated that the Dodgers would work to add a sweeper to his repertoire, given the mediocrity of his curve and changeup. Wrote Ajeto:
“Sweepers are great pitches in a vacuum, and if Heaney succeeds in folding one into his repertoire, he’ll almost certainly add more whiffs to his profile. But, like any pitch, its success is still dependent on its relationship with the pitcher’s fastball. Heaney’s fastball and changeup get more arm-side movement than average, and so it only makes sense that Heaney would take his curveball and make it move more side-to-side.”
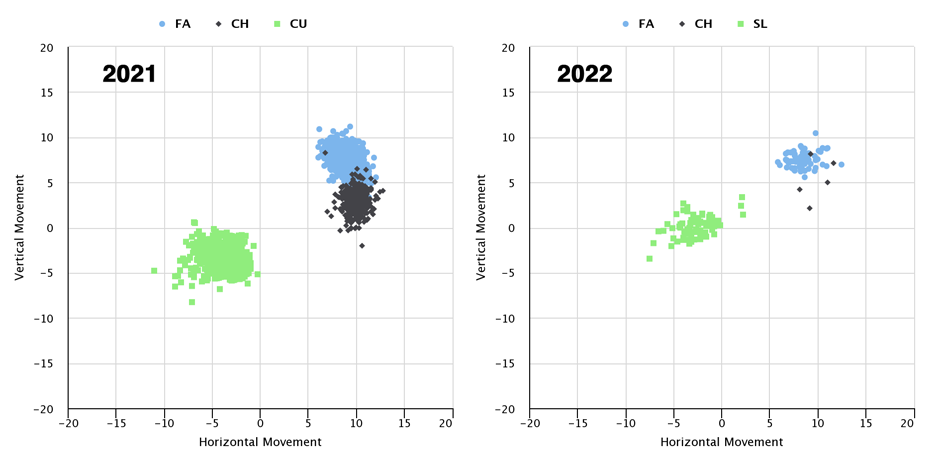
Spoiler alert, that’s more or less what’s happened:
Via Statcast, Heaney’s curve averaged 46.8 inches of drop last year, whereas the new slider has averaged 39.9 inches. The new pitch actually gets less horizontal movement in an absolute sense (5.6 inches versus seven), but more movement relative to its vertical drop.
Given a spring training compressed by the lockout, the Dodgers and Heaney had a lot of ground to cover, and they could be forgiven if this overhaul wasn’t yet ready for prime time. So far, however, the results have been eye-opening. In his first appearance, on April 12 against the Twins, Heaney threw 4.1 shutout innings, allowing just three hits and an unearned run while striking out five. He generated 15 swings and misses on just 67 pitches, nine of which came from among his 34 sweepers (sliders, as Statcast records them, though at Baseball Prospectus, the Pitch Info leaderboard separates them out), including two put-aways apiece against Byron Buxton and Gary Sánchez:
Heaney also got six whiffs and eight called strikes from among his 30 four-seam fastballs, for a 47% CSW on the pitch and a 37% CSW overall.
On Sunday, Heaney retired the first seven batters he faced, five of them by strikeout. He struck out leadoff hitter Kyle Farmer and then four and five hitters Joey Votto and Tyler Stephenson via sliders, finishing the side off in the second by getting Aristides Aquino looking at a low fastball. He began the third by getting Mike Moustakas swinging at a slider, but walked Brandon Drury, and two batters later served up a double to Farmer, though Drury held at third. He escaped the jam, and worked around a two-out walk of Stephenson in the fourth while striking out Tommy Pham, Votto, and Aquino all swinging at sliders. He ended the fifth by whiffing Jake Fraley on a slider, and sandwiched strikeouts of Tyler Naquin (fastball) and Votto (slider) around a two-out walk of Pham in the sixth. Whew!
That was the first time Votto struck out three times in the same game against one pitcher since August 25, 2020, when Brandon Woodruff did a number on him. To find the last time a lefty did it to him, one has to go all the way back to September 10, 2010, when the Pirates’ Paul Maholm did so, joining the Giants’ Jonathan Sanchez (April 25, 2008), the Brewers’ CC Sabathia (four times on September 10, 2008), and Kershaw (August 30, 2009). Welcome to the club, Andrew Heaney.
According to Statcast, on Sunday Heaney got 14 whiffs from among his 39 sliders; throw in those four called strikes and that’s a 46% CSW for the pitch, and again a 37% CSW overall. For the two outings, the slider has produced a 36.5% swinging strike rate, and a 51.1% whiffs per swing rate. When batters have connected on the pitch, they’re 2-for-20, with both hits doubles.
Which raises a cautionary point: While Heaney is missing bats galore with his new toy, he’s also giving up a lot of hard contact. Batters have averaged a 93.3 mph exit velocity on the 20 balls they’ve put in play across his two starts, with a 55% hard-hit rate; all four hits he’s surrendered have been doubles, and loud ones at that, two by the Twins’ Carlos Correa (100.3 mph and 105.5 mph), one by Max Kepler (106.5 mph), and one by Farmer (97.3 mph). Hitters have only barreled one ball against him — a 108.2 mph third-inning lineout by Naquin that Cody Bellinger had to run down in center field — but of the eight balls the Reds put into play, five had xBAs of at least .370. Additionally, while sweepers tend to cause a lot of popups, Heaney has yet to generate a single one. But even with those hard-hit balls, the mix has still been favorable enough for Heaney that his xERA based on his Statcast numbers is 1.99.
On another positive note, the new-look Heaney has so far held lefties to a 1-for-13 showing, that after they cuffed him at a .280/.340/.451 (.339 wOBA) clip over the previous three seasons, compared to .243/.305/.463 (.324 wOBA) by righties. Small sample, obviously, and with regards to the new pitch, demonstrative of the extremes illustrated above: he’s finished five lefties off with the slider (including Votto three times), but of the two put into play, Naquin not only scorched that liner to Bellinger but also hit a similarly hot grounder (108.3 mph), albeit right at second baseman Gavin Lux.
For as impressive as his new offering is, it’s worth noting that Heaney is basically just working with two pitches; he’s thrown the four-seamer 48.7% of the time this year, the sweeper 48.1%, and his changeup just 3.2% (five times). Odds are that those limitations, and the hard contact, will catch up to Heaney, but for the moment his performance stands as an impressive testament to the quick makeover he and the Dodgers have undertaken.
Intentional walk. Bases loaded. Mike Trout staring homeward in disbelief:
Was this a solid baseball decision by the numbers? No. No, it was not. I don’t really have to do the math to tell you that. But doing the math is what we do here at FanGraphs, so just to be certain, and also just for the sake of doing it, I ran through the details. You don’t have to read this article to learn whether it was a good choice or not. I’m telling you that part right up front – it wasn’t. Read the rest of this entry »