Archive for Featured Photo

Frank Robinson, Superstar Slugger and Trailblazer (1935-2019)

Frank Robinson always went into second like a guy jumping through a skylight with a drawn Luger.”
Jim Murray, Los Angeles Times, May 10, 1974

Frank Robinson may not have had the mythic grace of Willie Mays running down a drive to center field, or the staying power of Hank Aaron as he chased Babe Ruth’s hallowed home run record, but the mark he left on baseball, through the combination of his supreme talent and white-hot intensity, was of similar caliber. Though he never played in the Negro Leagues, as both Mays and Aaron briefly did, he was the spiritual heir to Jackie Robinson in bringing the Negro Leagues’ hard-charging style of play to the majors, and in blazing a trail beyond his playing days. At the tail end of a 21-year major league career that made him a first-ballot Hall of Famer, Robinson became the majors’ first African-American manager, and he spent more than 40 years working in baseball at the managerial and executive level.

Robinson passed away on Thursday at the age of 83 after battling cancer. Since 2015, he had served as a special advisor to the Commissioner and the honorary president of the American League, the final lines on one of the fullest resumés any player has ever assembled. Read the rest of this entry »


Phillies Acquire Great Catcher in Exchange for Mystery Box

Everyone is waiting for the Phillies to sign one of Bryce Harper and Manny Machado. It seems almost inevitable that the Phillies will sign one of Bryce Harper and Manny Machado. There’s some chance it even happens today! Who knows? But while the world has waited for the Phillies to signal that they’re going for it, they’ve already added a new everyday outfielder in Andrew McCutchen. They’ve already added a new everyday shortstop in Jean Segura. They’ve already added a new late-inning reliever in David Robertson. And now they’ve added a new regular catcher.

Phillies get:

Marlins get:

And so ends the drawn-out, months-long Realmuto sweepstakes, that saw him connected to a couple handfuls of teams. Just last week, I thought Realmuto was going to be traded to the Reds. The Phillies came almost out of nowhere. But, like the Reds, they’ve spent the offseason acting aggressively, and I can’t imagine they’re finished. The NL Central is going to be a hell of a division. And, the NL East is going to be a hell of a division. The Marlins are going to get beat up on the regular as a consequence, but then, they knew what they were getting into.

Read the rest of this entry »


Let’s Talk About a Bunch of Proposed Changes to Baseball

You’re all a great resource, and I love a good poll. I just polled you on Tuesday! In light of how this offseason has gone, I asked whether you’d prefer an MLB-style offseason, or an NBA-style offseason. Sure, the timing of the poll might’ve somewhat biased the results, but, anyway, thousands of you have voted, and two-thirds of you say you’d prefer an NBA-esque feeding frenzy. Yeah, things would die down almost as quickly as they picked up, but that must be a hell of a high, when all the action happens at once. Baseball could never contend with that.

Now I’m back to poll again, because once more I want to solicit your opinions. MLB and the MLBPA have been talking, and as you can read in this article from Jeff Passan, the two sides have exchanged several proposed changes to the game’s competitive and economic structure. Nothing has actually been agreed to yet, and most of the proposals will remain on paper, but for now, we all get to consider a bunch of ideas. You might find some of them agreeable. You might find some of them disagreeable. That’s why I want to collect information.

As far as I can tell, Passan highlighted ten different proposals. You’ll find them below. Some of them are more vague than others, but we can make do with what we have. For each proposal, I’ll offer a brief explanation. And then there are two polls. The first simply asks whether you approve or disapprove of the proposal, as you understand it. The second asks how much you actually care. Are you very passionate, or is it a struggle to so much as muster an opinion? I look forward to the results from running these in tandem. I’ll probably revisit the data later this week.

Off we go! Thanks in advance for your collective participation.

Read the rest of this entry »


Why Isn’t the 60-Day DL Year-Round?

It’s funny to say now, given the season they went on to have, but last spring the A’s were dealt a blow that jeopardized their sleeper-contender status. Not only did they lose hotshot prospect A.J. Puk to Tommy John surgery; they also lost big-league starter Jharel Cotton to Tommy John surgery. Puk wasn’t and isn’t on their 40-man roster, but Cotton was. Cotton had surgery on March 21. He was placed on the 60-day disabled list on March 19. He was activated from the 60-day disabled list on October 29. He’ll likely be placed back on the 60-day disabled list in a week or two. He’s looking ahead to something like a midseason return, should everything continue to go well in his rehab and recovery.

There’s nothing unusual about Cotton’s case. At the end of every season, players on the 60-day DL get activated. As a consequence, they occupy spots on 40-man rosters. And then around the start of every spring training, players get placed on the 60-day DL, as it’s again made available. Grant Dayton was the first player to hit the 60-day DL in 2018 — he was placed on Valentine’s Day. There were 31 players placed on the 60-day DL in February and March. Jacob Lindgren was the first player to hit the 60-day DL in 2017 — he was also placed on Valentine’s Day. There were 16 players placed on the 60-day DL in February and March.

This is all very normal and also kind of boring. But, why is this the way that it is? Why doesn’t the 60-day disabled list just cover the whole year?

Read the rest of this entry »


The Padres’ Most Promising Hitter

There was already plenty to like about what Matt Chapman did as a rookie in 2017. But his introduction to the majors looked all the more encouraging upon further and deeper review. It’s long forgotten now, but Chapman got off to a miserable start. Through the middle of July, he had a wRC+ of 64, to go with nearly 40% strikeouts. The defense was there — the defense was always going to be there — but it was fair to wonder whether Chapman’s bat had what it would take to succeed. It was early, yes, but Chapman had been exposed. He seemed to be overmatched.

And then, in a flash, he turned the tables. The rest of the way, he carried a wRC+ of 120, and he trimmed his strikeouts all the way to 26%. The way Chapman finished set him up for a breakout and breakthrough 2018, with a 137 wRC+ and a superstar WAR. The strikeout issues were nowhere to be found. Not that Chapman exactly qualifies as a traditional contact hitter, but he makes enough contact to tap consistently into his power. Chapman put the rough intro behind him, and he hasn’t looked back.

With Chapman in mind, allow me to shift the conversation toward Franmil Reyes. Unlike Chapman, Reyes is never going to win a Platinum Glove. If he’s going to have a career, it’ll have to be a career in which he hits. But the good news is that he just made a strong impression. Like Chapman the season before, Reyes just used the final two months to set himself up for a dazzling campaign.

Read the rest of this entry »


Astros Sign Poor Man’s Dallas Keuchel

A year ago, Wade Miley went to camp with the Brewers as a 31-year-old minor-league free agent. He was coming off a disastrous season that saw him finish with a 128 ERA- with the Orioles. In truth, Miley wasn’t quite that bad — he also finished with an xFIP- of 106. But even 106 is unspectacular, and going into the season, expectations were modest. It wasn’t even guaranteed Miley would ever find a spot.

He wound up making 16 starts in a Brewers uniform, plus four more (technically) in the playoffs. In one sense, the Brewers got what they might’ve expected. Once again, Miley finished with an xFIP- of 106. But then, his ERA- settled at a ridiculous 63. In other words, while his xFIP- stayed exactly the same, he cut his ERA- in half. Miley finished with a better park-adjusted ERA than Corey Kluber. He finished with a better park-adjusted ERA than Gerrit Cole. He finished with a better park-adjusted ERA than Clayton Kershaw. The best and worst thing about baseball is that it doesn’t always have to make sense. Through one lens, Miley pitched as the ace of his team.

And now he’s going to take his pitching to Houston. Miley has signed with the Astros for a year and $4.5 million, with another $0.5 million in incentives. The Astros are likely to lose Dallas Keuchel. In Miley, they’re hoping to find an approximation.

Read the rest of this entry »


Finding Homes for the Top Remaining Free Agents

Even before this week’s polar vortex hit the Midwest and the Northeast, the hot stove had failed to generate adequate heat. It’s the second winter in a row that this has happened, this time with a much stronger free agent class. With less than two weeks to go before pitchers and catchers report to spring training, more than 100 free agents remain unsigned. According to The Athletic’s Jayson Stark, 16 teams haven’t signed a free agent to a multi-year deal, and 23 haven’t done one longer than two years. This isn’t just a matter of teams waiting out a handful of players in order to get a slight or even steep discount to fill that last need; it’s yet another sign of an increasingly dysfunctional relationship between the union and the league. As if in concert, big-spending teams such as the Dodgers, Yankees, and Cubs are suddenly turned austere, as if the goal were to fly tidier balance sheets over their ballparks, instead of championship banners.

Even some of the winter’s best free agents have yet to find a home. It’s not just Manny Machado and Bryce Harper, who ranked first and second on our Top 50 Free Agents list, who remain unsigned. Even after the Astros inked Wade Miley to a one-year, $4.5 million deal on Thursday, a total of 10 players within the top 50 are still without a home — setting the three pitchers on that list aside, that’s almost enough to fill out a makeshift lineup if the versatile Marwin Gonzalez can play two positions at once. Here’s the list, with the previous and projected WAR totals and crowdsourced contract information taken from our big board:

Unsigned Free Agents From Among FanGraphs’ 2019 Top 50
Rk Name Pos Prev Team Age Prev WAR Proj WAR Med Years Med Total
1 Manny Machado SS Dodgers 26 6.2 5.0 8 $256.0M
2 Bryce Harper RF Nationals 26 3.5 4.9 10 $330.0M
4 Dallas Keuchel SP Astros 31 3.6 3.3 4 $79.0M
12 Craig Kimbrel RP Red Sox 31 1.5 2.1 4 $64.0M
15 Marwin Gonzalez UT Astros 30 1.6 1.8 3 $30.0M
22 Mike Moustakas 3B Brewers 30 2.4 2.8 3 $36.0M
33 Gio Gonzalez SP Brewers 33 2.0 0.8 2 $24.0M
41 Adam Jones CF Orioles 33 0.5 1.2 2 $20.0M
43 Martin Maldonado C Astros 32 0.9 1.0 2 $10.0M
47 Jose Iglesias SS Tigers 29 2.5 1.7 3 $27.0M
Average 30.3 2.4 2.3
SOURCE: https://blogs.fangraphs.com/2019-top-50-free-agents/
Med(ian) Years and Med(ian) Total contract values from our crowdsource balloting ( https://blogs.fangraphs.com/contract-crowdsourcing-2018-19-ballot-1-of-7/). List does not include Adrian Beltre or Joe Mauer (both retired).

This isn’t an especially aged group or one facing imminent declines. Aside from the top two players, none of them projects to wind up anywhere close to a nine-figure deal, and while some of this group may still be unsigned specifically because certain teams are waiting for the biggest dominoes to fall, that explanation only goes so far.

Read the rest of this entry »


The Diamondbacks Will Try to Create a Center Fielder

Last season, the Diamondbacks were one of the best defensive teams in either league. In the end, it wasn’t enough to get them to the playoffs, but it took a September collapse for them to fall out of first place. Arizona finished first by a large margin in Defensive Runs Saved. They weren’t quite so good by Ultimate Zone Rating, but that also doesn’t give them credit for their quality work behind the plate. Looking at Statcast’s difference between actual and expected wOBA allowed, the Diamondbacks finished behind only the A’s. It wasn’t a perfect season in the desert, but it wasn’t the defense that let them down.

Now we’re looking at a team in transition. There’s no easy way to lose Paul Goldschmidt. There’s no easy way to lose A.J. Pollock. There’s no easy way to lose Patrick Corbin. The expectations for the Diamondbacks aren’t going to be high, because of the talent they’ve already lost. Given that, they’ve turned into an easy team to overlook. But it’s interesting to see what’s been going on this offseason. After how good the defense just was, the Diamondbacks are moving forward without Jeff Mathis. They’re going to have Jake Lamb try to learn first base. Wilmer Flores is going to take over at second base. And Ketel Marte is moving to center field. For the second offseason in a row, a team is going to try to plug a hole in center with a second baseman.

Read the rest of this entry »


Greg Holland Takes a Pay Cut

The last 15 months have not gone particularly well for Greg Holland. Coming off a solid return from Tommy John surgery with the Rockies in 2017 — albeit one with a lesser second half than first — he bypassed a reported multiyear offer to return, then was met with a frosty reception amid a free agent market that was generally more hospitable to relievers than other players. He finally signed a one-year, $14 million deal with the Cardinals after Opening Day, but struggled to the point of being released on August 1. After salvaging his season at least somewhat with a strong showing with the Nationals over the final two months, he hit free agency again. On Monday, the 33-year-old righty reportedly agreed to a one-year, $3.5 million-plus-incentives deal with the Diamondbacks, pending a physical. It’s a living, but ouch.

Admittedly, it’s suboptimal to carry a season with a 4.99 ERA, 3.83 FIP, 0.3 WAR, and just three saves into a market flooded with alternatives coming off stronger showings, but one might have thought that the Scott Boras client could have built upon his late-season resurgence in Washington and the lack of a qualifying offer this time around. Then again, it was presumably Boras’ misread of Holland’s market last winter that got him into this jam in the first place. At least this time, he’s going to spring training.

By not signing until two days after Opening Day last year — and that only after Luke Gregerson was lost to a hamstring injury — Holland missed the entirety of exhibition season, and after making just a pair of tune-up appearances with the Cardinals’ Hi-A Palm Beach affiliate, he walked four out of the five batters he faced in his April 9 debut. He didn’t get his first save chance until April 27, but he blew that, and he never assumed the full-time closer role. He never found his control in St. Louis, and a three-week stint on the disabled list for impingement in his right hip, from late May to mid-June, didn’t help. All told, in 32 appearances totaling 25 innings with the Cardinals, his walk, strikeout, and earned run totals were identical: 22 (7.92 per nine) — not what you want. Six days after being released, he joined the Nationals, and at least righted the ship, posting a 0.84 ERA and 2.97 FIP while striking out 31.3% of hitters in 21.1 innings as the team played out the string.

The key, or at least one of them, was a more reliable slider that generated more chases and less zone contact when he backed off using it quite so heavily:


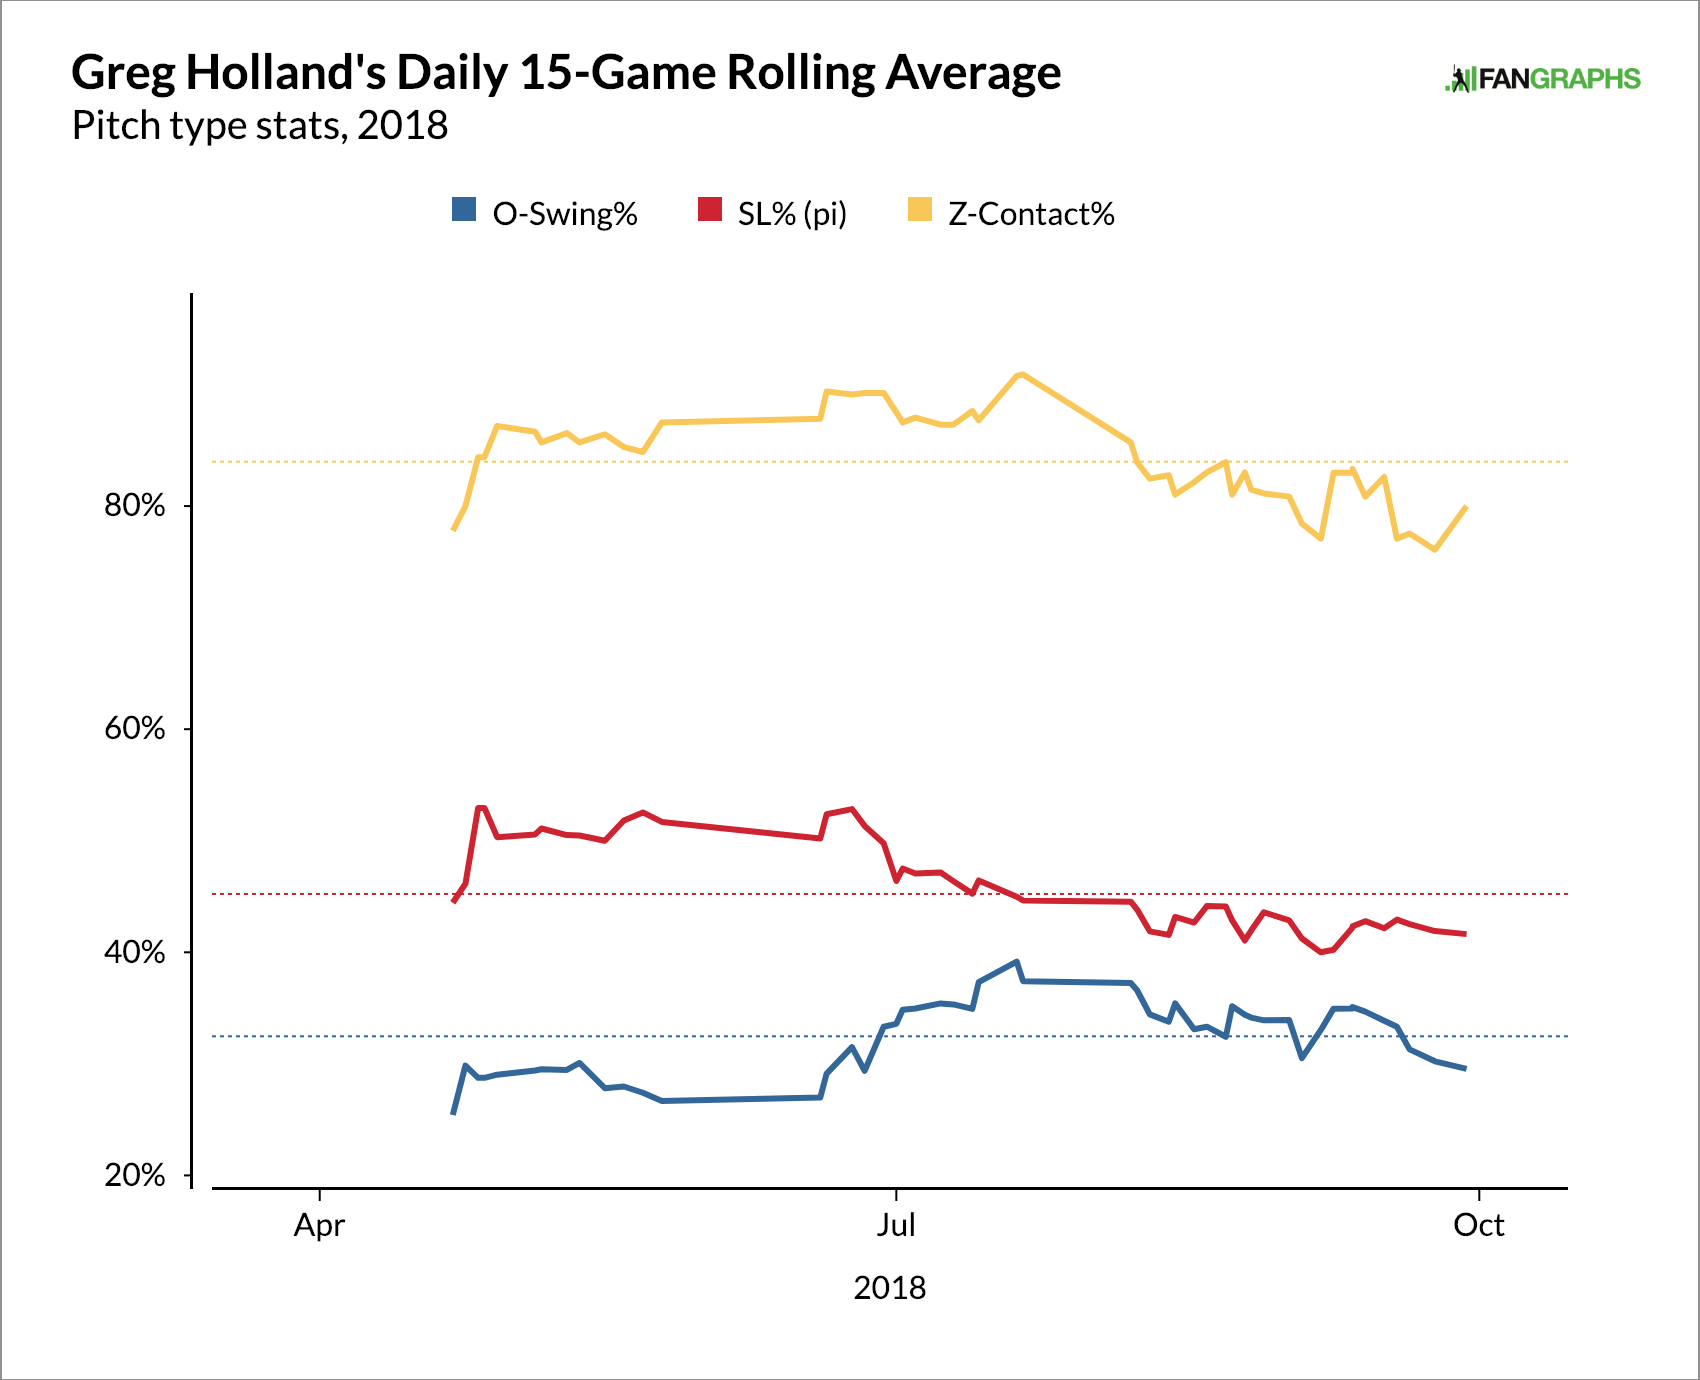
According to Brooks Baseball, while with St. Louis, Holland’s slider was hit for a .268 average and .357 slugging percentage, with a 19.8% whiff rate (37.3% whiffs per swing), while with Washington, the slider yielded an .081 batting average (all singles) with a 25.2% whiff rate (48.5% whiffs per swing). His fastball became less of a meatball with the transition as well (.342 AVG/.463 SLG before, .208/.375 after, with a whiff rate climbing from 4.2% to 10.7%); via Baseball Savant, his xwOBA dropped from .354 with the Cardinals to .239 with the Nationals. Granted, we’re dealing with small samples in terms of innings and pitches, with the latter ranging from 30 plate appearances ending with fastballs in Washington to 60 PA ending with sliders in St. Louis, but whatever changed did seem to work, allowing him to recover his first-half 2017 form — when he earned All-Star honors with the Rockies — if not his magic with the Royals. Life is just different when your fastball averages 92.9 mph instead of 96.9 (his average in 2013, according to Pitch Info).

On that note, it’s worth a brief historical review. Once upon a time, Holland ranked among the game’s elite relievers. From 2011 — his first full season in the majors — to 2014, he posted ERAs below 2.00 three times out of four, with FIPS below 2.00 twice. Over that span, only three pitchers (Craig Kimbrel, Eric O’Flaherty, and Wade Davis) outdid his 1.86 ERA, and only Kimbrel surpassed his 1.92 FIP and 9.1 WAR. In August 2012, he assumed the closer duties for the Royals, and over the next two seasons became a key part of their march to respectability, aided by a dominant bullpen. He made the All-Star team in both 2013 and ’14, ranking second in the AL in saves each year. In 2013, he led all relievers in FIP (1.36) while ranking second in WAR (3.0), while in 2014, after placing within the top handful in ERA, FIP, and WAR, he went 7-for-7 in saves while yielding just one run and four hits in 11 innings while striking out 15 during the Royals’ postseason run.

Holland did not get to pitch during the Royals’ 2015 championship run. His velocity dipped from its typical 95-96 mph average into the low 90s in late August, and he was soon discovered to have suffered a partial tear in his ulnar collateral ligament. He tried to pitch through it — reportedly, he had been experiencing elbow discomfort as far back as August 2014 — but went to the sidelines in mid-September, yielding the closer’s job to Davis, and on October 2 went under the knife. He didn’t re-emerge until signing a one-year, $7 million contract with the Rockies in January 2017, a deal that included a mutual option, more on which momentarily.

Holland burst out of the gate in 2017, converting 23 straight save chances with a 1.09 ERA through June 14. He made the NL All-Star team on the strength of a 1.62 ERA and 2.80 FIP; a dreadful 9.1-inning, 14-run stretch in August blew up his second-half stats (6.38 ERA, 4.99 FIP), but he helped the Rockies snag an NL Wild Card berth, and finished with a league-high 41 saves along with a 3.61 ERA and 3.72 FIP (72 ERA- and 81 FIP-).

When Holland signed with the Rockies, he had a $10 million mutual option for 2018, with a $1 million buyout. By reaching either 50 games pitched or 30 games finished, that option converted into a $15 million player option, about on par with his total take in 2017 ($15.1 million) thanks to his having earned $9.1 million in incentive bonuses thanks to his 61 appearances, 58 games finished, and 2017 NL Comeback Player of the Year award. Holland declined the option and the $17.4 million qualifying offer that followed. Later he reportedly snubbed a three-year, $51 or $52 million deal from the Rockies, though whether that was a firm offer or a “conceptual” one (as Buster Olney phrased it) is up for debate. The Rockies instead signed Davis to a three-year, $52 million deal in late December — thanks, old pal — and a better offer apparently never came Holland’s way.

Hence, the mess in which Holland wound up, though he was hardly alone in misreading the market. The exact details of his new contract are unknown at this writing, but he can earn a maximum of $3.5 million in incentives, some of which probably depend upon his returning to closer duty. With Brad Boxberger departed in free agency (unsigned at this writing, actually), it’s not clear yet whether he or Archie Bradley, who excelled in a setup role, will be manager Torey Lovullo’s top ninth-inning choice. If Holland can stay healthy and maintain his old form, he stands to be quite a bargain for the Snakes regardless of his role, but one can’t help imagining that if he could play out the last year-and-change again, he’d be in a much better position than he is today.


2019 ZiPS Projections – Los Angeles Dodgers

After having typically appeared in the hallowed pages of Baseball Think Factory, Dan Szymborski’s ZiPS projections have now been released at FanGraphs for more than half a decade. The exercise continues this offseason. Below are the projections for the Los Angeles Dodgers.

Batters

Overall, the Dodgers still project as being among the best teams in baseball, but something feels curiously unsatisfying about the team’s offseason. The team appears to be shuffling the outfield again, but is the Cody Bellinger/A.J. Pollock/Guy in CF While A.J. Pollock is Injured/Maybe Alex Verdugo configuration really any better than the Bellinger/Joc Pederson/Yasiel Puig option — while still having Alex Wood and Kyle Farmer but not the Reds prospects — would have been? Maybe it is, maybe it isn’t. Pollock is a better player than Pederson, but riskier given his health history, and ZiPS has always been slightly underwhelmed by Verdugo. Given the team’s positional flexibility and their theoretical pocketbook, this depth chart could still change considerably over the next month; despite the tea leaves suggesting they’re out on Bryce Harper, I remain less than 100% convinced.

One wonders how much of Los Angeles’ apparent lack of interest in a big name isn’t a matter of feeling miserly, but is simply a reflection of the state of the NL West, which looks a lot less dangerous for the reigning champs than last year. Barring big changes, Arizona’s in a mostly-rebuilding phase, the Giants probably saw their last real opportunity to compete with their current core end last summer, and only part of San Diego’s prospect crop will be reaped this year, though a move for Manny Machado or J.T. Realmuto could accelerate the Padres’ timeline. That just leaves the Rockies, who while improved with Daniel Murphy at first, are unlikely to get quite as much awesomeness from their best players as they received in 2018. Colorado’s the biggest threat to the Dodgers in the division, but they’re also a passive team apparently content with their holes.

ZiPS is sold on Max Muncy, in large part due to his velocity data, the magnitude of his 2018 breakout, and the fact that his translated 2017 performance of .264/.351/.420 was more-than-adequate. That’s enough to effectively counteract his disappointing prior major league performance and meh-minus minor league translations of .218/.317/.346 and .219/.282/.359. In the end, ZiPS sees a lot more downside risk in Muncy’s batting average than his power, power being a difficult trick to fake.

Pitchers
Clayton Kershaw’s projection has to be the best OMG THAT’S HORRIBLE projection that ZiPS has ever spat out. The fact is, he’s missed time due to injury in four of the last five seasons and while no individual injury has been of the severe variety — the sort where ligaments are replaced or shoulders reconstructed — there’s evidence that he’s just not at the same level as he was from 2013-2016. ZiPS is still projecting him to be a star, but you can’t ignore his continued velocity decline and the loss of 20% of his strikeouts. That was enough to drop his yearly top comp from Sandy Koufax to “only” Tom Glavine. A brief aside: Kershaw was actually slightly easier to make contact against in 2018 than the average pitcher, which is really weird.

The bottom-line WAR projections aren’t generally in the stratosphere for the Dodgers, but that’s in large part due to the fact that the pitching staff has a checkered health record and ZiPS is only projecting Kershaw to qualify for the rate stat leaderboard. What the Dodgers don’t have in health they’ve been forced to make up for in depth, and of the pitchers on the 40-man roster, ZiPS projects a shocking 15 to have a league-average ERA or better (when adjusting for park, of course). Just on the major league roster, ZiPS sees both Caleb Ferguson and Ross Stripling as perfectly adequate fallback options if (when?) the rotation starts making DL trips.

I believe that Kenley Jansen is the first player to get a top comp of a prime Mariano Rivera (a few have gotten him as a minor-league starter). Seems kinda poetic given Jansen’s cutter, which ZiPS doesn’t actually know about, though he’s unlikely to retire as the best reliever in major league history. From a comp standpoint, a team shouldn’t be able to complain too much when a quarter of their pitching staff has Hall of Famers — easy ones rather than guys that just happened to be Frankie Frisch’s teammates — as their top comparisons.

Bench and Prospects

ZiPS doesn’t see the Dodger farm system as being as strong as it did in the last few years, but there’s still a lot of future major league value here. ZiPS isn’t on the Alex Verdugo star bandwagon, but at least sees him as an above-average starter in his prime, and the projections for Keibert Ruiz are of a similar level of quality. ZiPS thinks that both Dustin May and Dennis Santana wouldn’t embarrass themselves if dragooned into duty on the major league roster, and even Yadier Alvarez, a pitching prospect who a set of algorithms ought to have issues properly appreciating, gets a projection in the same zip code as league-average. ZiPS thinks that both Will Smith and Gavin Lux will be league-average regulars, but sees a significant quality dropoff after that pair. That’s not including Jeter Downs, who will get a projection for ZiPS Top 100 list, but I avoid giving official seasonal projections for players who’ve only played in the Midwest League outside of rookie ball unless I’m forced to by circumstance.

One pedantic note for 2019: for the WAR graphic, I’m using FanGraphs’ depth chart playing time, not the playing time ZiPS spits out, so there will be occasional differences in WAR totals.

Ballpark graphic courtesy Eephus League. Depth charts constructed by way of those listed here at site.

Batters – Counting Stats
Player B Age PO G AB R H 2B 3B HR RBI BB SO SB CS
Manny Machado R 26 SS 156 618 88 174 36 2 34 112 60 110 11 3
Cody Bellinger L 23 1B 156 545 92 147 29 6 34 101 73 149 14 2
Corey Seager L 25 SS 129 499 72 140 32 3 17 77 47 111 4 1
Justin Turner R 34 3B 118 409 60 119 27 1 15 63 46 64 4 1
A.J. Pollock R 31 CF 114 425 65 112 24 4 16 57 32 90 16 4
Chris Taylor R 28 SS 148 523 76 130 30 7 15 63 50 154 13 7
Joc Pederson R 27 CF 136 386 62 92 24 2 22 62 56 108 3 5
Max Muncy L 28 1B 131 385 63 94 18 2 23 66 64 124 3 1
Keibert Ruiz B 20 C 107 407 47 107 19 1 10 45 22 57 0 1
Alex Verdugo L 23 CF 138 474 59 130 25 2 11 50 40 67 8 3
Kiké Hernandez R 27 CF 145 361 55 89 19 2 16 48 44 87 3 0
Russell Martin R 36 C 94 314 44 67 11 0 12 40 48 92 1 3
Austin Barnes R 29 C 102 262 38 63 13 1 5 30 37 65 7 2
Will D. Smith R 24 C 88 327 39 64 14 1 12 39 31 122 4 1
David Freese R 36 3B 111 335 39 82 14 1 10 50 31 97 0 0
Gavin Lux L 21 SS 120 493 61 117 20 7 13 53 44 125 11 10
DJ Peters R 23 CF 133 517 65 103 21 4 23 66 40 235 1 3
Matt Beaty L 26 1B 101 388 45 101 21 1 7 44 25 68 2 2
Chase Utley L 40 2B 94 203 24 46 12 2 3 20 19 41 4 1
Andrew Toles R 27 LF 95 327 40 82 18 2 7 39 15 76 7 5
Jake Peter L 26 2B 117 426 46 96 16 2 8 41 30 126 6 4
Rob Segedin R 30 1B 85 282 37 68 13 2 9 41 21 69 1 1
Rocky Gale R 31 C 98 324 29 72 13 2 3 29 15 65 1 1
Angelo Mora B 26 2B 105 370 36 87 16 4 6 40 20 94 4 3
Edwin Rios L 25 3B 109 406 47 95 22 1 13 54 22 144 1 2
Travis Taijeron R 30 RF 116 397 50 84 21 2 16 55 41 165 1 2
Connor Wong R 23 C 100 383 46 80 15 1 15 46 27 158 5 3
Paulo Orlando R 33 RF 106 369 39 87 17 2 7 36 13 86 4 1
Josh Thole L 32 C 34 98 8 19 3 0 1 6 9 23 1 0
Shane Peterson L 31 LF 120 390 42 91 21 3 9 49 23 114 3 0
Zach McKinstry L 24 2B 94 325 35 67 12 3 4 27 32 103 3 3
Jeren Kendall L 23 CF 110 438 42 84 13 5 10 36 35 181 22 17
Cameron Perkins R 28 1B 108 389 44 93 23 2 9 48 21 77 6 3
Tyler Goeddel R 26 LF 99 322 35 70 11 3 5 30 27 89 7 3
Cristian Santana R 22 3B 128 536 56 123 19 1 18 68 15 163 1 2
Zach Reks L 25 LF 84 297 31 69 10 2 4 24 24 99 5 4
Errol Robinson R 24 SS 107 417 44 91 15 2 7 36 29 127 14 6
Kyle Garlick R 27 RF 110 407 47 85 20 2 17 54 21 160 2 0
Omar Estevez R 21 SS 133 538 57 111 26 2 11 53 33 171 2 2
Michael Ahmed R 27 3B 86 298 32 57 10 2 7 27 28 122 4 4
Logan Landon R 26 LF 108 381 41 80 15 1 10 38 25 131 14 4

Batters – Rate Stats
Player BA OBP SLG OPS+ ISO BABIP RC/27 Def WAR No. 1 Comp
Manny Machado .282 .344 .511 128 .230 .295 6.7 -4 5.3 Adrian Beltre
Cody Bellinger .270 .357 .532 137 .262 .312 7.2 4 4.8 Johnny Callison
Corey Seager .281 .346 .459 116 .178 .332 6.0 3 4.0 Troy Tulowitzki
Justin Turner .291 .376 .472 128 .181 .315 6.8 3 4.0 George Kell
A.J. Pollock .264 .320 .452 106 .188 .301 5.5 3 2.7 Jackie Brandt
Chris Taylor .249 .320 .419 98 .170 .325 4.8 -2 2.4 Robby Thompson
Joc Pederson .238 .342 .482 120 .244 .273 5.7 -5 2.3 Jon Nunnally
Max Muncy .244 .355 .481 124 .236 .298 6.1 -3 2.1 Johnny Briggs
Keibert Ruiz .263 .308 .388 88 .125 .285 4.3 3 1.8 Mike Lieberthal
Alex Verdugo .274 .332 .405 99 .131 .301 5.1 -4 1.7 Nick Markakis
Kiké Hernandez .247 .328 .443 107 .197 .283 5.3 -3 1.7 Scott Hairston
Russell Martin .213 .329 .363 88 .150 .262 3.9 1 1.5 Rick Dempsey
Austin Barnes .240 .344 .355 91 .115 .302 4.5 1 1.4 Al Lopez
Will D. Smith .196 .277 .355 70 .159 .269 3.4 7 1.3 Rick Wilkins
David Freese .245 .324 .382 91 .137 .316 4.4 1 1.2 Tony Graffanino
Gavin Lux .237 .301 .385 85 .148 .293 3.9 -3 1.1 D’Angelo Jimenez
DJ Peters .199 .272 .389 77 .190 .309 3.5 -2 0.4 Brent Clevlen
Matt Beaty .260 .310 .374 84 .113 .300 4.2 3 0.3 Tommy Gregg
Chase Utley .227 .310 .350 79 .123 .270 3.9 -1 0.3 Craig Counsell
Andrew Toles .251 .288 .382 80 .131 .307 3.9 4 0.3 Rod Allen
Jake Peter .225 .281 .329 65 .103 .301 3.2 5 0.3 Mendy Lopez
Rob Segedin .241 .298 .397 86 .156 .289 4.2 1 0.2 Marlin McPhail
Rocky Gale .222 .261 .302 52 .080 .270 2.7 6 0.1 Izzy Molina
Angelo Mora .235 .275 .349 68 .114 .300 3.3 1 0.0 Juan Melo
Edwin Rios .234 .278 .389 78 .155 .329 3.7 -4 -0.1 Roy Howell
Travis Taijeron .212 .295 .395 85 .184 .315 3.9 -5 -0.2 Dustan Mohr
Connor Wong .209 .271 .371 72 .162 .310 3.4 -9 -0.3 Bob Geren
Paulo Orlando .236 .268 .350 66 .114 .290 3.4 4 -0.3 Dave Augustine
Josh Thole .194 .266 .255 43 .061 .243 2.4 -2 -0.4 Charlie Greene
Shane Peterson .233 .280 .372 75 .138 .307 3.7 -2 -0.4 Jalal Leach
Zach McKinstry .206 .288 .298 60 .092 .289 2.8 -1 -0.4 Abel Nieves
Jeren Kendall .192 .253 .313 52 .121 .300 2.4 8 -0.4 Jimmy White
Cameron Perkins .239 .285 .378 78 .139 .277 3.8 -2 -0.5 Virgil Chevalier
Tyler Goeddel .217 .287 .317 64 .099 .285 3.2 0 -0.6 Casey Craig
Cristian Santana .229 .252 .369 66 .140 .296 3.2 -3 -0.7 Matthew Moses
Zach Reks .232 .291 .320 66 .088 .335 3.2 -1 -0.7 Angelo Cuevas
Errol Robinson .218 .271 .314 58 .096 .297 3.0 -5 -0.7 Brian Bixler
Kyle Garlick .209 .253 .393 72 .184 .296 3.5 -3 -0.8 Brian McFall
Omar Estevez .206 .255 .323 56 .117 .281 2.8 -2 -0.9 Ricky Magdaleno
Michael Ahmed .191 .266 .309 55 .117 .296 2.6 -3 -1.0 Frank Kremblas
Logan Landon .210 .261 .333 60 .123 .292 3.1 -3 -1.2 Juan Piniella

Pitchers – Counting Stats
Player T Age W L ERA G GS IP H ER HR BB SO
Clayton Kershaw L 31 11 6 2.91 26 26 164.0 138 53 18 27 170
Walker Buehler R 24 9 6 3.31 28 27 141.3 118 52 16 46 163
Kenta Maeda R 31 12 8 3.63 36 24 143.7 131 58 17 43 149
Rich Hill L 39 9 7 3.81 22 22 115.7 98 49 17 40 128
Caleb Ferguson L 22 8 6 3.53 39 9 109.7 99 43 10 48 115
Ross Stripling R 29 7 6 3.92 32 17 105.7 105 46 16 25 103
Kenley Jansen R 31 3 2 2.95 64 0 64.0 50 21 9 15 81
Hyun-jin Ryu L 32 6 5 3.89 17 17 88.0 89 38 14 21 82
Dustin May R 21 7 7 4.45 24 24 131.3 142 65 19 35 96
Scott Alexander L 29 3 2 3.61 67 0 67.3 63 27 5 26 57
Ryan Madson R 38 4 3 3.28 52 0 49.3 44 18 5 13 50
Joe Kelly R 31 3 2 3.56 65 0 60.7 51 24 4 29 64
Dennis Santana R 23 5 5 4.24 18 16 87.0 83 41 11 35 87
Yadier Alvarez R 23 3 3 4.43 21 14 67.0 62 33 6 45 65
Daniel Corcino R 28 4 4 4.55 29 16 95.0 94 48 13 43 87
Pedro Baez R 31 4 3 3.72 59 0 58.0 51 24 7 22 62
Josh Sborz R 25 4 3 3.72 55 0 58.0 51 24 5 27 61
Joe Broussard R 28 5 4 3.84 53 0 65.7 63 28 8 22 63
Zach McAllister R 31 3 2 3.79 49 0 54.7 53 23 7 16 54
Josh Fields R 33 2 2 3.75 53 0 48.0 45 20 6 14 47
Mitchell White R 24 6 6 4.68 22 22 98.0 102 51 13 43 78
Brock Stewart R 27 4 4 4.70 26 20 103.3 108 54 17 35 87
Tony Cingrani L 29 2 1 3.66 45 0 39.3 32 16 5 17 50
JT Chargois R 28 3 3 3.97 50 0 45.3 41 20 4 24 45
Tony Gonsolin R 25 6 6 4.87 26 26 118.3 123 64 20 53 103
John Axford R 36 3 2 3.94 46 0 48.0 44 21 4 23 47
Dylan Floro R 28 4 4 4.28 52 0 67.3 72 32 9 18 48
Julio Urias L 22 1 1 4.25 12 9 36.0 33 17 5 16 38
Shea Spitzbarth R 24 4 4 4.24 43 0 68.0 63 32 10 31 74
Kevin Quackenbush R 30 3 3 4.18 55 0 56.0 54 26 8 20 53
Daniel Hudson R 32 3 3 4.18 53 0 51.7 48 24 6 24 52
Logan Bawcom R 30 6 7 5.08 25 14 85.0 91 48 13 38 62
Logan Salow L 24 4 4 4.32 39 0 50.0 48 24 6 26 49
Nolan Long R 25 4 4 4.41 46 0 63.3 58 31 8 39 69
C.C. Lee R 32 2 2 4.31 27 0 31.3 29 15 5 12 34
Adam McCreery L 26 3 3 4.58 41 0 55.0 48 28 4 45 59
Logan Ondrusek R 34 2 2 4.42 38 0 38.7 38 19 6 15 36
Yimi Garcia R 28 2 2 4.43 42 0 40.7 43 20 8 7 37
Adam Liberatore L 32 3 3 4.54 38 0 33.7 33 17 5 14 30
Zach Neal R 30 5 6 5.28 29 15 105.7 123 62 21 16 56
Erik Goeddel R 30 2 2 4.69 46 0 48.0 45 25 8 23 52
Marshall Kasowski R 24 2 2 4.71 42 0 49.7 37 26 5 50 72
Ben Holmes L 27 3 4 5.22 25 10 70.7 76 41 11 35 54
Jaime Schultz R 28 4 5 5.36 41 11 80.7 74 48 16 53 97
Tyler Pill R 29 5 7 5.36 22 17 99.0 114 59 18 32 61
Parker Curry R 25 6 8 5.26 38 10 87.3 95 51 16 40 75
Andre Scrubb R 24 4 5 5.05 38 0 57.0 55 32 6 46 52
Dylan Baker R 27 3 5 5.67 30 1 33.3 38 21 6 17 20
Justin de Fratus R 31 5 8 5.70 24 18 109.0 131 69 23 30 63

Pitchers – Rate Stats
Player TBF K/9 BB/9 HR/9 BABIP ERA+ ERA- FIP WAR No. 1 Comp
Clayton Kershaw 648 9.33 1.48 0.99 .278 139 72 3.03 4.1 Tom Glavine
Walker Buehler 586 10.38 2.93 1.02 .288 122 82 3.44 2.9 John Smoltz
Kenta Maeda 601 9.33 2.69 1.06 .295 115 87 3.64 2.8 Mark Gubicza
Rich Hill 486 9.96 3.11 1.32 .276 109 92 4.09 2.0 Al Leiter
Caleb Ferguson 475 9.44 3.94 0.82 .301 114 88 3.72 1.8 Terry Forster
Ross Stripling 442 8.77 2.13 1.36 .301 103 97 3.94 1.4 Gil Heredia
Kenley Jansen 255 11.39 2.11 1.27 .277 137 73 3.24 1.4 Mariano Rivera
Hyun-jin Ryu 370 8.39 2.15 1.43 .299 104 96 4.14 1.2 Zane Smith
Dustin May 569 6.58 2.40 1.30 .299 91 110 4.55 1.1 Rick Wise
Scott Alexander 288 7.62 3.48 0.67 .293 115 87 3.67 1.0 Harry Perkowski
Ryan Madson 205 9.12 2.37 0.91 .291 127 79 3.41 0.9 Todd Jones
Joe Kelly 261 9.49 4.30 0.59 .292 117 86 3.48 0.9 Jim Hughes
Dennis Santana 378 9.00 3.62 1.14 .300 95 105 4.17 0.9 Denny Bautista
Yadier Alvarez 307 8.73 6.04 0.81 .299 94 106 4.57 0.6 J.R. Richard
Daniel Corcino 420 8.24 4.07 1.23 .298 89 113 4.61 0.6 Johnny Klippstein
Pedro Baez 244 9.62 3.41 1.09 .289 108 92 3.77 0.6 Mike DeJean
Josh Sborz 251 9.47 4.19 0.78 .297 108 92 3.72 0.6 Clay Bryant
Joe Broussard 280 8.63 3.02 1.10 .299 105 95 3.96 0.6 Joe Grahe
Zach McAllister 231 8.89 2.63 1.15 .303 110 91 3.83 0.6 Danny Patterson
Josh Fields 201 8.81 2.63 1.13 .293 111 90 3.75 0.5 Terry Leach
Mitchell White 437 7.16 3.95 1.19 .299 86 116 4.75 0.5 Ed Wojna
Brock Stewart 450 7.58 3.05 1.48 .297 86 117 4.77 0.5 Mickey Callaway
Tony Cingrani 167 11.44 3.89 1.14 .290 110 91 3.71 0.4 Yorkis Perez
JT Chargois 201 8.93 4.76 0.79 .296 105 95 4.10 0.4 George Smith
Tony Gonsolin 529 7.83 4.03 1.52 .298 83 121 5.13 0.4 Tom Griffin
John Axford 210 8.81 4.31 0.75 .299 102 98 3.84 0.4 Turk Lown
Dylan Floro 289 6.42 2.41 1.20 .297 97 103 4.35 0.4 Tom Morgan
Julio Urias 156 9.50 4.00 1.25 .292 95 105 4.26 0.3 Trevor Wilson
Shea Spitzbarth 298 9.79 4.10 1.32 .296 95 105 4.43 0.3 Anthony Chavez
Kevin Quackenbush 239 8.52 3.21 1.29 .293 97 104 4.24 0.3 Jose Silva
Daniel Hudson 226 9.06 4.18 1.05 .298 96 104 4.21 0.3 Marc Wilkins
Logan Bawcom 381 6.56 4.02 1.38 .295 82 122 5.16 0.2 Blue Moon Odom
Logan Salow 224 8.82 4.68 1.08 .300 93 107 4.49 0.2 Mike Murphy
Nolan Long 287 9.81 5.54 1.14 .299 92 109 4.65 0.1 Anthony Chavez
C.C. Lee 135 9.77 3.45 1.44 .293 94 107 4.39 0.1 Jason Childers
Adam McCreery 257 9.65 7.36 0.65 .301 91 110 4.57 0.1 Clay Bryant
Logan Ondrusek 167 8.38 3.49 1.40 .294 91 110 4.55 0.1 Ricky Barlow
Yimi Garcia 171 8.19 1.55 1.77 .299 91 110 4.55 0.1 Jeff Tam
Adam Liberatore 148 8.02 3.74 1.34 .289 89 113 4.72 0.0 Mike Venafro
Zach Neal 452 4.77 1.36 1.79 .288 79 127 5.27 0.0 Tim McClaskey
Erik Goeddel 211 9.75 4.31 1.50 .294 86 116 4.71 0.0 Mike Cook
Marshall Kasowski 236 13.05 9.06 0.91 .302 86 117 4.76 -0.1 Rafael Pimentel
Ben Holmes 322 6.88 4.46 1.40 .298 77 129 5.30 -0.1 Wade Blasingame
Jaime Schultz 369 10.82 5.91 1.79 .293 78 129 5.48 -0.2 Leslie Brea
Tyler Pill 441 5.55 2.91 1.64 .296 75 133 5.43 -0.3 Don August
Parker Curry 396 7.73 4.12 1.65 .304 77 130 5.36 -0.3 David Potts
Andre Scrubb 271 8.21 7.26 0.95 .299 80 125 5.27 -0.3 Lloyd Allen
Dylan Baker 154 5.40 4.59 1.62 .294 73 136 6.00 -0.3 Tom Dukes
Justin de Fratus 486 5.20 2.48 1.90 .298 71 141 5.76 -0.7 Allen Davis

Disclaimer: ZiPS projections are computer-based projections of performance. Performances have not been allocated to predicted playing time in the majors — many of the players listed above are unlikely to play in the majors at all in 2019. ZiPS is projecting equivalent production — a .240 ZiPS projection may end up being .280 in AAA or .300 in AA, for example. Whether or not a player will play is one of many non-statistical factors one has to take into account when predicting the future.

Players are listed with their most recent teams, unless I have made a mistake. This is very possible, as a lot of minor-league signings go generally unreported in the offseason.

ZiPS’ projections are based on the American League having a 4.29 ERA and the National League having a 4.15 ERA.

Players who are expected to be out due to injury are still projected. More information is always better than less information, and a computer isn’t the tool that should project the injury status of, for example, a pitcher who has had Tommy John surgery.

Both hitters and pitchers are ranked by projected zWAR — which is to say, WAR values as calculated by me, Dan Szymborski, whose surname is spelled with a z. WAR values might differ slightly from those which appear in full release of ZiPS. Finally, I will advise anyone against — and might karate chop anyone guilty of — merely adding up WAR totals on a depth chart to produce projected team WAR.