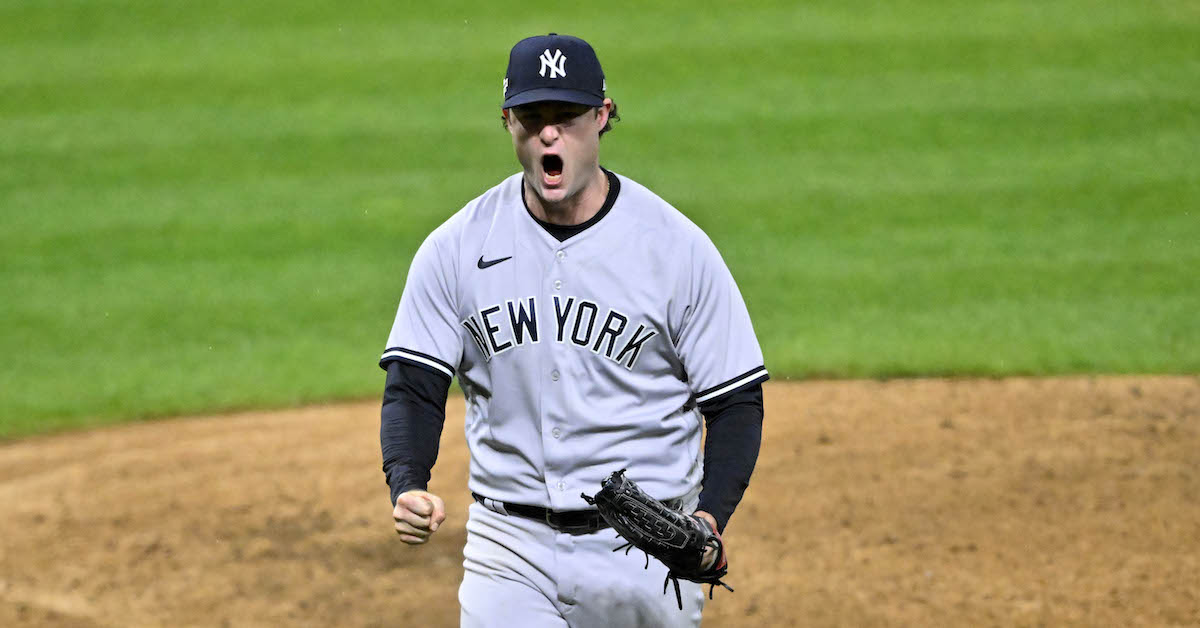
Yesterday, on the brink of an upset, Gerrit Cole put the Yankees and their shaky bullpen on his back. The righty went seven strong, sparing the Yankees the Dodgers’ and Braves’ fate for at least another day. Despite showing slightly diminished fastball velocity (he was down 0.8 mph for the second start in a row) and despite a recent reliance on offspeed pitches, Cole’s heater was crucial to his success. While his one major blemish, a solo shot off the bat of Josh Naylor, came on the pitch, its plate discipline statistics were on par with those of his breaking balls:
Gerrit Cole Plate Discipline By Pitch
Pitch
SwStr%
CStr%
Z-Swing%
O-Swing%
FF
14.0
16.0
71.0
50.0
KC
14.3
14.3
56.0
37.0
SL
15.4
15.4
67.0
50.0
For his part, Cal Quantrill kept the Guardians in the game after giving up three runs through the first two frames. He settled down, at one point retiring nine straight Yankees. But the Guardians could only muster two runs on six hits, failing to bail Quantrill out against Cole for the second time this week. Read the rest of this entry »
It had been leading up to this all day. After the Phillies routed the heavily favored Braves, after the Astros clinched their ALCS ticket with a go-ahead home run by Jeremy Peña in the 18th inning, and after Oscar Gonzalez walked up to the SpongeBob SquarePants theme and walked off the Yankees, of course it was the Padres who authored the closing spectacle. Down 3–0 in the seventh of Game 4, they rallied for five runs and are headed to the NLCS, their first in 24 years.
The Dodgers, meanwhile, have been saddled with one of their most humiliating losses in recent memory. A juggernaut in the regular season, none of their 111-win momentum carried over into this elimination game, or the entire series for that matter. For those who enjoy it, Los Angeles’ rapid implosion is a refreshing splash of schadenfreude; the 116-win 2001 Mariners at least made it past the Division Series, but the 2022 Dodgers will live in infamy for having won one measly playoff game.
Their collapse is made all the more heartbreaking by the auspicious start that preceded it. Watching the Dodgers had been an excruciating experience this series, punctuated by brief moments of hope to be deflated soon after. They were 0-for-their-last-20 with runners in scoring position, if that makes sense. But finally, Los Angeles broke through in the third inning. Mookie Betts drew a lead-off walk, Trea Turner doubled, and so did Freddie Freeman to drive in two runs:
For the first time in what felt like an interminable while, the top of the Dodgers’ order resembled the well-oiled, run-producing machine that flattened its opponents. Before it could kick into overdrive, however, Joe Musgrove settled down, getting the two additional outs needed to shut the door.
Speaking of Musgrove, he featured his four-seam fastball 44% of the time, which, considering his regular-season rate of 24%, was uncharacteristic. But it also made perfect sense. The one misconception about the Dodgers, likely popularized by this graphic, is that they are a superb fastball-hitting team. Rather, they are a superb fastball-taking team; their chase-averse tendencies are responsible for a collectively high run value. When attempting to make contact, though, the Dodgers have been objectively terrible. The optimal strategy against them, then, is to throw fastballs for strikes. That’s basically what Musgrove did, even though he sometimes strayed too far to his glove side:
As a result, Musgrove largely cruised through the game. The only other moment of danger he encountered came in the sixth, when fatigue seemed to set in, resulting in a walk followed by a single. But as the internet loves to proclaim, Musgrove got that dog in him. He struck out Chris Taylor looking for the second out, then Gavin Lux swinging on a perfectly-located high fastball for the third. Read the rest of this entry »
Two years before being hired to manage the Tampa Bay Devil Rays, Joe Maddon interviewed for the job in Boston. The winter-of-2003 vetting by the then Red Sox decision-makers — a subject I broached with Maddon in a 2007 interview — didn’t bear fruit… but what if it had? Earlier this week, I asked the proud son of Hazleton, Pennsylvania what might have happened had he started his big-league managerial career in Boston.
“I don’t think it would have turned out as well,” responded Maddon, who spent nine years in Tampa before going on to manage the Chicago Cubs and the Los Angeles Angels. “I wasn’t ready for that; I wasn’t ready for that market. Theo [Epstein] and Jed [Hoyer] made a great decision. Tito was the right guy.”
History bears that out. Four years removed from managing the Philadelphia Phillies for the same number of seasons, Terry Francona led the Red Sox to their first World Series title since 1918. While Maddon went on to win a World Series of his own, with the Cubs in 2016 — the team’s first since 1908 — hiring a first-year manager as Grady Little’s replacement wouldn’t have been in Boston’s best interests. Nor in Maddon’s.
“I needed more time to really develop what I wanted to do, and how I wanted to do it,” explained Maddon, whose managerial resume includes nine 90-plus-win seasons. “I really did need more of an expansion team than a tradition-based team at that point. I could experiment. I could try different things that weren’t very popular, or that nobody had thought about. I needed that wider berth, and the support that I got from Andrew [Friedman] at that particular time. So, thank God for unanswered prayers. I wanted the Red Sox job, but it was so much better for me to start out with the Devil Rays.” Read the rest of this entry »
Sometimes, you eat the bear. Sometimes, the bear eats you.
And at still other times, you eat it against the left center field wall. For the second day in a row Michael Harris II, who despite his youth is already one of the best defensive outfielders in the game, came off worse in a confrontation with a fence. On Friday night, the W.B. Mason sign knocked the ball out of his mitt, turning what would’ve been a spectacular catch into an RBI double for Bryce Harper. And not 24 hours later, Harris, the ball, and a neighboring State Farm ad came together to produce an inside-the-park home run for J.T. Realmuto.
With an 8–3 win in front of a bloodthirsty home crowd, the Phillies completed an upset victory over the rival Braves and are on their way to the NLCS. The inside-the-park home run wasn’t the play that made the game; in fact, by win probability, it was only the fourth-most impactful dinger of the afternoon. But if you watch enough baseball, you’ll learn to recognize signs that this just isn’t your day. For the Braves, surrendering the first inside-the-park homer by a catcher in postseason history, minutes after their starter got knocked out of the game by a line drive… signs don’t come much clearer than that. Read the rest of this entry »
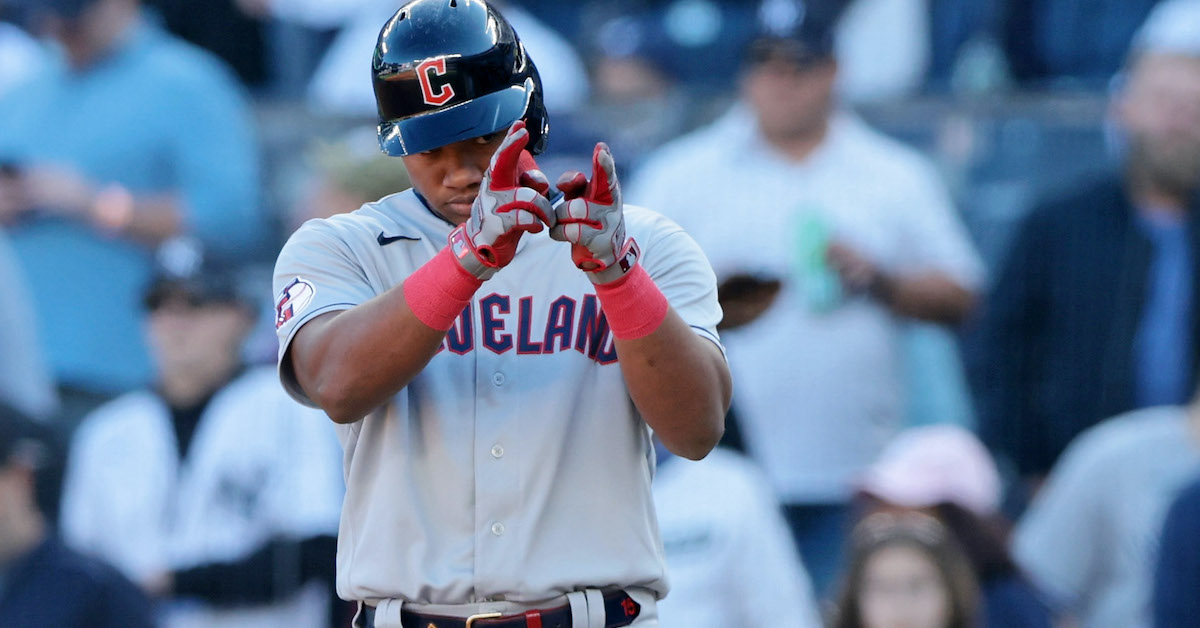
NEW YORK — When the season began, 24-year-old Oscar Gonzalez was at Triple-A Columbus, waiting for a shot at the majors. Six months later, he’s Cleveland’s Mr. Clutch, the man who has collected game-winning hits in extra innings in two of the Guardians’ three postseason wins. Last Saturday, his walk-off home run in the 15th inning against the Rays ended a four-hour, 57-minute epic and clinched the Wild Card Series for the Guardians. On Friday afternoon, he continued his postseason heroics by driving in the go-ahead run in the 10th inning against the Yankees via a bloop single, helping the Guardians to a 4–2 victory in Game 2 that evened the Division Series at one apiece.
The Dominican-born Gonzalez, a 6-foot-4, 240-pound slugger with huge power and arm strength, hit 31 homers last year between Double-A and Triple-A but was notably absent from Eric Longenhagen’s Top 48 Guardians Prospects list due to an approach that he described to me as “literally the most aggressive swinger in the minors.” Not only was he additionally unranked by Baseball America and MLB Pipeline, but the Guardians didn’t even protect him on their 40-ma roster ahead of the Rule 5 draft last winter, and he went unselected. He debuted with the Guardians on May 26 and hit a robust .296/.327/.461 (122 wRC+) with 11 homers in 382 plate appearances, but his 3.9% walk rate and 48.4% chase rate — the latter mark the majors’ third-highest among players with at least 300 PA — jibed with Eric’s reservations.
“He has the ability to hit the ball out of the ballpark, like he did the other day. But he also has the awareness to shorten up enough,” said manager Terry Francona afterward, referring first to Gonzalez’s series-winning drive and then to the 1–2 count in which he found himself against Jameson Taillon. “Getting the bat on the ball gives you a chance. And he’s young and he’s still learning.”
Gonzalez’s hit was just 58.9 mph off the bat and launched at a 39-degree angle into short right field, where the converging Anthony Rizzo and Aaron Judge had no chance. “[Taillon] threw the ball right by Gonzie his first two pitches and then he hit it. Didn’t hit it hard but he hit it. He got rewarded for it,” Francona said. Read the rest of this entry »
A flourishing youth movement was the major reason why Cleveland went from sub-.500 also-rans in 2021 to runaway division winners in ’22. By Baseball-Reference’s measures, the Guardians were the youngest team in the majors, with a weighted average age of 25.9 years old for their position players and 26.3 years old for their pitchers. But while rookies Steven Kwan and Oscar Gonzalez played significant roles in their turnaround, the biggest surprise on the team was second baseman Andrés Giménez, who after a rough 2021 season broke out and became an All-Star. He not only edged out José Ramírez for the team lead with a 140 wRC+ but also finished a whisker behind him with 6.1 WAR, good for fifth in the AL.
The 24-year-old Giménez was one of four players acquired from the Mets in the January 2021 blockbuster that sent Francisco Lindor and Carlos Carrasco to the Big Apple, along with current shortstop Amed Rosario (who himself had a very solid season), and two lower-level prospects (outfielder Isaiah Greene and righty Josh Wolf). Even for a franchise that had endured the departures of All-Stars such as Michael Brantley (free agency in October 2018), Trevor Bauer (traded to Cincinnati in July 2019), and two-time Cy Young winner Corey Kluber (traded to Texas in December 2019) as ownership slashed payroll, the Lindor trade was a bitter pill to swallow. He had been drafted and developed by the team, becoming a perennial All-Star who was already laying tracks toward Cooperstown.
Lindor, who would have been a free agent following the 2021 season, agreed to a 10-year, $341 million extension with the Mets just before Opening Day, but followed up with a modest-by-his-high-standards 4.2-WAR season, during which he was limited to 125 games by injuries. If that was a bit disappointing — and in the context of the Mets’ 77–85 season, it was, particularly when paired with Carrasco’s 12-start, 6.04 ERA slog — then the other side of the deal wasn’t much to write home about, either. Read the rest of this entry »
There were two big stories coming into Game 2 between the Astros and Mariners. The first was Yordan Alvarez, hero of Game 1, destroyer of both baseballs and worlds. Before the game, TBS reported that Scott Servais had borrowed a line from Ted Lasso, encouraging his players to be goldfish and forget Tuesday’s heartbreaking defeat. Goldfish or no, the Mariners definitely remembered to be terrified of Alvarez. They also continued their strategy of throwing him sinkers, failing to understand that there is no such thing as the right pitch to throw Yordan Alvarez.
The second story was the pitching matchup. Luis Castillo was coming off a masterful start against Toronto in the Wild Card Series. Framber Valdez had a breakout 2022, including 25 consecutive quality starts. Weak pulled contact is his strength; per the broadcast, the Mariners spent batting practice working on shooting the ball the other way in preparation.
The matchup lived up to the hype. Together, Castillo and Valdez set down the first 10 batters of the game, though the former had a couple of bad misses in the first inning, yanking two pitches in a row against Jeremy Peña and sailing a four-seamer up and away against Alvarez. None of the rest of his pitches to the latter that at-bat touched the strike zone, but that was by design. Here’s what he saw in all three of his plate appearances:
Kyle Tucker kicked off the scoring in the second inning, pulling a slider that caught too much of the plate for a 370-foot home run to right. The solo shot had a launch angle of 43 degrees, which would’ve tied for the 18th-steepest regular-season homer of 2022. Read the rest of this entry »
A game that figured to be a pitcher’s duel and felt like a 11–10 outburst was neither. Instead, 20 hits, five home runs, and somehow just eight total runs later, it was a classic, tense, tooth-and-nail affair in which neither team enjoyed the comfort of a win probability over 75% until the conclusion of the seventh inning, and even then, it hardly felt that way. At the end, the Padres punched back and evened the score against their big brother/daddy, beating the 111-win Dodgers, 5–3.
After Los Angeles took Game 1 on Tuesday, Clayton Kershaw met Yu Darvish in Game 2 on Wednesday night in a matchup of two of the league’s finest of the moment and the last decade. But both had their hands full with deeply talented lineups. Darvish was missing velocity on most of his arsenal, issued two walks, and surrendered three home runs, but spread the damage out enough to leave with a lead, albeit after just 15 outs. Kershaw kept the Dodgers in the game but also lasted just five innings, though he did manage to pass Justin Verlander and reclaim, for now, the all-time career postseason strikeout record with 213. Read the rest of this entry »
If Phillies fans had known three days ago that their squad would leave Atlanta with a split, they’d all have told you that was swell. It felt as though they were playing with house money after surviving a late onslaught by a Braves lineup that squandered two woulda-coulda-shoulda, difference-making bases loaded situations in Game 1 and escaping with the victory, and they had both Zack Wheeler and Aaron Nola looming for the next two games. But at the mercy of Kyle Wright and Atlanta’s bullpen King Ghidorah of A.J. Minter, Raisel Iglesias, and Kenley Jansen, the Phillies were shut out in Game 2, sent packing in a 3–0 loss which didn’t even last as long (two hours and 49 minutes) as the rain delay that preceded it.
While leaving the den of the defending World Series champions even at a game a piece is, in a vacuum, a huge positive for the Phillies, the context of this split is somewhat alarming. The Braves have outscored them 8–1 over the last 14 innings, as Philadelphia mustered just three hits in this shutout loss. A masterful performance by Wright and opportunistic hitting in the sixth inning were pretty much all of what Atlanta needed to tie the series.
Wheeler largely performed as expected for most of the game. Second among big league starters in WAR across the last two seasons, he needed just 27 pitches to knife through three perfect innings at the start, his adrenaline-boosted fastball velocity a full tick above his 2022 regular-season mark. It’s especially encouraging to see that arm strength given that he is just a few starts removed from coming off the IL with forearm tendinitis.
It wasn’t until the sixth, thanks to some self-inflicted damage on Wheeler’s part, that the Braves broke through in a two-out rally. After he dispatched Marcell Ozuna and Eddie Rosario to start the inning, the righty hit Ronald Acuña Jr. with a fastball, resulting in a lengthy delay so the trainer could check on Acuña. (You know what it’s like to hit your funny bone on the door frame? Imagine the door frame is moving at 97 mph.) Read the rest of this entry »
NEW YORK — When Gerrit Cole signed his nine-year, $324 million deal with the Yankees in December 2019, he no doubt envisioned starting big playoff games in the Bronx in front of a packed house full of screaming fans. But while he’d taken the hill four times for the Yankees in the previous two Octobers, until Tuesday night’s Division Series opener against the Guardians, he’d never gotten to do so while wearing the home pinstripes. In his long-awaited postseason debut at Yankee Stadium, Cole shook off a recent rough stretch, dodged trouble early, found a groove, and turned in an impressive performance, allowing one run over 6.1 innings in a 4-1 victory.
Facing a contact-centric Cleveland team that posted the majors’ lowest swinging strike rate (9.1%) and strikeout rate (18.2%), Cole collected 19 swings and misses from among his 101 pitches (18.8%) and punched out eight hitters (29.6%). He allowed just four hits, including a solo homer by Steven Kwan, walked one and hit one batter. If it wasn’t an overpowering performance, it was nonetheless a rewarding one.
“It was very special for me,” said Cole of leaving the mound to an ovation from the 47,807 fans in the seventh inning, by which point the Yankees had come from behind to secure the lead. “The game’s not over, I left with traffic [on the bases], so it’s not the most comfortable time to acknowledge the crowd, but I certainly felt it and appreciated it… What a wonderful experience to have them behind us.” Read the rest of this entry »