Jake Mangum is impressing as a 29-year-old rookie. Seven years after being drafted by the New York Mets out of Mississippi State University following four collegiate seasons, the switch-hitting outfielder has slashed .303/.346/.370 with a 109 wRC+ over 128 plate appearances with the Tampa Bay Rays. Moreover, Mangum has swiped 10 bags without being caught.
His path to pro ball included being bypassed in the draft out of high school, then opting not to sign after being a low-round pick following his sophomore and junior seasons. One of the teams that called his name didn’t make an offer so much as wish him well. “Good luck with school next year,” was their message to the high-average, low-power Bulldog.
Mangum went to finish his college career with a .357/.420/.457 slash line, as well as a Southeastern Conference-record 383 hits. He also finished with a degree in business administration — although that’s not something he expects to take advantage of down the road. Paying days have a shelf life, but he plans to “stay around the game forever.”
A lack of balls over fences contributed heavily to the limited interest he received from scouts. When he finally inked a contract, the 2019 fourth-rounder had gone deep just five times in 1,200 plate appearances.
“It was always the power piece,” explained Mangum, whose ledger now includes 24 home runs in the minors and one in the majors. “They just didn’t see it playing in professional baseball, my not having enough power. I’m stronger now, but to be honest with you, I don’t try to hit home runs. I try to hit for a high average and help the team with good defense and base running.”
It was a beautiful night here in Brooklyn on Wednesday, and although I couldn’t make it to Citi Field in time for Mets-Nationals, I decided to go for a long walk and then stop at a local sports bar to read and watch some baseball. Naturally, the Mets were on one of the TVs behind the bar, while the other was reserved for the Yankees, who were set to play the Royals a little while later. That was a bummer for the two Red Sox fans sitting next to me, Mike and Kathleen, but they were resourceful. The bar has free wifi, so Mike pulled up Boston’s game against the Rays on his phone. He and Kathleen didn’t know one another, but they recognized each other as fellow Sox fans from the weekend prior, when they were both at the same bar to watch Yankees-Red Sox. He moved over to the stool between Kathleen and I, so that she and her partner Harry could also watch the game. The four of us started talking, and it turns out Harry and I went to the same high school, though he graduated four years ahead of me. Small world!
Anyway, sometime between Marcelo Mayer’s first and second home run of the game, Kathleen said to me, “The best thing about Red Sox fans is we simultaneously love and hate the Sox, and we love to hate them, too.” I bring this up because I thought about her description of Boston fans as I sat down to answer the first question in this week’s mailbag.
We’ll get to that in a moment, but before we do, I’d like to remind all of you that while anyone can submit a question, this mailbag is exclusive to FanGraphs Members. If you aren’t yet a Member and would like to keep reading, you can sign up for a Membership here. It’s the best way to both experience the site and support our staff, and it comes with a bunch of other great benefits. Also, if you’d like to ask a question for next week’s mailbag, send me an email at mailbag@fangraphs.com. Read the rest of this entry »
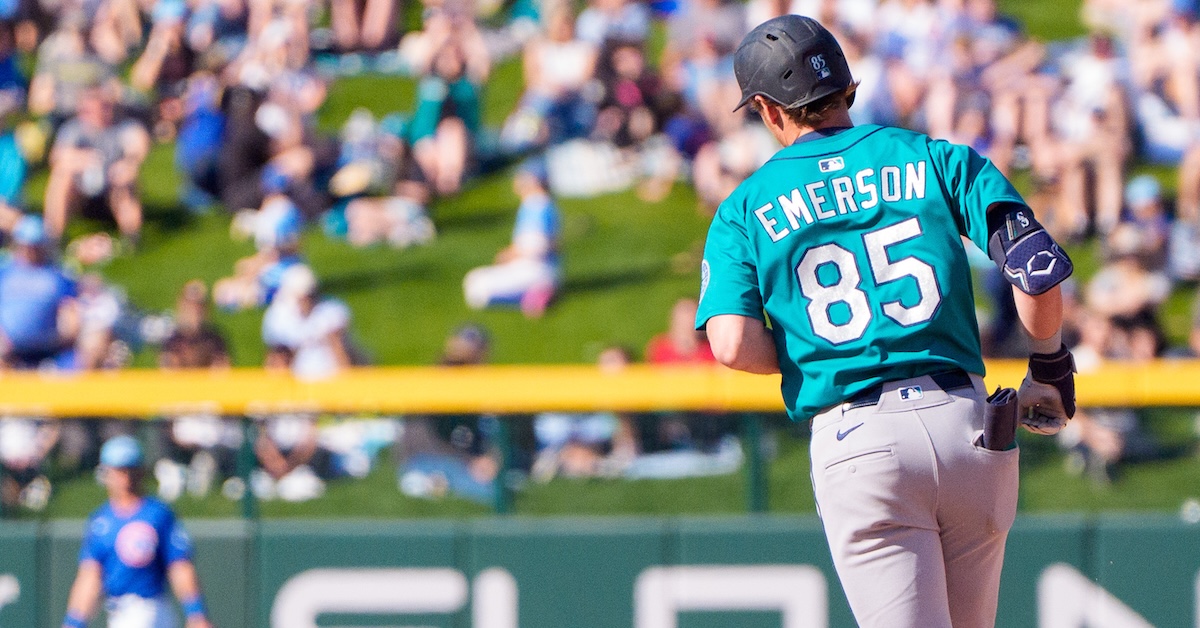
Below is an analysis of the prospects in the farm system of the Seattle Mariners. Scouting reports were compiled with information provided by industry sources as well as my own observations. This is the fifth year we’re delineating between two anticipated relief roles, the abbreviations for which you’ll see in the “position” column below: MIRP for multi-inning relief pitchers, and SIRP for single-inning relief pitchers. The ETAs listed generally correspond to the year a player has to be added to the 40-man roster to avoid being made eligible for the Rule 5 draft. Manual adjustments are made where they seem appropriate, but we use that as a rule of thumb.
A quick overview of what FV (Future Value) means can be found here. A much deeper overview can be found here.
All of the ranked prospects below also appear on The Board, a resource the site offers featuring sortable scouting information for every organization. It has more details (and updated TrackMan data from various sources) than this article and integrates every team’s list so readers can compare prospects across farm systems. It can be found here. Read the rest of this entry »
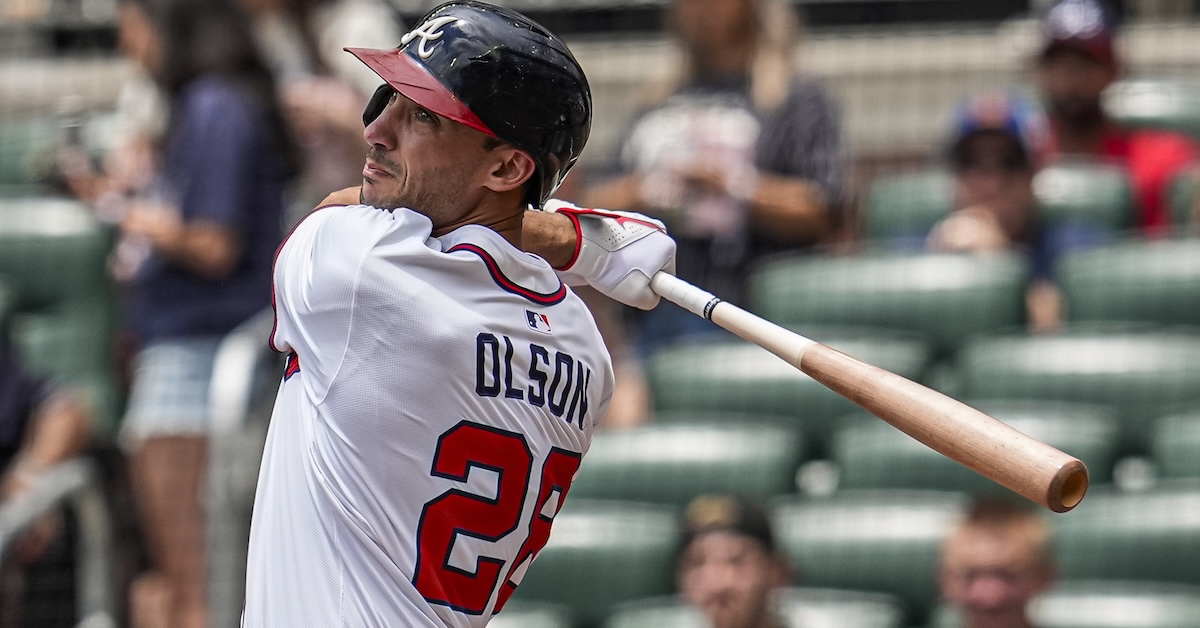
Matt Olson is having an outstanding career. Since breaking into the big leagues late in the 2016 season, the 31-year-old first baseman has blasted 273 home runs — including 54 in 2023 — while logging a 132 wRC+. A left-handed hitter, he’s garnered two All-Star nods, two Gold Gloves, and one Silver Slugger award. Originally with the Oakland Athletics, Olson has worn an Atlanta Braves uniform since they acquired him via trade in March 2022.
He was a promising-yet-polarizing prospect when Kiley McDaniel ranked him second behind Franklin Barreto on our 2015 Athletics Top Prospect list. Olson’s raw power was obvious, but there were also question marks. While some scouts were bullish on his future, others had their reservations. Drafted 47th overall in 2012 out of Parkview High School in Lilburn, Georgia, Olson had a degree of boom-or-bust in his profile.
What did Olson’s February 2015 FanGraphs scouting report look like? Moreover, what does he think about it all these years later? Wanting to find out, I shared some of what McDaniel wrote and asked Olson to respond to it.
———
“Olson has some pedigree as a former sandwich pick out of an Atlanta-area high school.”
“Once you get into pro ball it doesn’t matter too much,” Olson said. “At the same time, organizationally they kind of care more about the investment that is put into a guy than the player actually playing the game. As far as [having signed out of high school], you’re only playing 50 games in college, as opposed to 140 in the minors. As a hitter, I think it can be beneficial to get out there and get the day in, day out a little bit sooner.”
“He had a huge year in the Cal league last year and he has some big tools, headlined by easy plus power from the left side.”Read the rest of this entry »
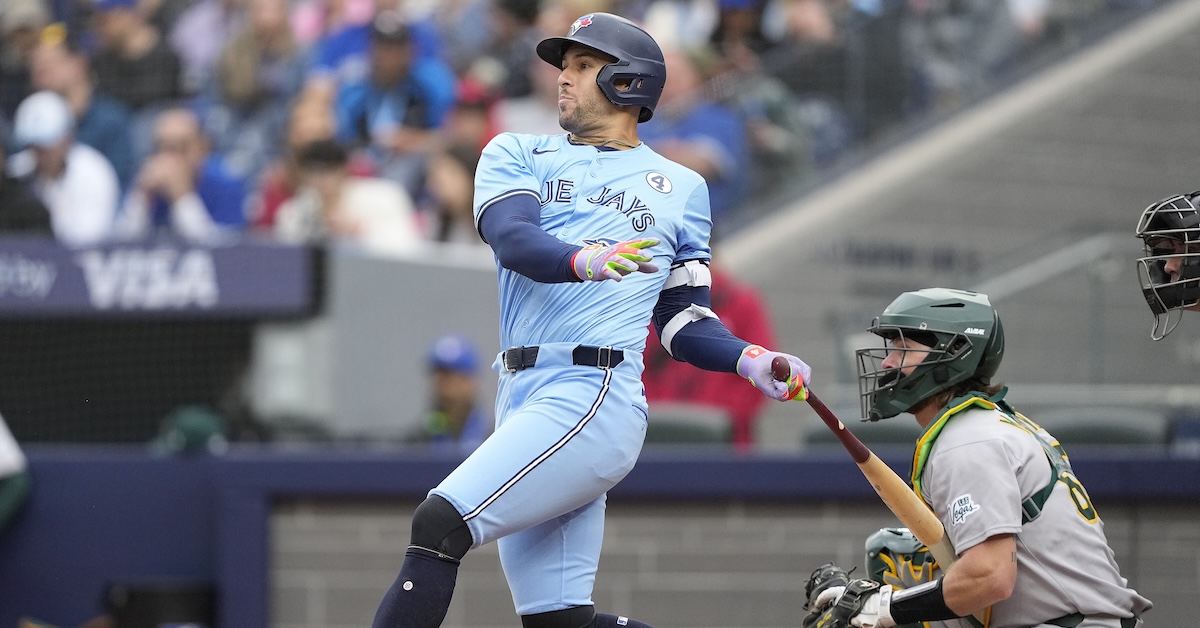
In the sixth inning of Monday’s game between the Blue Jays and the Cardinals, George Springer got a pitch to hit, a hanging curveball that split the center of the strike zone. He recognized the pitch late and fouled it off:
His post-swing demeanor suggests that he considered it a missed opportunity, and it’s clear to see why. With a pitch like that, he was thinking extra bases; instead, Andre Pallante got a strike for his troubles. Now Springer’s back was against the wall. Pallante came back with a much better pitch on 1-2, but Springer spoiled it:
Unlike the previous miss, this looked like a calculated act to me. Springer was late on the pitch, but it was too close for comfort, so he took a defensive cut, meeting the ball early in his swing and punching it harmlessly away.
Welcome to the confusing world of analyzing foul ball rate. Both of Springer’s swings produced the same result, but the first one was a poor outcome for him and the second a desirable one. You can argue that the second pitch would have been a ball if he hadn’t swung, but he certainly wasn’t sure of that when he committed to swinging; living to fight another day against such a well-located pitch is a good outcome.
You probably wouldn’t be surprised to learn that Luis Arraez, Nick Allen, and Brice Turang are among the leaders in early-count foul ball rate (foul balls per swing). They swing a lot, make a lot of contact, and spray their contact to all fields, including foul territory in every direction. On the other side of the coin, you’ve got sluggers like Bryce Harper, Aaron Judge, Vladimir Guerrero Jr., and yes, Springer. These guys don’t swing as often, which means a few things. First, they swing at better pitches on average, which leads to better contact. Second, they make less contact on average, and less contact means fewer fouls, even for the same rate of fouls-per-contact.
I’d rather be in the second camp than the first there. Early-count foul balls are a waste, literally the same as a swinging strike. They might be worse, even – baserunners can’t steal, catchers can’t block poorly and allow a passed ball. A full 46% of Arraez’s swings – 48% for league leader Wilyer Abreu – end up as foul balls. Sure, contact is great, but when half of it counts as a strike, it’s a lot less enticing.
Things change with two strikes, though. When a foul ball extends the at-bat instead of ending it in a strikeout, it becomes valuable instead of detrimental. Have you ever watched Jake Cronenworth hit? With two strikes, he turns into a lacrosse goalie, trying to redirect everything in the vicinity of the strike zone. He’s not trying to hit a homer unless the pitcher truly grooves him one; he’s specifically looking to avoid a strikeout. Cronenworth sports the highest foul-per-swing rate in baseball with two strikes at 51.2%. It works – he still strikes out a decent amount because of his penchant for running deep counts, but he walks 16% of the time because eventually pitchers miss the zone.
The bottom of the two-strike foul ball rate list, on the other hand, is filled with strikeout-prone types. Javier Báez makes foul contact on just 27% of his two-strike swings. Judge, who still strikes out a ton even as he rewrites the record books, is towards the bottom. So are Jackson Chourio, Shohei Ohtani, Fernando Tatis Jr., Kyle Schwarber, and all nature of excellent sluggers. You can get away with it if you hit like those guys, but Andrew Vaughn, Brenton Doyle, Miguel Andujar, and Michael Toglia are floundering under the weight of their inability to fight pitches off. This isn’t a disqualifying statistic, in other words, but it’s surely a bad thing; it’s directly leading to higher strikeout rates, and unless you have light tower power, many of the pitches you swing at with two strikes aren’t the kind you can hit for extra bases anyway.
I’d posit that high foul ball rates before two strikes are bad, while high foul ball rates with two strikes are good. Early in the count, fouls are a waste, while late in the count, they’re a get out of jail free card. Assuming that these two events are equivalent doesn’t make much sense to me; hitters behave differently, and if we don’t credit them for that different behavior, we’re missing something essential about the act of hitting.
To measure this, I had to put everything on the same scale. I first took every hitter who has swung at 200 or more pitches early in the count, found the average foul ball per swing rate, then normalized each player’s foul ball rate into z-scores. I did the same for every hitter who has swung at 100 or more pitches in two-strike counts. That gave me two scores for every hitter: early-count foul rate and two-strike foul rate. I flipped the sign of the early-count foul rate scores – lower is better – and then summed the two.
This let me separate out the hitters who always have high foul ball rates or always have low foul ball rates – they don’t demonstrate this skill of changing their approach in a measurable way. Arraez, for example, makes foul contact on 46.2% of his early-count swings and 46.3% of his two-strike swings. It’s the same approach, and because the league as a whole cuts down on their swings and makes more foul contact with two strikes, Arraez rates below average in this metric. He’s two standard deviations above average in his early-count foul rate and only 1.6 above average in two-strike foul ball rate, a net of -0.4 for his “foul score.” Allen is even worse – he makes foul contact on 47.1% of early-count swings, but only 39.3% of two-strike swings. When pitchers try to throw the ball past him, they succeed. His foul score is a woeful -2.15.
That’s among the worst marks in the majors, but the actual worst hitter is doing a lot worse than that. That would be Andujar, who is making a ton of foul contact early (44.6%) but almost never when he needs it to stay alive (27.4%). The result is a foul score of -4.2. If you’re wondering why a guy with his skills – solid bat speed, elite contact rate – has never taken off in the majors, it might be related to this. Likewise, if you’re trying to puzzle out what’s ailing Xander Bogaerts this year, it can’t help that he makes foul contact 39% of the time early but only 30% of the time late, for a foul score of -2.2.
Most big leaguers aren’t outliers to this degree. More than 60% of the league has a foul score between -1 and 1, and 93% fall between -2 and 2. The top 10 hitters by this metric have an aggregate wRC+ 20 points higher than the bottom 10, but most players fall into the broad, undifferentiated middle. I’m not saying that this is a skill that everyone in baseball has or should use, but I do think that it’s measuring a real ability.
That brings us back to Springer, a paragon of adaptability. Early in the count, he’s allergic to foul balls, fouling the ball off just 30.6% of the time. Put him in a two-strike count, however, and he goes into protect mode, fouling off the ball with 42% of his hacks. He’s demonstrated some version of this skill throughout his career, in fact. His worst two years for modulating his foul ball rate were 2023 and 2024 – perhaps not coincidentally, those were the two worst offensive years of his career.
Another standout in the field? Springer’s erstwhile teammate, Carlos Correa, who is roughly Springer’s equal in foul score this year and has been even better over the course of his career. Was this part of the Astros’ famed no-strikeouts transformation? I obviously can’t say with any certainty, and they might have been doing a few other things to tilt things in their favor, but a solid approach like this can’t hurt.
It’s not all former Astros. Harper has learned this skill over time. During his Nationals tenure, he didn’t change his approach much at all when reaching two strikes. Since joining the Phillies, however, he’s running one of the largest differences between early-count foul rate and two-strike foul rate in the entire major leagues. And hey, would you look at that, he has a huge foul score this year, too – his 28% early-count foul rate and 37% two-strike foul rate land him fourth in the majors in foul score.
When fans and analysts talk about smart hitters with bat control, I’d argue that they’re implicitly describing this skill. The ability to take different swings depending on the context – prioritizing loud, fair contact early, then choking up and defending late – thrills old-school and new-school fans alike. That ability to adapt is more valuable than always slapping at the ball or always trying to hit it out of the park.
If you’re like me, you have one big question: Is this a sustainable skill, or does it flicker in and out from one year to the next, introducing noise into hitters’ production? The outliers here clearly seem to have an edge – Harper, Springer, and Correa do it consistently. Allen and Andujar have always made more foul contact with two strikes than early in the count; they’ve never possessed this skill. Still, I wanted to check whether it’s a talent (or hinderance) held by only a few.
To do so, I took data from 2023 and 2024. I identified the top 10% and bottom 10% of hitters in 2023, then compared their performance to 2024. The top 10% of hitters averaged a score of 1.7 in 2023 and 0.6 in 2024. The bottom 10% of hitters averaged -2 in 2023 and -0.4 in 2024. Expand it to the top 25%, and you get a similar result: 1.2 in 2023 and 0.3 in 2024 for the top 25%, -1.6 in 2023 and -0.4 in 2024 for the bottom 25%. There was a 0.3 correlation between year-one foul score and year-two foul score. It’s a real skill – not as strong as, say, home run rate or swinging strike rate, but nevertheless something where hitters who are good at it in one year tend to be good at it in the next.
So the next time you see George Springer foul off an early hanging breaking ball, you’ll know: That’s a rare event. And next time you see Bryce Harper turn an 0-2 count into an all-out foul ball battle, yep, that’s years of training showing through. These guys are good at what they do, and it’s a thing that you, the fan, implicitly know is a good thing. Isn’t baseball cool?
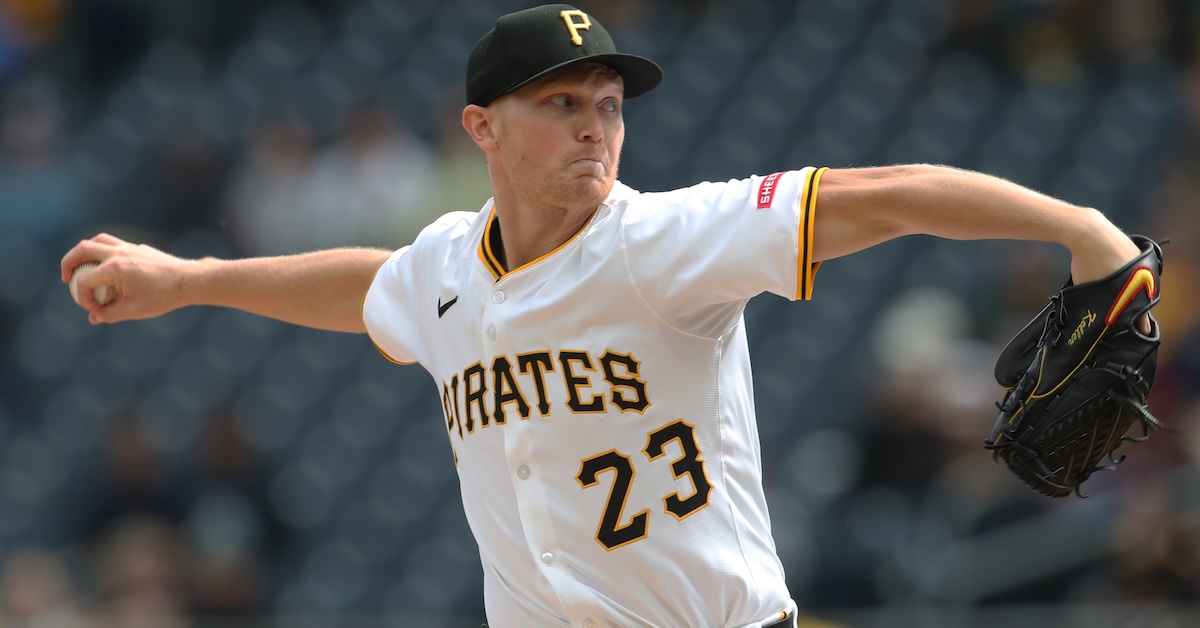
The Pirates beat the Phillies 2-1 on Sunday, and near as I can tell everyone was pissed about it. The Phillies, a would-be World Series contender, had just gotten swept by a team they’d been hoping to do some damage against, and dropped to 1-9 in their previous 10 games. The Pirates, for their part, had just gotten one over (three over, actually) on their intrastate rival, but Paul Skenes didn’t get the win.
The biggest, scariest pitcher in the league had gone 7 2/3 innings, allowing only one unearned run, but had left the game while it was tied in the top of the eighth. That left the NL Cy Young frontrunner with an ERA of 1.88 in 91 innings, but a record of just 4-6. Is it important for Skenes to get the win? Not exactly. But the incongruity between record and performance was just another reminder of how little support this disappointing team is giving the generational talent that had fallen into its lap.
Skenes is the class of the Pirates rotation, but he’s not the only talented pitcher the Bucs have. Even with Jared Jones and Johan Oviedo in the shop getting their elbows worked on, Mitch Keller is having a solid season. Keller is top 25 in the league in innings and WAR, and despite some indifferent strikeout numbers, he’s kept the ball in the yard and scratched out a 4.13 ERA — that’s a 100 ERA- on the dot — with a 3.27 FIP. Read the rest of this entry »
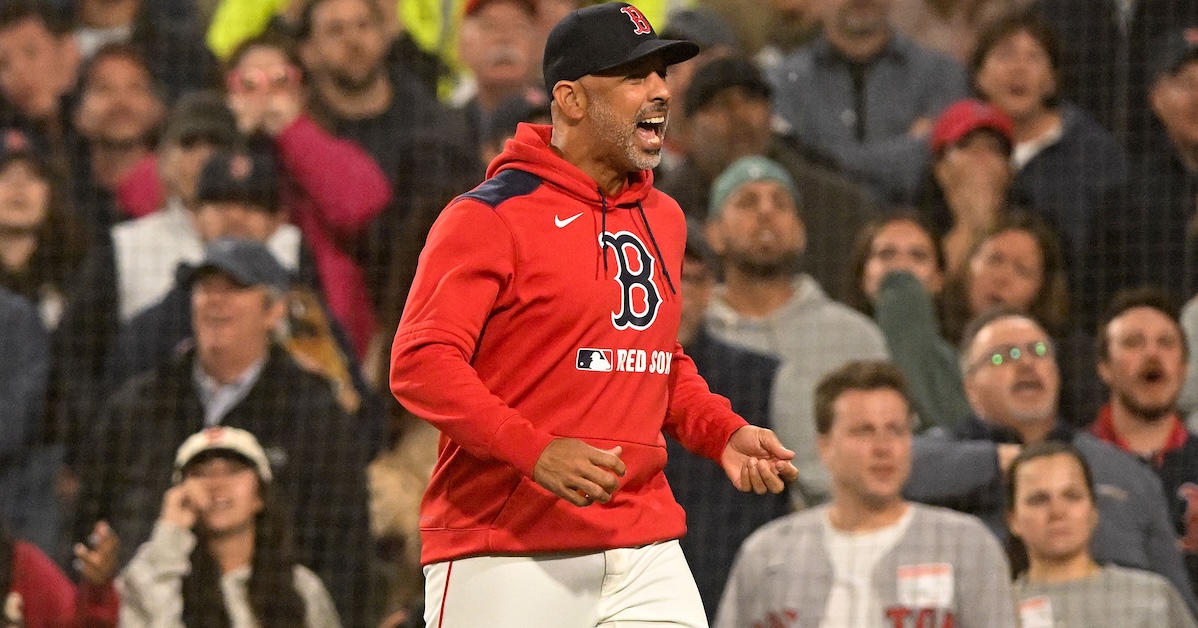
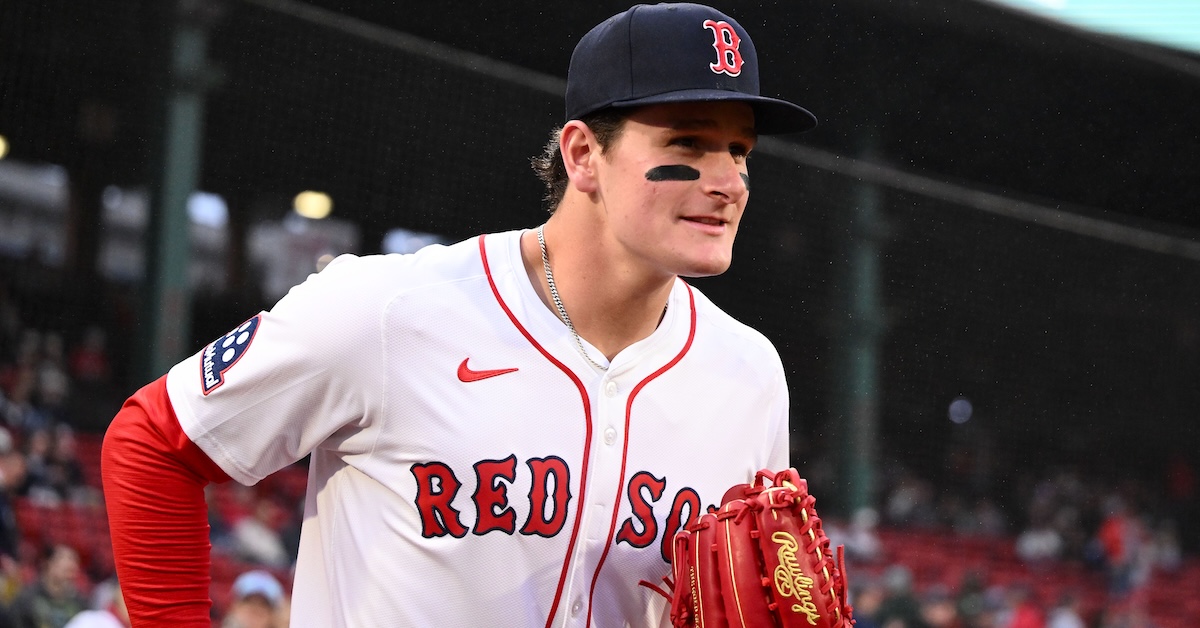
The wait is over. On Monday, the Red Sox called up Roman Anthony, the consensus top prospect in baseball. He batted fifth and played right field against the Rays, going 0-for-4 with a walk, an RBI, and a costly error. After spending the last few seasons absolutely torching the minors, it turns out Anthony just needed to smash a 497-foot grand slam – the longest ball hit in either the majors or the minors this season – in order to earn his spot in Boston.
What really brought Anthony to Boston was a left oblique strain to Wilyer Abreu, whom the Red Sox placed on the IL when they announced Anthony’s promotion (though the 497-footer certainly couldn’t have hurt). The team designated Ryan Noda for assignment to open a 40-man roster spot.
After all the anticipation, the promotion happened at the very last minute; there were no tear-jerker undercover boss videos. Although Abreu showed discomfort during Friday’s game against the Yankees, the team wasn’t sure until Monday afternoon that he’d actually need to go on the IL. The Triple-A Worcester Red Sox were on the bus about to head to their next series in the Lehigh Valley when the big club called and asked them to wait. Everybody piled off the bus, but the team’s gear was already en route to Pennsylvania. So Anthony drove up the Mass Pike after getting the news and played the game in borrowed cleats. Luckily, teammate Marcelo Mayeralready had one of Anthony’s bats.
The Red Sox could certainly use a savior right about now. At 32-36, they’re in fourth place in the East, nine games behind the Yankees, and 4 1/2 games out of the final Wild Card spot. We currently have them with a 15.7% chance of making the playoffs. Read the rest of this entry »
You know Shohei and Clayton and Freddie and Mookie. Teo and Will Smith and Blake Snell and Roki. But do you recall the least heralded Dodger of all? Well, that’s not exactly fair, and I didn’t even name all the famous Dodgers, but here’s the point: I’m writing about a Dodger who isn’t one of the guys who seem to steal every headline.
Meet Andy Pages, the Dodgers’ everyday center fielder. A year ago, Pages was just another hopeful, the latest in a line of plus-bat, where-can-he-play-defense-though options cycling through the corners in Chavez Ravine. Pages’ prospectreports paint a clear picture: a swing built for lift, plenty of swing-and-miss, and sneaky athleticism that exploded after Pages returned from shoulder surgery. In 116 games of big league play, he took over center field (mostly out of necessity — he looked stretched there at times) and posted a league average batting line, though without the home run power that evaluators expected from him.
If you could freeze time there and give the Dodgers the option of having exactly that Pages for the next five years, I think they would have begrudgingly accepted it. Teams as full of stars as Los Angeles’ current squad need role players to fill the cracks in the roster, and outfielders who can handle center and hit at least okay are always in high demand. That isn’t to say that there weren’t encouraging signs – Pages’ athleticism was better than advertised and he showed plus bat speed – but a bird in the hand is worth two in the bush, and he was already an excellent cog in the machine even without fully unlocking his power.
Flash-forward to this season. Pages started the year playing center and batting ninth. That’s the lineup spot for a complementary piece, a defensive specialist or fourth outfielder. He started slow, with a 70 wRC+ over his first month of play. The Dodgers didn’t have better options defensively, and in fact, Pages looked downright smooth out there, both to my eyes and to defensive model grades. When your team posts a collective 126 wRC+ for the months of March and April (for the months of May and June so far, too — this team is pretty good!), you can live with a below-average hitter playing a tough defensive position, so the Dodgers kept running Pages out there, slow start and all. And that brings us to April 22, when Pages got hot and didn’t stop. Read the rest of this entry »
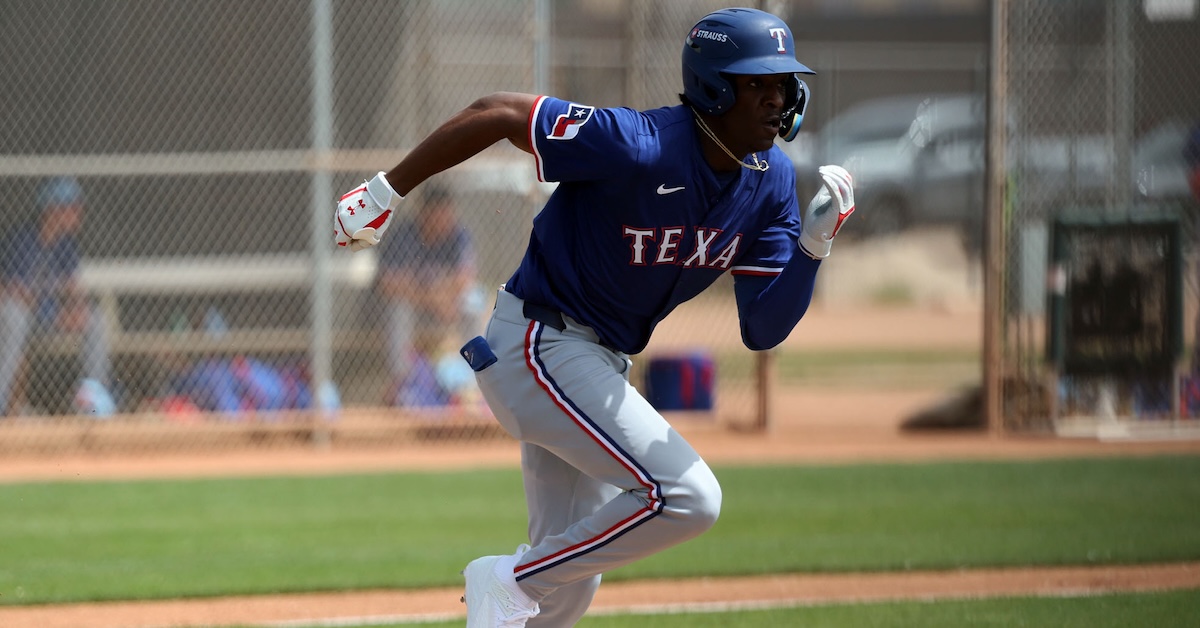
Below is an analysis of the prospects in the farm system of the Texas Rangers. Scouting reports were compiled with information provided by industry sources as well as our own observations. This is the fifth year we’re delineating between two anticipated relief roles, the abbreviations for which you’ll see in the “position” column below: MIRP for multi-inning relief pitchers, and SIRP for single-inning relief pitchers. The ETAs listed generally correspond to the year a player has to be added to the 40-man roster to avoid being made eligible for the Rule 5 draft. Manual adjustments are made where they seem appropriate, but we use that as a rule of thumb.
A quick overview of what FV (Future Value) means can be found here. A much deeper overview can be found here.
All of the ranked prospects below also appear on The Board, a resource the site offers featuring sortable scouting information for every organization. It has more details (and updated TrackMan data from various sources) than this article and integrates every team’s list so readers can compare prospects across farm systems. It can be found here. Read the rest of this entry »
Ron Washington has formed strong opinions over his long time in the game. One of them is built on old-school common sense. The 73-year-old Los Angeles Angels manager doesn’t believe in hefty hacks from batters who don’t possess plus pop, and that’s especially the case when simply putting the ball in play can produce a positive result. Which isn’t to say he doesn’t like home runs — “Wash” is no fool — it’s just that he wants his hitters to play to the situation. Moreover, he wants them to play to their own strengths.
The subject came up when the veteran manager met with the media prior to a recent game at Fenway Park. Zach Neto had gone deep the previous day — it was his 10th dinger on the season — and Washington stated that he doesn’t want the young shortstop thinking home run. I proceeded to ask him if he likes any hitter thinking home run.
“That’s a tough question,” he replied. “You’ve got guys that are home run hitters — that’s what they do — and you’ve also got guys that are home run hitters who are ‘hitters.’ There are guys that can walk up to the plate, look for a pitch, and take you deep if you throw it. Neto is not one of them.
“The game of baseball has transitioned itself to the point where everybody is worried about exit velocity and launch angle,” added Washington. “Even little guys have got a launch angle. They’re supposed to be putting the ball in play, getting on the base paths, causing havoc on the base paths, and letting the guys that take care of driving in runs drive in the runs. But for some reason, the industry right now… everybody wants to be a long-ball hitter. And I see a lot of 290-foot fly balls. I see a lot of 290-foot fly balls where they caught it on a barrel. If you caught the ball on a barrel and it only went 290 feet, you’re not a home run hitter. I see a lot of that.”
What about hitters that do have plus power? Does Washington like them thinking home run? That follow-up elicited any even lengthier response. Read the rest of this entry »