The proliferation of Stuff models has invariably pitted capital-S Stuff against command in terms of their respective importance to a pitcher’s success. If you had to choose one, is it better to locate well, or is it better to be filthy?
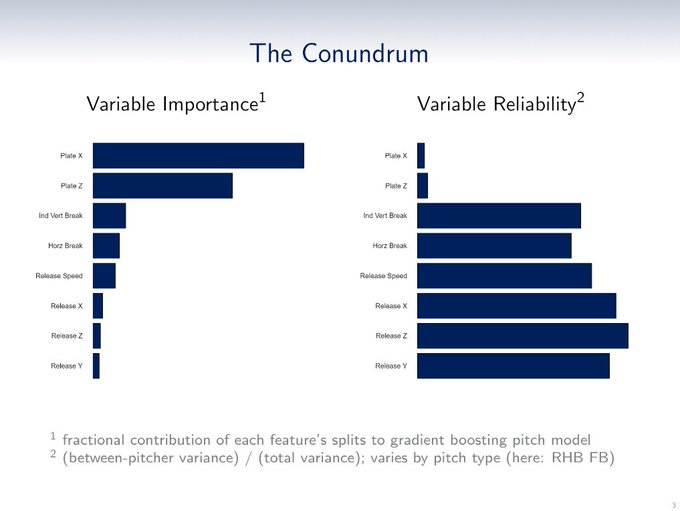
The answer to this question is why baseball is beautiful and delightful but also occasionally horribly frustrating. From Vicente Iglesias and Scott Powers:
Importance, in layman’s terms, means how relevant a variable is to explaining an observed outcome; reliability is how much we can expect a variable to repeat or be repeated. In baseball, we often talk about these ideas in terms of “descriptiveness” and “predictiveness.” This dichotomy illustrates the Catch-22 that forever propels baseball forward in all its uncertain glory: pitch location plays an outsized role in determining the outcomes we witness, yet we cannot expect to rely on it year over year. Meanwhile, Stuff is much more reliablenext year — i.e., changes to a pitcher’s pitches in terms of velocity, movement, and release point tend to vary to a much smaller degree over time — but it plays a significantly undersized role in influencing actual outcomes this year. Brutal stuff. Why do we even bother? Read the rest of this entry »
Yesterday, I laid out a new method of quantifying depth that we’re looking into here at FanGraphs. It’s based on the idea that while our depth charts are a point estimate of how much each player will play, the real-life way things work is different. To mimic reality more closely, we’re experimenting with removing players from the depth charts algorithmically and rebuilding teams on the fly to see how they look without their best players. Yesterday’s article covers our methodology in great detail.
There’s one thing that I wanted to add to that article but couldn’t find the space for: more tables. There was one big giant table in there that showed each team’s winning percentage as we removed more and more players from their squad. But that’s just not a great way to look at anything – 300 numbers in a giant table is more information than our brains can easily process. I don’t have a lot of new information today, but I thought I’d slice that data up into more bite-sized chunks so you can look at it without your eyes glazing over. One quick note: All the tables in this article are sortable, so you can order them by whichever category you so desire. Read the rest of this entry »
In his recent piece about umpire accuracy, Davy Andrews noted that plate umpires correctly called 99.26% of heart zone pitches in 2023. When I first read that number, I didn’t think missed calls in the heart zone warranted any closer investigation. For most of us, ninety-nine point anything is as good as 100; you don’t spend much time worrying about the 0.01% of germs Purell can’t kill. Then again, if you were to consider the sheer amount of bacteria on your hands at any given moment, you might opt for a second squirt of sanitizer. A tiny percentage of a tremendous number is still going to be a pretty big number. The same is true for missed calls in the heart zone. There aren’t quite as many pitches in an MLB season as there are germs on your phone screen, but there are enough that a few tenths of percent of heart zone offerings still represents a pretty hefty figure. In 2023, plate umpires watched 381 pitches sail over the heart of the plate without signaling a strike. When you frame it that way (pun absolutely intended), it actually sounds pretty bad.
I wasn’t nearly as surprised to learn that plate umpires missed 428 calls in the chase zone last season. Offerings in the chase zone are designed to look hittable out of the pitcher’s hand. An especially talented catcher can make them look hittable as they reach his glove, too. Meanwhile, a batter might like to earn a few extra balls inside the zone, but he doesn’t have the same influence over calls as do his opponents. Besides, if a hitter recognizes that a pitch is coming for the heart zone, he’s not going to wriggle and contort his body in hopes of inducing a missed call – he’s going to swing. To that end, batters are much more likely to swing in the heart zone than the chase zone, which means that on a rate basis, umpires miss significantly more calls over the heart of the plate because there are fewer total pitches there that need to be called. While 381 and 428 are similar figures, batters took 2.4 times as many pitches in the chase zone as in the heart zone. Apparently, it’s harder than I thought to call strikes what they are. Read the rest of this entry »
One of the great perks of working at FanGraphs is that I get to discuss baseball with my equally obsessed coworkers. Obviously, this is the kind of job you don’t get into unless you love the sport. A lot of the time, that means we just end up nerding out over how much we enjoy some minor but cool thing, or perhaps discussing our favorite of the game’s idiosyncrasies. Sometimes, though, we come up with new ideas together, or one person’s passing fancy turns into another person’s brainstorm, and before you know it, something nifty and novel is happening.
That’s why I’m writing this article today. At the December Winter Meetings, a subset of us sat down for our annual let’s-talk-about-fun-baseball-problems technical meeting. David Appelman and Sean Dolinar ran things. Folks like Jeff Zimmermann and Dan Szymborski popped in at various points. Jason Martinez and Keaton Arneson had big plans for how to improve the site’s functionality. Those guys are great at building models, running websites — advancing the state of how FanGraphs (and ZiPS) works, basically. I like to make jokes and write articles about bunts, so as far as I can tell, I got invited because I’m good at coming up with bad but interesting ideas.
That said, this year one thing was on a lot of our minds: depth. I’ve written a lot about how well our playoffoddsreflectreality. They’re pretty good! But there’s always been an obvious problem with them. They use static rosters, which means they don’t account for the fact that some teams are more vulnerable to injury or underperformance than others. Read the rest of this entry »
We will not be breaking new ground today. What you read in this article won’t change the way you understand baseball. However, it might help you to appreciate a few baseball players for who they are, and that strikes me as a noble goal. A couple weeks ago, Ben Clemens introduced Whomps Per Whiff, a stat that divides barrels by whiffs in order to show “how often you absolutely whomp the ball, as compared to how often your swing results in nothing but a tiny gust of air.” It was a remarkably simple way of looking at hitting, and the leaderboard featured some of the best hitters in baseball. It was also a fun article, and I agreed with several of its underlying premises:
If there’s one thing baseball doesn’t have enough of, it’s statistics.
Anybody can make up a statistic, as long as they have a dream in their heart and a copy of Microsoft Excel.
It’s important that those statistics have silly names. That’s why I’ve been lobbying to have people pronounce wRC+ as “Work-Plus,” preferably in a Rihanna voice.
The introduction (and then reintroduction) of the designated hitter to the National League wasn’t the smoothest of rollouts. It was first brought about as a safety measure in the chaos of the pandemic-shortened 2020 season, designed to relieve unnecessary stress on pitchers who were already dealing with a disrupted preseason. Despite the best efforts of the Players Association, the DH was removed from the NL for 2021, as the league declined to implement it without getting something in return (in this case, a delayed and potentially shortened season). A year later, and more than two months into the lockout, as the league and the union battled through negotiations over the new collective bargaining agreement, it was announced that the universal DH would return for the upcoming season, this time indefinitely.
It was a difficult task for NL teams to prepare one way for one season and another for the next. Of course, any hitter can slot into the DH spot on any given night, but not every team comes with a player who can provide real value with his bat alone, and it takes time either to acquire or develop a player like that, or to build enough depth to overcome not having one. With the universal DH, NL clubs would need to get another 700 or so productive plate appearances from their rosters — that’s no small feat. Understanding this, let’s consider the state of the DH in the National League. Read the rest of this entry »
There is no baseball topic that gets me more excited than swing diversity. A player’s swing is like a fingerprint: No two are the same. But even similar swings can yield extremely different results. There are many ways to compare swings, but because Vertical Bat Angle (VBA), the angle of the bat at contact relative to the ground, is the most accessible (thanks, SwingGraphs), it’s been my go-to proxy for the last year or so. Of course, you can always use your eyes to visually analyze swings, but having the data to confirm it helps inform the evaluation.
Lately, my video evaluations have focused on hitters with steep VBAs, and even among this group there is a ton of swing diversity. Some take golf-like swings to get to their steep planes and others employ one of my favorite styles: the chicken-wing swing.
Intuitively, it makes sense that hitters with steeps paths are more prone to whiffs than those who have flatter swings. Even so, some of the game’s best contact hitters have swings as steep as some of those who are the most whiff prone. Luis Arraez, for example, has a swing that is just as steep as J.D. Martinez’s, at least according to VBA. Without the data to confirm, it’s hard to know if the same holds true for Attack Angle (AA), the angle of the bat’s path at impact.
To show you exactly what I mean, I’ll compare pairs of hitters with nearly identical average VBAs, but different offensive profiles. A few weeks ago, Davy Andrews wrote about Edouard Julien and the bizarre nature of his platoon splits (and a tune to go along with it). His entire offensive profile drastically changes depending on if he’s facing a lefty or righty. It’s fascinating. After I read the piece, I was immediately curious as to how those trends might relate to Julien’s swing path. At 40 degrees, Julien has one of the steepest VBAs in the majors. It’s almost a perfect diagonal. Here are a few slow motion swings that showcase that:
No matter how high or low the pitch is, Julien manages to get his bat on a diagonal, which last year helped him run an xwOBACON of .443, well above average. His diagonal angle also allows him to crush fastballs. He had a .408 wOBA against heaters but struggled mightily (.287 wOBA) vs. breaking balls. Production against different pitch types is where you tend to see some deviation between hitters with similar VBAs. Like Julien, Freddie Freeman is also a lefty batter with a steep VBA (41.7 degrees), yet despite their similar angles, Julien ran a 44.3% whiff rate against breaking pitches, while Freeman’s whiff rate vs. breaking balls was 27.7%. There are swing components other than VBA that contribute to how such divergence can happen. But before getting to that, let’s check out some of Freeman’s swings from 2023:
Man, Freeman is smooth. Because both he and Julien set up with high hands, they can create a steep path at different pitch heights. This setup allows them to drop their barrel easily and rely on changing posture to adjust to locations. How they do it, though, is where their swings differ. Julien uses more aggressive movements to get to different pitch heights, while Freeman shifts his shoulder plane and avoids more drastic body adjustments. His chicken-wing style is a bit more handsy and less reliant on changing his eye level, and as a result, he has excellent plate coverage. His contact rates on pitches at the top, bottom, and outer thirds of the zone outpace Julien by about eight percentage points in each location.
Two other factors, which are not publicly available, also likely contribute to Freeman’s superior plate coverage: Horizontal Bat Angle (HBA), the horizontal angle of the bat at impact, and bat speed. Freeman, who we’ve already established has a steep VBA on average, appears to be better at altering his swing speeds when necessary, which lets him manipulate his bat angle to cover pitches throughout the zone. You can see this in the third video above, on the changeup breaking down and away from him.
Freeman’s approach also helps him produce against lefties (career 120 wRC+), which is something he has improved upon as he has gotten older (139 wRC+ over the last three seasons). Meanwhile, Julien’s daddy-hack approach sometimes limits his ability to alter his swing speeds and angles, which can often lead to poorly timed swings or mishits and explains why he is prone to hitting groundballs (50.2% last year) despite his steep swing. These issues are more apparent when he faces lefties (22 wRC+, 80% groundball rate), though as Davy pointed out in his Julien piece, he has made only 48 plate appearances against lefties in the big leagues — an incredibly small sample size.
That brings us to the next hitter, Tim Anderson. Even with his steep 39.5-degree VBA, Anderson had a groundball rate above 60% last year. A batter’s contact point has to be extremely deep to pull that off. Here are some swings from him to illustrate that:
Most hitters would struggle to put the ball in play after letting it travel this deep, but TA’s steep barrel and feel for contact in the zone allowed him to pound the ball into the ground over and over and over again last season. The sweeping breaking ball from Rich Hill is the exact type of pitch Anderson would have elevated in years past. Typically, having a steep bat path against an opposite-handed breaking ball is a perfect recipe for an ideal launch angle distribution, but if you’re making deep contact, this is all you can get out of the swing.
Chas McCormick was the anti-Anderson last season, when he mostly refused to hit the ball on the ground against opposite-handed pitching. He can do this because of how he marries his steep, 38.2-degree VBA with ideal contact points. In 2023, he had a 25.6 GB% against left-handed pitchers. That was the third lowest in baseball behind Jorge Soler and Mookie Betts. Unsurprisingly, by wRC+, they were three of the six most productive right-handed hitters against lefties last year. Here are a few swings from McCormick vs. lefties that show his ability to elevate no matter the zone or pitch:
Even on the well-executed curveball from MacKenzie Gore, McCormick’s barrel was on an upward slope at contact because he connected with the pitch out in front of the zone. This is the type of pitch that Anderson would have pounded into the ground despite the similar steepness at contact, because he would’ve let the pitch get deeper before swinging.
McCormick’s closed stride puts him in a great position to elevate any pitch in the middle of the plate, even if it makes it more difficult for him to square up inside pitches in the top half of the zone. That said, as you can see in the video of his swing against Cole Ragans, he can still get to up-and-in pitches when he holds his posture. The main takeaway is that no matter the zone, his barrel is working on an upward slope through contact, which allows him to do more damage.
Although their swings are similarly steep, these four hitters have different swing types that generate different results. VBA is a great tool to use, but it only tells one part of the story.
Gary A. Vasquez-USA TODAY Sports
I imagine that everybody here at FanGraphs generates ideas for articles in different ways. Looking at leaderboards is certainly a common method. You click around, sorting by different stats until someone looks out of place. “How did you get all the way up here?” is what the start of a FanGraphs article sounds like. Sometimes ideas take longer to germinate, and sometimes there are twists and turns along the way.
For a while now, I’ve been noticing that Freddie Freeman always seems to pop up near the top of Baseball Savant’s foul ball leaderboard. He finished second to Ozzie Albies in 2023 and second to Bo Bichette in 2022. In 2021, he finished third behind both Bichette and Albies. He finished third again in 2020 and first in 2019, 2018, and 2016. Freeman is one of the best hitters in the game, and since 2016, he has 4,225 foul balls, over 400 more than Francisco Lindor in second place. The names below them are good too: José Abreu, José Ramírez, Marcus Semien, Paul Goldschmidt. You get the picture. That brought me to my first question:
A few articles ago, I was engaging in one of my favorite pastimes: making up the names of non-existent statistics. What can I say? I got into writing because I like lining words up in funny ways. I got into baseball writing because I love baseball. But when the two things I like line up, then we’re really cooking with gas.
The fake statistic in question? Whomps per whiff. You can grasp what it is right away: how often you absolutely whomp the ball, as compared to how often your swing results in nothing but a tiny gust of air and perhaps an emphatic umpire reaction. Is this a predictive statistic? I have no idea whatsoever, but I thought I’d try to see who’s good at it.
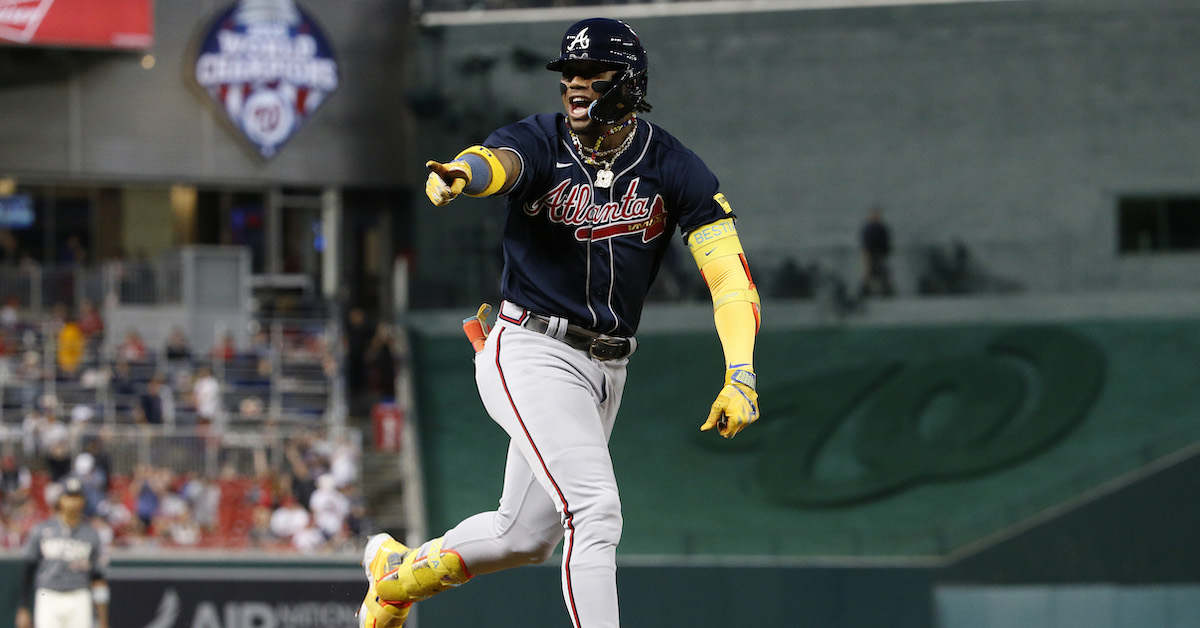
The good news: The good players are good. I defined a whomp as a barrel, a whiff as a whiff, and then limited it to players who saw at least 500 pitches in 2023. The best in baseball at it? Ronald Acuña Jr., who just put up an all-time offensive season. Neat! Second best? Mookie Betts, who finished second in MVP voting behind Acuña. Maybe we’re on to something here. Here’s the top 10 by that metric:
One thing that I love about this statistic is that it isn’t secretly ranking players based on their plate discipline. Betts doesn’t swing much, so he doesn’t whiff much. Seager is aggressive but selectively so. Luis Arraez is 12th. Lars Nootbaar is 13th. Those two are polar opposites who nonetheless are both good hitters. Read the rest of this entry »
Peter Aiken-USA TODAY Sports
I thought that today’s article was going to be an easy one to write. Reading Alex Chamberlain’s post on the pulled fly ball revolution made me imagine the worst pitch a pitcher could throw: a sinker that ended up high and inside, an easy-to-contact fastball in the area of the plate that leads to the most damaging types of opposing batted balls. Then I extrapolated my idea out a little bit. Maybe I could look up the pitchers who throw their sinkers high in the zone most often. We could all laugh about how they’re called “sinkers” — so that’s clearly a bad place to throw them. Maybe we would gawk at a table of a few pitchers who do this bad thing, and then we could move on with life.
Well, I can do at least one thing. Here’s a table of the pitchers who threw elevated sinkers in or around the strike zone most frequently in 2023: