Archive for Research

Parsing a Pile of Confusing Data About Sliders

What’s the most important characteristic of a slider? Let me show you a table:

Slider Value by Location, 2020-21
Attack Zone Run Value RV/100 Pitches
Heart -138.9 -0.7
Shadow -785.0 -2.5
Chase 163.8 0.8
Waste 465.2 4.5

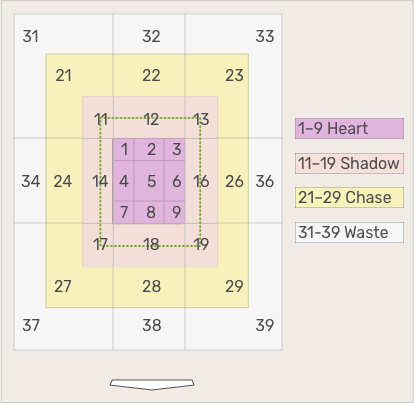
There are two things that might need explaining in here. The attack zones are Baseball Savant’s way of cutting the strike zone up into granular pieces, and I think they’re neat. They look like so:

Run values are from the batter’s perspective, so that -785 runs in the shadow zone means that batters have been 785 runs below average — what they’ve done on all pitches across the whole year — when they faced sliders in the shadow zone. In other words, sliders on the corners of the plate have been excellent — not really a shock.

What’s the most important characteristic of a slider, then? Well, allow me to show you a different table:

Slider Value by Speed, 2020-21
Velocity (mph) Run Value RV/100
87+ -149.3 -0.8
85-87 -80.6 -0.4
82-85 -43.8 -0.2
<82 37.2 0.2

Read the rest of this entry »


Let’s Take Another Stab at Unpacking the Rising Strikeout Rate

If you are a regular FanGraphs reader, chances are that you’re aware of the rise in strikeouts across the majors. At this point, bemoaning the rise in strikeouts is an essential component of the baseball media apparatus. Every season is accompanied by pieces on the subject. I found this type of article going as far back as 2013, and they have been especially prevalent in recent seasons. It seems to be a rite of passage to put out a piece on the increasing strikeout rate, so as a newly minted member of the baseball writing community, here is my entry in the genre.

For context, the league-wide strikeout rate has increased every season since 2005, when it sat at 16.4%. In 2021, that figure has risen to 24.1%. That is a 47% increase in 16 seasons. Not only has the strikeout percentage monotonically increased, but the rate at which it is increasing is growing. From 2005-09, the rate increased by 9.7%; from 2010-14, 10.3%. In the most recent five seasons, the strikeout rate increased by 11.6%.

The question is always who and what is driving this phenomenon, and the answer is almost always “well, there are a few factors at play.” One angle that I thought has been under-researched is hitter behavior with two strikes. You may have heard your favorite local newspaper columnist bemoan the idea that hitters do not have a two-strike approach anymore, that all they try to do is hit home runs, which has led to all the strikeouts. Of course, this type of thinking is reductive, mostly because it does not even consider the role of the pitcher. Nevertheless, many have discussed two-strike results, though more anecdotally than quantitatively. So let’s investigate this aspect of the strikeout rate problem first. The following is the strikeout rate and wOBA in plate appearances that reach two-strike counts in the Statcast era:

Two Strike Performance
Season K% wOBA
2015 40.4 .240
2016 .41.1 .243
2017 41.5 .247
2018 42.2 .241
2019 42.8 .247
2020 43.2 .245
2021 44.6 .229
SOURCE: Baseball Savant

Like the overall strikeout rate, the strikeout rate in these plate appearances is monotonically increasing but much more slowly. Year-over-year, the increase never exceeds 2% besides this season and 2020 (about 3%). I will note we are only about a month and a half into the season and given the weather, league offense is at its nadir, so I would expect this to regress some. wOBA with two strikes has jumped in the Statcast era and this season so far has stuck out like a sore thumb. The weather caveat applies here also, as does the caveat that we are dealing with only a fraction of the plate appearances in 2021 versus all other seasons besides 2020 (for obvious reasons). This information seemingly debunks the awful two strike approach theory, at least within the defined time frame. Hitters are barely striking out more when they get to two strikes and their overall performance has not changed much season-over-season, 2021 notwithstanding. If we dig further into two strike behavior, the idea that hitters have drastically changed when they are confronted with two strikes does not track:

Two Strike Behavior
Season SwStr% CS% Swing% Chase% BBE%
2015 13.1 4.4 59 45.8 23.8
2016 13.3 4.4 58.8 44.7 23.2
2017 13.5 4.4 58.5 43.6 22.8
2018 13.8 4.5 58.6 43.1 22.6
2019 14 4.4 58.4 43.5 22
2020 14.1 4.6 57.5 42.8 21.8
2021 14.4 5.1 58 42.1 21.6
SOURCE: Baseball Savant

I will note that the chase rate calculation is based on my own filtering of the Statcast data from Baseball Savant. The swinging strike rate has increased every season and the rate at which balls are put in play with two strikes has decreased every year, which gives some credence to the complaint about hitter behavior. I would argue the changes are so small, however, that drastic claims about today’s players are not warranted. We are talking about 1.3 percentage points in terms of swinging strike rate, and 2.2 percentage points in balls in play rate from 2015-21. I do not think anyone without access to this kind of statistical information can really tell the difference between those figures when watching the game. The swing rate with two strikes has been very stable in this era. In terms of chase rate, batters have become more discerning, which can only be construed as a positive development, assuming we believe it’s better to have fewer strikeouts.

Interestingly, the rate of called strikes as a percentage of total two-strike pitches has seen a noticeable jump in 2021. Devan Fink wrote about how pitchers have become more aggressive throwing the ball in the zone this season with the advent of the new ball. I would imagine this is the impetus for the growth in the percentage of strikeouts via the called strike.

Overall, the differences in two-strike performances between seasons do not seem substantial enough to explain the acceleration of the strikeout rate growth. Maybe it is not batter performance in two strike counts, but instead a notably higher percentage of total pitches being thrown with two strikes?

Percentage of Pitches in Each Count
Season 0-0 0-1 0-2 1-0 1-1 1-2 2-0 2-1 2-2 3-0 3-1 3-2
2015-20 25.8 12.8 6.5 10.1 10.2 9.5 3.5 5.3 8.1 1.1 2.2 4.9
2021 25.5 12.5 6.7 10.2 10 9.5 3.5 5.3 8.3 1.2 2.3 4.9
SOURCE: Baseball Savant

There is basically no difference between 2021 and the preceding five seasons combined. The count-based run values are more of a mixed bag with no discernible trend.

Run Values by Count
Season 0-0 0-1 0-2 1-0 1-1 1-2 2-0 2-1 2-2 3-0 3-1 3-2
2015-2020 0.009 0.008 0.018 0.008 0.001 0.016 0.025 0.002 0.003 -0.009 -0.008 0.013
2020 0.024 -0.079 -0.067 0.176 0.047 0.142 0.357 0.002 0.056 -0.15 -0.121 -0.098
SOURCE: Baseball Savant
Run Values per 100 Pitches Thrown

Two strike performance changes does not seem notable in recent vintage. In fact, the swinging strike rates in all counts have effectively increased at the same rate across all counts.

The last thing I investigated was looking at pitch types and seeing if any groups of pitches are more responsible for the rate of whiffs than the others. Here there are more interesting trends.

Neither breaking pitches nor offspeed pitches have seen much of an influx in swinging strikes. Hitters have struggled more with fastballs, on the other hand, in all situations. (Another hat tip to Devan Fink, who wrote about the unusually large increase in fastball velocity in the month of April this season.) Pitchers’ fastballs are becoming tougher to time-up and now that they are becoming more aggressive throwing the ball in the zone, they are inducing more swinging strikes with those pitches.

The league’s two-strike approach does not seem to be having an outsized effect on the rise in strikeouts, at least in this most recent era of baseball. There are small upticks in a few relevant metrics, but more of the increase has to do with swings and misses in all counts, especially on fastballs. This count-based analysis yielded similar results to an excellent piece from Chet Gutwein here at FanGraphs. He found that not only has the league’s swinging strike rate on fastballs increased more relative to other pitch types, but fastballs high in the zone were mostly to blame due to the continuing growth of velocity and, as a consequence, spin rate.

As the league tries to address the issue of fewer balls in play now and in the future, finding a way to combat the rise in pitcher velocity should be one of the first items on the docket. The fact that pitches are moving more than ever does not appear to be as large a factor, given the changes in whiff rates on breaking and offspeed pitches. Moving the mound back, which will be implemented in the Atlantic League this season, and giving hitters more time to react seems like a good start. After parsing through the two strike data, it seems like rectifying the lack of formidable two strike approaches across the majors is not the silver bullet many believe. Digging further into the data by pitch type in all counts, the main issue is rising whiff rates on fastballs, which Chet Gutwein opined on in his own piece I referenced above. So maybe combating velocity is the elusive silver bullet? Without a relatively controlled experiment we cannot say for certain. But we can say that hitters being criticized for forgoing any semblance of a two strike approach and placing the blame on them for the rise in strikeouts is most likely a futile exercise.


First-Batter Walks: The Sequel

Last week, I investigated something that I’ve long wondered about: are relievers particularly prone to wildness on their first batter of the game? I didn’t find much of an effect, and I also got tons of valuable feedback about further avenues for investigation. Do base/out states matter? Does handedness matter? Do intentional walks skew the data?

Aside from the last one (a definite yes), I haven’t explored all of these avenues yet. I did, however, answer another question I was curious about, one that ties into the general theme of reliever walk rates. I’ll tell you upfront that I found a confusing result, and that I’d love to hear anything I’ve missed or avenues for further investigation.

Here’s the question I’m answering: when a reliever walks the first batter he faces, what does that tell us about the rest of his appearance? All of us have seen this in practice, and we probably all know the existential dread it engenders. Great, he doesn’t have his command today. How many walks are coming up? Is the lead safe? Will the team even stay in the game long enough for a new pitcher comes in?

To explore this possibility, I examined every game thrown by a reliever since the beginning of the 2015 season. I split each reliever’s appearances into two subsets: every appearance where they unintentionally walked the first batter they faced on one hand, and every other appearance (except intentional walks, I threw those out) on the other. This gave me a sample of 1,085 relievers across more than 80,000 appearances. Read the rest of this entry »


The Cutter: A Platoon Neutral Offering?

Pitchers are always looking to chip away at the platoon advantage. Two of the most common weapons in doing so are the changeup and curveball. The former fades away from opposite-side batters and from the barrel as the bat whips through the zone. Most of a curveball’s movement, meanwhile, is vertical; no matter the handedness of the batter and corresponding bat path, the pitch can duck under the bat as the batter makes contact. Sliders, though, generally have a large platoon split, to the detriment of the pitcher, as they move more horizontally relative to vertically and toward the pitcher’s glove side. This leads the ball towards the barrel of an opposite-handed hitter, giving him more of an opportunity to make contact.

Cutters are interesting in this regard. Given the movement of the pitch, you would expect it to have significant platoon splits like a slider. The ball moves toward a pitcher’s glove side, albeit generally not as far as a slider; an opposite-handed hitter would have a better chance putting the barrel on it. But this is not the case, according to research from Max Marchi done back in 2010, as he found that cutters were in the middle of the pack with respect to pitch-type platoon splits. It still had more favorable splits when the batter had the platoon advantage, but that is the case for all pitches in general.

So why does the cutter not have much of an effect on the platoon advantage despite its break? As MLB.com explains it, the magnitude of the horizontal break is subtle enough to catch a hitter expecting a four-seamer off guard. Thus, when he swings, the movement of the pitch forces the batter to fight it off his hands and either induces weak contact or breaks the bat altogether. My thesis was that players are turning to the cutter because of these neutral platoon splits, as heavily using a pitch that works well to hitters from both sides makes you harder to predict. Read the rest of this entry »


These Aren’t the Hits MLB Wanted

There have been some scary moments in the first few weeks of the 2021 major league season. On April 28, Phillies Manager Joe Girardi was ejected after both Didi Gregorius and Bryce Harper were hit by pitches while they were playing the Cardinals. Harper’s incident was particularly scary as he was hit in the face with a 97 mph fastball. On April 5, Cubs catcher Willson Contreras was plunked by a 93 mph fastball to the helmet. Two days later Reds rookie Jonathan India had a similar moment after a fastball ricocheted off his helmet.

It’s not your imagination: batters are being hit by wayward pitches at a record clip. Ken Rosenthal of The Athletic made note of the trend this morning. Baseball Prospectus’ Rob Mains recently published an excellent breakdown of this year’s record-setting pace for hit batsmen. I was particularly taken aback by this chart showing that prior to 2018, no season in baseball history had a hit batsman in more than 1 in 103 plate appearances:

Mains continues:

There was one batter hit per 96 plate appearances in 2018, a new record. It fell further, to 94, in 2019. Then all the way to 81 in last year’s short, weird season.

This year? Through Tuesday night’s games, it’s down to 74.5. Batters are being hit thirty-eight percent more frequently than in 1901. There are just over eight hit batters for every five just a decade ago. We’re averaging 0.997 hit batters per game in 2021, a single HBP shy of one per game—a level the sport’s never approached. Batters so far have a .309 on-base percentage. Hit batters account for thirteen points of that figure. Ten years ago, there were only eight points of hit batters in MLB’s .321 OBP.

I wanted to take a look at possible reasons the HBP rate is at record levels so far in 2021, but first we need to be clear about which parts of this trend are continuations from previous seasons and which parts are actually new. In 2019, Devan Fink demonstrated that the HBP rate per plate appearance was approaching the highest levels seen since the early 1900s. He looked at increased velocity and reliever usage to demonstrate that while a pitches’ speed didn’t necessarily mean a pitcher had worse command, relievers had a larger share of HBP than their starting counterparts. Read the rest of this entry »


Are Relievers Wilder Upon Entry?

On Wednesday afternoon, Liam Hendriks entered a tough situation. There were two outs in the bottom of the ninth, but his margin for error was nonexistent. The bases were loaded, and the White Sox were locked in a tie game. One hiccup in command, four slightly misplaced pitches, and the game would be over.

Do pitchers have less command when they enter? Is it worth worrying about whether a pitcher might not have it that day? I have no earthly idea, so I decided to investigate. First things first, though: I wasn’t actually sure what I was investigating. Time for some experimental design.

What about the walk rate, but only on the first batter faced by a new reliever? That’s certainly a number I could look up. That checks in at 8.1% from 2015 to present (I used the Statcast era even though there’s no Statcast data involved in this query, just for consistency’s sake). Over the same time frame, the overall reliever walk rate is 9.3%. Case closed, let’s go get brunch.

Only, that’s a bad comparison. We’re not comparing apples to apples. If we’re actually going to look into whether pitchers are particularly likely to come in and not have it, we need to compare like to like. Take the immortal Sugar Ray Marimon, who made 16 appearances for the Braves in 2015. He was a one-hit wonder, though “wonder” might be strong: he compiled a 7.36 ERA in 25.2 innings before decamping to Korea. Read the rest of this entry »


Where Did the Homers Go?

On Monday, I examined the new baseball’s impact on April home run totals. In sum, home runs were down in April 2021 compared to April 2019, with the home run per batted ball rate dropping by roughly 0.45 percentage points, a figure that would result in about an 8% decrease in home runs from ’19 to ’21, under the assumption that hitters receive roughly equal plate appearances in each season. (Due to seven-inning doubleheaders and the new extra inning rules, though, that won’t happen, but it’s still good to compare apples-to-apples to estimate the impact.)

After sharing the article on Twitter, I received an interesting question that I felt merited further discussion: How many of those now-non-homers turn into hits versus outs? That is a fascinating question because it potentially gets to the heart of why MLB dejuiced the baseballs in the first place. Baseball didn’t want to eliminate offense, per se; they just wanted to alter how it is generated, with more balls put into play rather than what they perceived as a recent over-reliance on the long ball. In short, if all of those newly-created non-homers are now other types of hits, then dejuicing the baseball might’ve actually had the impact MLB wanted. If they are now outs, then it’s just going to make life that much harder for batters.

Given the majors’ historically-low batting average this season — once again, I’ll point you to Brendan Gawlowski’s excellent piece on the matter — you can likely guess what happened: Outs are up. Read the rest of this entry »


The Dodgers Might Have a Shifting Strategy of Their Own

Last week, I wrote about the Padres and how their usage of the infield shift stands out. To recap: They shift almost exclusively against left-handed hitters to great success, neglecting right-handed ones in the process. This decision is backed up by public research, which casts doubt on the efficacy of shifts against righties.

As a few of the comments noted, though, the Padres aren’t the most interesting subject when it comes to shifts. If anything, they’re conformists! The Dodgers and Rays, in contrast, are the rebels who defy convention by shifting more against righties than against lefties. We still don’t have a clear answer as to why. Leading up to this article, I did take a crack at the problem, and in the process, unearthed something about the Dodgers.

Before that, some context: Much of our discourse regarding the shift is focused on the dynamic between the hitter and team shifting against him. Kole Calhoun has a tendency to pull the ball, so the Dodgers have prepared this alignment. If Calhoun could go the other way, he’d earn himself a free knock, and so on.

But what about a version of the dynamic that includes the pitcher? By the same logic applied to hitters, if a pitcher could alter his approach to induce pulled grounders that are tailor-made for infield shifts, he’d probably be successful. We know pitchers can control the types of batted balls they allow to some extent: Last season, our Alex Chamberlain wrote about the relationship between pitch location and launch angle. As it turns out, a lower pitch will yield a lower launch angle compared to one located higher up, irrespective of pitch type.

Read the rest of this entry »


Home Runs Were Down in April, but by How Much?

Seemingly in the blink of an eye, a month of baseball is behind us. With nearly 30,000 plate appearances taken and more than 18,000 batted balls put into play, a month of data is plenty to begin examining league-wide trends and to make some predictions for the rest of 2021.

One big question going into this season — and a topic already examined here by both Ben Clemens and Justin Choi — was what the impact of the new baseball would be on the overall offensive environment. As both Ben and Justin found and detailed, the new baseball is bouncier, yielding higher exit velocities than in years past, and also possesses more drag, as it is not traveling as far. I want to focus on that second point. If the ball isn’t traveling as far, we should be seeing fewer home runs hit in 2021 — and we are. But can we pinpoint just how many home runs will be hit this season? That takes a bit more guesswork, but before getting into that, let’s first see how April 2021 stacks up to prior seasons, as well as identify where exactly we lost those home runs.

Home Runs in April
Year HR BBE HR/BBE%
2015 592 17559 3.37%
2016 740 18498 4.00%
2017 863 19301 4.47%
2018 912 21706 4.20%
2019 1144 22111 5.17%
2021 873 18509 4.72%
Includes data from all games played on or before April 30 in each year.

Read the rest of this entry »


Does Throwing a Pitch More Alter Its Effectiveness?

Pitchers are relying on their best pitches more and more. And why should they not? It makes all the sense in the world. Throwing a fastball 60% of the time just so that you can “establish it” is an outdated moniker that players and teams alike are reticent to follow. Take a look at the our season stat grid tool if you want proof that the most dominant pitchers in the league are increasingly relying on their breaking pitches. Select curveballs and you will see Julio Urías, Zack Greinke, Brandon Woodruff, Anthony DeSclafani, Dylan Bundy, Walker Buehler, Corbin Burnes, and John Means toward the top of the list. For sliders, that list features Tyler Glasnow, Lance McCullers Jr. (who is also throwing a new slider), Shane Bieber, a new and improved Jeff Hoffman, Freddy Peralta, and even Clayton Kershaw, whose slider is almost 45% of his pitch diet.

These are cherrypicked examples; not every pitcher on this leaderboard has been as productive as those starters thus far. But it does point to the idea that the best pitchers MLB has to offer are increasingly leaning into their best secondary offerings and have either continued to be successful or found another level in their production.

The idea of simply throwing your best pitch has become more in vogue in recent years. Back in 2017, Eno Sarris wrote that pitchers should try making breaking balls 80% of their total pitch mix. Part of the reason is that non-fastball pitches, specifically breaking balls, have gotten increasingly harder to hit; Ben Clemens wrote about this trend a couple of years ago. Even though fastballs have become harder to hit by virtue of increased velocity, pitchers are turning away from them in favor of other offerings.

This decision raises the question: Are pitchers successful with their non-fastball pitches because they use them less? The idea is that the main driver of offspeed or breaking ball success would be that hitters see them less, making them tougher to adjust to in a plate appearance. Theoretically, then, if a pitcher goes primarily to his secondary pitches, those pitches will become less effective on a per pitch basis. Is this true?

To investigate, I took every pitch type that was thrown at least 100 times in a season from 2018 through ’20. I took the year-over-year changes in pitch usage, swinging-strike rate, and run value per 100 pitches thrown for each season pair (where in both seasons the pitch was thrown on 100-plus occasions).

The first thing I wanted to look at was effectiveness based on changes in usage for each individual pitch type. The short answer to this is that there is little relationship between marginal usage change and marginal success in either of the two measures for any pitch type.

If anything, changeups and curveballs actually induce swinging strikes as a higher percentage of all pitches with more usage. That is the strongest relationship in this dataset, and it still consists mostly of noise. Based on the data, there is no evidence that pitchers should be dissuaded from throwing their best pitches more often, and that holds true for breaking balls, offspeed pitches, and fastballs.

Sure, you may argue, throwing any pitch a little more won’t have adverse effects on its effectiveness, but aren’t there diminishing returns? At a certain point, don’t you throw the pitch too often to fool the batter? To answer that, I placed each pitcher and pitch type pair into a bucket based on usage, then separated the bucket into increments of 10% (so the first consisted of pitches thrown between 0 and 10% of the time, the second 10% and 20%, etc.). I then grouped the pitch usages across the three seasons and looked for any potential deviations in effectiveness.

Again, these relationships are mostly noise. Even for pitches thrown upwards of 70% to 80% of the time (beyond which the the data is scarce), they should not lose any per-pitch potency by virtue of increased predictability.

For those of you skeptical that fastballs make up the majority of pitches and that this lack of a relationship may not be evident with breaking balls or offspeed pitches specifically, I have bad news for you:

As with run values, there’s no strong relationship between swinging-strike rate and usage.

As noted above, fastball usage is on the decline throughout the league. But using the data I collected from ’18 through ’20, it’s clear that pitchers aren’t all now throwing breaking pitches all the time.

The vertical lines represent the 50th percentile in that specific distribution. On average, pitchers using a certain breaking ball less than 30% of the time shied away from using the pitch more. On the other hand, breaking ball usage mostly increased for players who used it more than a cursory amount. That all makes sense: If you have a breaking ball you like to use (or are comfortable using), you’re going to throw it more; if you don’t have a strong breaking pitch, then you’re not going to be tossing it all the time even if it could theoretically be more effective.

Throwing a pitch just for the sake of throwing it is not going to fly in MLB in 2021. Pitches are thrown with a purpose: generating whiffs, or at least groundballs. This is one of the fundamental factors in the ever-increasing strikeout rate: Not only are pitchers throwing harder than ever, but they are also leaning on their best stuff even more. That’s while every one of those pitches is being optimized with the help of technology to generate maximum movement and deception. And that trend will not stop until there is evidence that a pitch will perform worse upon increased usage. Barring that, pitchers across the league will rely on the pitches they deem most dominant.