The Atlanta Braves and Dallas Keuchel agreed to terms on a contract Thursday night, thus ending baseball’s short free agency burst following the conclusion of the MLB Draft. Keuchel’s one-year, $13 million deal will enable him to enter the free agent market after the 2019 season with a clean slate, without any qualifying offer compensation pick baggage to reduce his value to a new team (or offer an excuse not to sign him).
We’ve seen this short-term playbook before from the Braves before, so it’s unsurprising to see them commit to a one-year (in reality, four-month) contract for Keuchel. The offseason in Atlanta was quieter than expected, with the team — or more accurately Liberty Media, the ownership group — choosing not to try to splash cash in the direction of Manny Machado or Bryce Harper like some of the other Johnny-come-soonlys in baseball. The only significant signing the team made was a one-year deal with Josh Donaldson for $23 million.
The $13 million is $13 million straight-up, something that shouldn’t necessarily be taken for granted as these types of midseason contracts tend to be a bit strange. For example, when Roger Clemens signed a one-year contract worth $28,000,022 (the beer money at the end to match his uniform number), that figure represented what it would’ve been over an entire season; Clemens only made a little under $20 million, with the money starting to flow when he made his season debut for the Yankees in June.
The reasons the Braves signed Keuchel to a short-term contract are similar to those behind their Donaldson deal: the team has a very deep stable of prospects and doesn’t necessarily want to commit to Keuchel long-term any more than they wanted to with Donaldson.The long-term solution at third base was always Austin Riley, but with the team coming off an NL East crown and still very likely to be just as competitive in 2019, they wanted a safer short-term option. Enter Donaldson The exact pitcher for whom Keuchel is keeping a seat warm is unclear, but the Braves have enough interesting candidates that the assumption is the question will work itself out over time.
The issue for Atlanta was that that question was not working itself out as quickly as the team hoped. The Braves starters have combined for a 4.38 ERA (19th in MLB) and 3.6 WAR (also 19th) and while those numbers aren’t the worst among 2019’s contenders, the rotation clearly has not been enough of a positive asset. And obviously, this matters quite a bit, with the Braves looking up at the Phillies in the NL East by a two-game margin. Atlanta’s rotation as of this moment has more question marks than they did at the start of the season.
Kyle Wright, Sean Newcomb, Bryse Wilson, and Touki Toussaint have all had brief stints in the rotation, with all four losing those jobs quickly (the latter two after their first starts). You can make a pretty good argument that the Braves have perhaps been a bit impatient with some of these pitchers, but it’s hard to blame the team for their urgency.
Perhaps more rope would have been given if Mike Foltynewicz and Kevin Gasuman were meeting expectations.
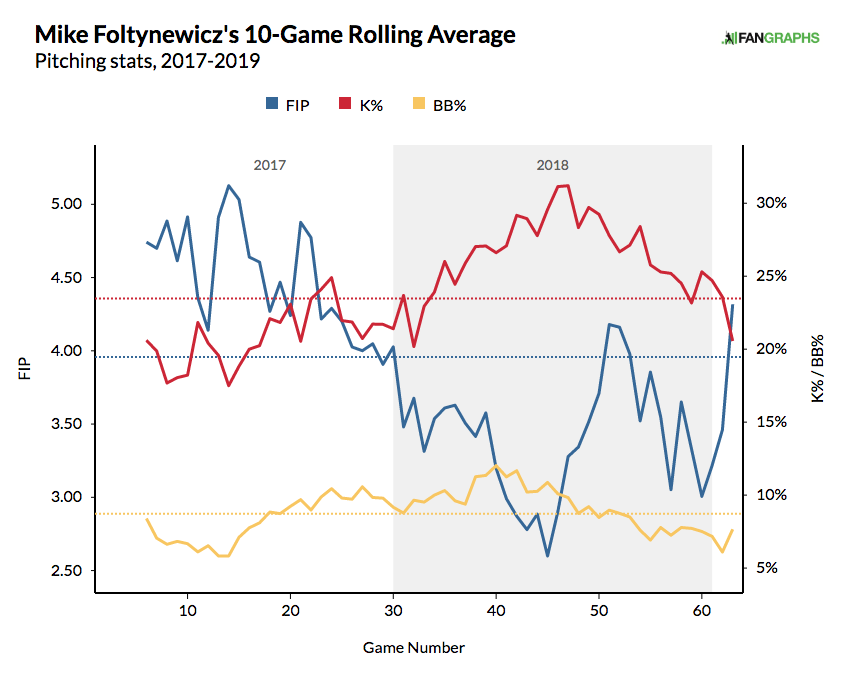
Folty’s spring was marred by elbow problems and while his health doesn’t appear to be a question, his velocity and his slider have been. His velocity has recovered, with his fastball in recent starts in the 95-96 mph range, much closer to the 96-97 mph he showed throughout 2018 than the 93-95 he initially came back with in late April. But the slider is still missing bite and that’s a crucial pitch in his repertoire. The former Astro’s breakout 2018 was mostly due to his slider, which ranked fourth in our pitch values, behind only those of Patrick Corbin, Jhoulys Chacin, and Miles Mikolas. Batters only hit .106 against his sliders last year and only mustered a .183 slugging percentage. In just over a month of pitching, he’s allowed almost as many extra-base hits on sliders (9) as he did in all of 2018 (11). And looking at his Statcast data, he’s lost three inches of vertical movement and two inches of horizontal movement from last season.
Kevin Gausman’s ERA remains above six, a disturbingly high number considering that we’re now in June. Given that his FIP is a much better 4.03, Gausman’s poor bottom-line run prevention has some mitigating factors, including a .331 BABIP and a bullpen that hasn’t had his back (58% LOB compared to 72% league-average). But as with the Braves’ lack of patience with the young pitchers hitting roadblocks, Atlanta just doesn’t have the time to hang around and hope that Gausman turns his theoretical run-prevention back into actual run-prevention. Gausman’s done himself no favors by narrowing of his repertoire; he’s essentially been a fastball/splitter-only pitcher in 2019, with his slurve largely abandoned. He’ll likely end up in the bullpen for now, which may be a better fit for a two-pitch hurler still missing his former high-end heat.
Under the set of circumstances Atlanta is facing, not only is Keuchel a good signing, but the terms make it one of the best potential buys this year. It’s still strange to call $13 million nothing, but in terms of major league free agency, these are nanoscopic potatoes. You can’t spend as much as you want on amateur free agents or draft picks. You don’t have an unlimited supply of prospects to trade for short-term gains. But you can spend all you want on free agents, with the only limitation being the luxury tax threshold, which is still a softer roadblock than the severe penalties for overspending on other avenues of talent acquisition. That’s not a problem for the Braves, who could sign James Shields to a one-year, $50 million deal and still be short of the Danger Zone. (Warning: You should probably not sign James Shields for one year and $50 million.)
Having the opportunity to sign a legitimate free agent in midseason is pretty rare, but Keuchel’s unusual market afforded the Braves the chance to add a player who might not have seemed necessary for the team in January, but who addresses an obvious need now. One remaining question, perhaps one left unanswered and lost in time: did the Braves need to wait this long to sign Keuchel? After all, given how quickly they cycled through the pitching prospects, the team certainly understood how urgent the rotation issue was. It may not have been obvious in March, but the weakness was apparent certainly by mid-April. In terms of free-agent compensation, Craig Edwards estimated that signing Keuchel would have an additional cost of $4.7 million for Atlanta, hardly a crippling loss. What part of this late signing was the draft pick value (or a more general reluctance to spend on free agents) and what part was Keuchel and his agent preferring to have more teams in the bidding such as the Yankees ($10.6 million loss), Cardinals ($7.4 million), or the Cubs ($6.8 million)? If only houseflies on walls had tape recorders, or whatever the kids are calling those today.
ZiPS has been more of a fan of Keuchel, at least in 2019, than the other projection systems, so it’s unsurprising it gave a digital thumbs-up to this signing to go along with my analog one. The penalty used for his missing time is relatively tame as there’s no injury involved, and most players out voluntarily don’t return in as brutally an inept fashion as Kendrys Morales did after ending his 2014 hiatus. That history doesn’t suggest a huge penalty is hardly surprising, as most players don’t use that time sitting around eating cookies, playing video games, and watching reruns of Press Your Luck. Even I don’t eat that many cookies working at home in a decidedly non-athletic capacity.
ZiPS projects a 116 ERA+ and 1.6 WAR for Keuchel with the assumption that he needs a few weeks to be ready to pitch in a major league game. Atlanta will take that and honestly, probably be happy with less. Because if you’re not using money to sign Keuchel, your other options for signing pitchers using just money are Shields or Yovani Gallardo or Miguel Gonzalez, and so on. Keuchel adds just a hair over a win compared to the likely other options and in the NL East, that win might actually matter.
ZiPS Projected Standings, 6/7/19 (Pre-Keuchel)
| Team |
W |
L |
GB |
PCT |
Div% |
WC% |
Playoff % |
WS Win% |
No. 1 Pick |
Avg Draft Pos. |
| Atlanta Braves |
88 |
74 |
— |
.543 |
51.1% |
21.7% |
72.8% |
4.2% |
0.0% |
21.2 |
| Washington Nationals |
85 |
77 |
3 |
.525 |
22.9% |
24.4% |
47.3% |
2.1% |
0.0% |
18.7 |
| Philadelphia Phillies |
85 |
77 |
3 |
.525 |
20.8% |
23.6% |
44.3% |
1.9% |
0.0% |
18.4 |
| New York Mets |
80 |
82 |
8 |
.494 |
5.2% |
10.1% |
15.3% |
0.5% |
0.0% |
14.9 |
| Miami Marlins |
59 |
103 |
29 |
.364 |
0.0% |
0.0% |
0.0% |
0.0% |
22.8% |
2.3 |
ZiPS Projected Standings, 6/7/19 (Post-Keuchel)
| Team |
W |
L |
GB |
PCT |
Div% |
WC% |
Playoff % |
WS Win% |
No. 1 Pick |
Avg Draft Pos. |
| Atlanta Braves |
89 |
73 |
— |
.549 |
60.1% |
20.4% |
80.6% |
5.1% |
0.0% |
22.1 |
| Washington Nationals |
85 |
77 |
4 |
.525 |
18.8% |
26.6% |
45.3% |
1.9% |
0.0% |
18.6 |
| Philadelphia Phillies |
85 |
77 |
4 |
.525 |
17.0% |
25.5% |
42.6% |
1.7% |
0.0% |
18.3 |
| New York Mets |
80 |
82 |
9 |
.494 |
4.1% |
10.2% |
14.2% |
0.5% |
0.0% |
14.8 |
| Miami Marlins |
58 |
104 |
31 |
.358 |
0.0% |
0.0% |
0.0% |
0.0% |
23.6% |
2.3 |
Is adding a Keuchel a giant, season-changing move? Of course not, but those are more or less unicorns; situations like the Giants picking up Randy Winn midseason and getting 3.6 WAR in 58 games are highly unusual. From the projections, the Braves have turned about 20% of the scenarios in which they don’t win the NL East into NL East titles, and erased about 30% of their non-playoff finishes from the timeline. Without trading prospects or developing time travel technology, the Braves made as good an acquisition as you realistically can make in June. Of course, we could have said the same thing in May.