Welcome to another edition of Five Things I Liked (Or Didn’t Like) This Week. With the first month of major league baseball in the books, I’m settling into the rhythm of the regular season. Baseball writing in the morning, baseball on TV in the afternoon, and usually baseball on TV in the evening. Every so often, I’ll skip two of those and go to the ballpark instead. The actual baseball is falling into a rhythm, too. The Dodgers have the best record in baseball, Aaron Judge is the best hitter, and Paul Skenes is the best pitcher, just like we all expected. But part of the rhythm of baseball is that the unexpected happens multiple times a day, and that’s what Five Things is for. With a nod of recognition and thanks to Zach Lowe of The Ringer for the column format, let’s start the shenanigans.
1. Stopping at Third
The math is pretty easy: A double with runners on second and third scores both runners. Sometimes it even brings home a guy standing on first at the start of the play, too. Last week, though, things got weird. First, Jacob Stallings flat out demolished a ball off the right field wall, but Hunter Goodman didn’t have the read:
Hey, that happens. There are a few plays like this in the majors every year. The batter can tear around the bases as much as he wants, but runners have to stop and make sure it’s a hit first. Goodman couldn’t be sure that the ball would hit the wall, and with no one out, he quite reasonably played it safe. Blake Dunn played the carom perfectly, and again, with nobody out, Goodman didn’t try his luck at home. Read the rest of this entry »
Welcome to another edition of Five Things I Liked (Or Didn’t Like) This Week. Normally, this column is a celebration of the extreme athleticism and talent on display across the majors. This week, though, I found myself drawn to the oddities instead. Unhittable 98-mph splinkers? Boring. Let’s talk about a pitcher who can’t strike anyone out and yet still gets results. Some of the fastest human beings on the planet stealing bases? I’d prefer some slower, larger guys getting in on the act. Brilliant, unbelievable outfield catches? I was more fascinated by a play that didn’t get made. The only thing that hasn’t changed? Mike Trout still isn’t to be trifled with. So thanks to Zach Lowe of The Ringer for his incredible idea for a sports column, and let’s get down to business.
1. In-Game Adjustments
In the 15th year of his career, Mike Trout doesn’t stand out the way he did early on. He’s no longer the fastest and strongest player every time he takes the field; he’s more “slugging corner guy” than “perennial MVP frontrunner” these days. But one thing hasn’t changed: Trout’s wonderful ability to adapt.
Landen Roupp faced the Angels last Saturday, and he leaned on his curveball. He always does, to be fair. It’s one of the best curveballs in baseball, with enormous two-plane break, and he throws it 40% of the time, more than any of his other pitches. In fact, he throws his curveball more often than any other starting pitcher. Trout had never faced Roupp before, and so he struggled to deal with the signature offering. Read the rest of this entry »
Welcome to this season’s first edition of Five Things I Liked (Or Didn’t Like) This Week. I’m never more excited to watch baseball than I am at the end of March. The winter feels endlessly long, even for me in pleasant San Francisco. Spring training doesn’t quite scratch the itch. A series in Tokyo? Eh, everyone was asleep. But then comes Opening Day, and suddenly there’s baseball everywhere. Hats at the grocery store. Announcers on television and on the radio. Crowds filling bars and stadiums, TVs broadcasting the soothing sounds of my favorite sport. I’m all fired up. You only get one opening week a year, and this one’s been excellent. So after the customary nod to Zach Lowe (now of The Ringer, congrats Zach) for the format, let’s get right to the things that made me jump out of my seat this week.
1. Mookie!
I’ll admit to being a little skeptical about how the start of Mookie Betts’s season would go. It’s not because of any doubt about his skill – at this point in his career, I think he’s earned the benefit of the doubt there. But we’re not talking about how Betts would look at full strength. In fact, the reason I was skeptical was because he’s specifically not at full strength after losing nearly 20 pounds during a bout with norovirus.
Betts doesn’t weigh a lot to begin with – he’s officially listed at 180 pounds, but he checked into spring training this year at 175, according to Dodgers announcer Joe Davis. Losing 20 pounds from there is a big deal. Betts hits for a ton of power given his stature, but reducing his body weight by more than 10% makes that an even greater challenge. When he missed the Dodgers’ two games in Tokyo and then came back to play on Opening Day while still clearly affected, I mentally marked down my expectations for him early on.
Betts still isn’t back to full strength. Per a Dodgers broadcast last week, he’s back up to 165 pounds, and still hoping to gain more weight sooner rather than later to deal with the rigors of the season. That lack of oomph shows in the batted ball data; it is, of course, very early in the season, but Betts has barreled up only a single ball, and the hardest he’s hit one all year was a mere 100.8 mph. (For context, his max exit velo last season was 109.4 mph.) His bat speed is down. It shows on Betts’s body, too; he’s always been slight, but he looks smaller this year, because he is.
One place it hasn’t showed up? His batting line. He’s hitting .300/.364/.750 to start the year, and that’s with a .188 BABIP. He has more home runs (three) than strikeouts (one). Every single one of those homers gave the Dodgers the lead. And every single one of them had juuuuuust enough power to clear the wall:
How much distance did those balls have to spare? Maybe 10 feet combined? I think we need to look into the possibility that Betts is a magical being unconstrained by the rules of reality. I don’t know how else to explain his incredible performance even as he’s so focused on recovery that he eats meals during games to try to regain muscle mass.
If you’ve followed his career, you know that Betts is prone to white-hot streaks where he hits everything out of the park. I suppose I shouldn’t be surprised. But doing it when he’s visibly weakened by illness? Doing it while playing shortstop full time? Doubt Betts at your own risk. The Dodgers are impressive in a million ways – but right now, I can’t stop watching Mookie and giggling with delight.
2. Follow the Bouncing Wall
Ever heard of a strike ‘em out, throw ‘em out single play? Jeremiah Estrada managed that trick over the weekend, and in a way I’ve never seen before:
It’s not unheard of for a pitcher to retrieve the ball after a dropped third strike. Here’s another from the first week of the season:
But that’s how they happen, with balls that bounce back toward the field of play, and bounce far enough that the catcher can’t reach them. After the ball gets behind the plate, it’s the catcher’s ball for better or worse. Unless you’re playing with the wall bumper settings turned up to maximum, that is:
The ball hit a solid railing perfectly, flush and angled back into the field of play. A fraction of an inch in any direction would have made it completely unplayable. But throw enough fastballs off the wall behind the plate, and apparently one will kick back perfectly for some pitcher fielding practice. I’ve never seen anything like it – and that feeling, that I’ve never seen anything like what just occurred, is exactly why I’m so happy to have regular-season baseball back in my life.
3. Genius Defenders and Oblivious Baserunners
If you played baseball or softball growing up, you probably have the same instincts as me: When you see a rundown, you get giddy. Maybe, like me, you even say “Ooh! Pickle!” before you even notice that you’re talking. At the youth level, turning a pickled runner into an out is anything but a sure thing, and both the defenders and the runner have a lot to say about how things go. In the big leagues, the defenders are just too good for that. Escaping a rundown is getting tougher every year, because with perfect execution by both the runner and the defense, the runner is always out.
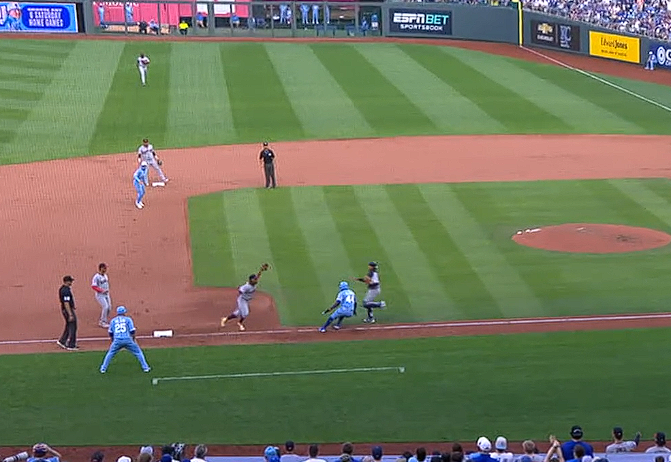
Here’s a classic one for you, a grounder to third base that hung Dairon Blanco out to dry on the basepaths:
You can quibble with having Blanco run on contact there, with no outs and Bobby Witt Jr. on deck. After the ball was in play, though, he didn’t have a lot of options. Catcher Bo Naylor came up the line aggressively and gave Blanco nowhere to hide. So Blanco went for the classic “break toward the thrower after he releases” plan; he didn’t execute it perfectly, but even if he did, it probably wouldn’t have worked. José Ramírez is fast, Hunter Gaddis and Carlos Santana were both covering home plate for reinforcements if the rundown continued, and like I said, it’s nearly impossible to escape a rundown conducted by major league fielders.
Why am I showing you this standard play? Because it wasn’t a standard play, and didn’t end there. Ramírez wasn’t just bluffing to third with that post-tag pivot:
It’s fun to watch a baseball genius at work. Ramírez made a string of great decisions on this play that equaled Kansas City’s string of bad ones. First, he took off down the third base line even before Naylor’s throw was in his glove. Blanco might be faster than him in a footrace, but he was already accelerating homeward when Blanco planted and changed direction. Rundowns are about quickness, not speed, and Ramírez is preternaturally agile.
He had the runner at second on his mind the entire time, too. You can see him waving Naylor toward him to hurry the play up. By the time he received the throw, he was already thinking about second base. Then, as he turned that way, he gave Kyle Isbel enough of a deke to freeze him on the basepaths. He even managed to re-insert himself into the rundown, though he wisely stepped aside when he saw his teammates had it under control.
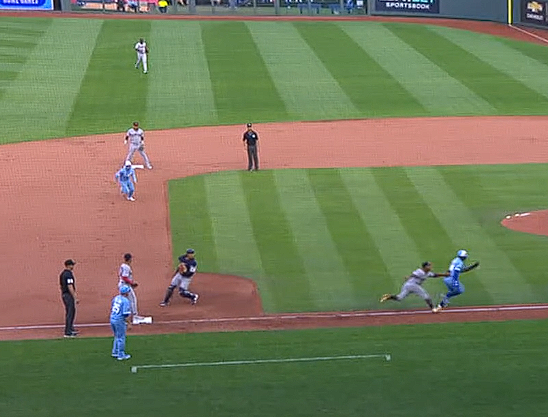
Isbel, on the other hand, didn’t cover himself with glory. On this snapshot, the play should essentially be over:
Look at how far down the line Ramírez had already gotten, with Blanco still trying to change direction. That out was as good as made, Isbel had a perfect view of it, and he was close enough to second base to get back easily. But with the ball still right near third base and a fast and accelerating player holding it, Isbel inexplicably decided to take off:
Here’s how bad that decision was: Between Isbel deciding to run and Ramírez tagging Blanco out, Isbel took exactly two steps. He was maybe 20% of the way to third when Ramírez made the tag, and Ramírez was maybe 20% of the way from third to home.
Poor Jonathan India. He seems to know his way around a rundown. While the rest of the Royals were finding ways to create outs, he played everything perfectly. He tore down the line to first. When the defense abandoned him to cover the rundown, he went partway to second. And when Isbel got caught too, India did the right thing and went all the way to the second base bag. Just to put the cherry on top, rewatch the clip of Isbel getting tagged out. India didn’t step on the bag until the tag was applied. That’s because he was trying to start a rundown of his own; if Isbel had just sprinted back to second instead of stopping, India would have retreated to first, hopefully allowing Isbel to reach third or maybe even getting out of the rundown without being tagged given how many fielders were down near home plate. It’s amazing how good baseball players are at these little things. Well, how good they usually are, at least.
4. Lunging Practice
Double plays are a frequent feature of this column, because a well-turned double play, particularly if the degree of difficulty is high, is one of the most exciting plays in baseball. It features so many people operating in unison, there are usually close plays for at least one of the outs, and acrobatic pivots at second are just visually pleasing, period. And then you’ve got the double plays that aren’t perfect but are satisfying nonetheless:
What happened here? First, Mark Vientos made a difficult pick on a short hop. Then he judged that he had enough time and threw to second:
You can tell that something is wrong with the throw even in that abbreviated clip. The angle looks wrong, and so does his arm action. Good hands, yes, but bad throw:
Luisangel Acuña made that look easier than it was, but that could have been a disaster. His glove actually clipped second base as he went down for that one. How could it not, given the short hop? The ball rattled around in his glove, and he nearly lost his footing on the base while securing it, but he made the tough catch and even kept himself in position to throw to first.
At this point in the play, doubling up Isaac Paredes was far from automatic. Acuña didn’t have the time to baby the throw; he had to rip it and hope for reasonable accuracy. And “reasonable” is about what he got:
Pete Alonso isn’t a heralded defender, but he played this ball perfectly. When he saw the flight path, he went out and attacked the catch point. Stay back, and you have an in-between hop. Paredes might even beat out the throw; it was a really close play. But Alonso cut down the distance with his stretch, and he even got a bit of momentum by pushing on the base with his right foot, making sure to keep in contact until after he’d caught the ball. I love the brace with his right hand, too; that’s a good way to make sure that a collision with the ground doesn’t jar the ball out of the glove.
Honestly, that ball should be a double play every time without the need for anything spectacular. But hey, it was the first day of the season. Everyone was still getting up to game speed. And what better way to do that than by practicing some tough catches?
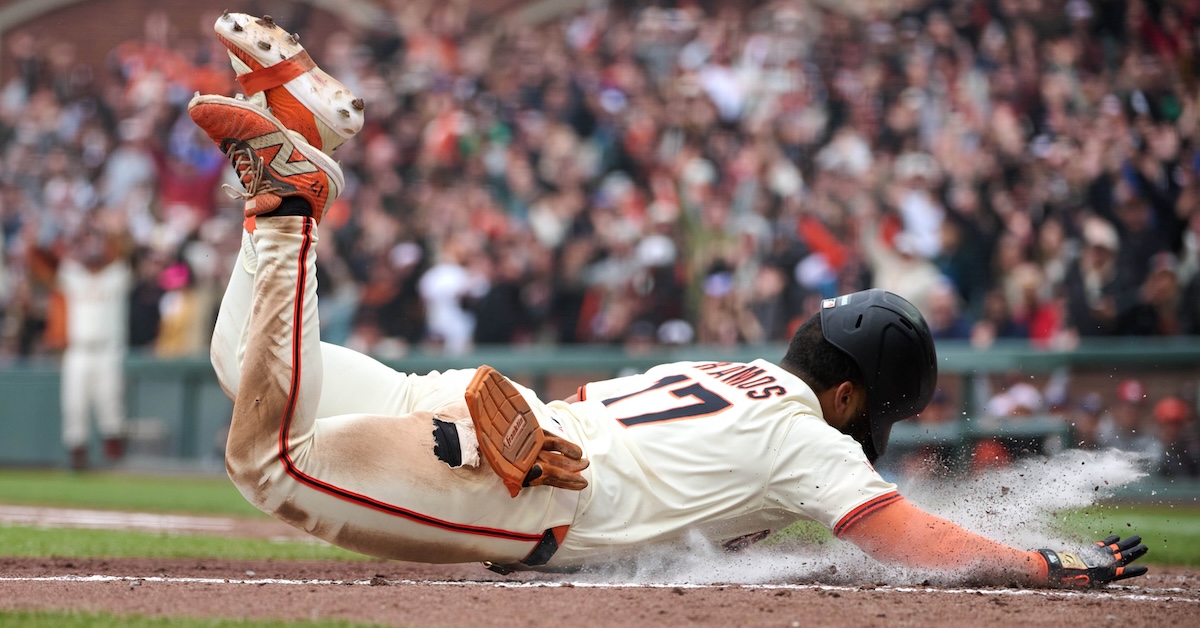
5. George Springer Still Has It
In the prime of his career, George Springer was a do-it-all outfielder in addition to being a slugger. He played 500 or so innings a year in center, spent the balance in right field, and showed off a cannon arm and fantastic instincts to go with plus speed. At 35, he’s not that kind of defender anymore. His last two seasons have been his worst defensive efforts as a major leaguer. But there’s a big difference between a diminished Springer and your regular kind of bad defender.
You can be a bad defender in many different ways. You can have bad instincts, or no speed, or a scattershot arm. But while Springer’s sprint speed is down, his heady play isn’t. How many below-average defenders can do this?
That’s not a great angle from the live broadcast, but I wanted to show it to you first so you can get an idea of how routine everything looked until the slide. Springer was playing far off the line in right when Ryan O’Hearn ripped the ball down the line, so it was a clean double off the bat. With Colton Cowser running from first, the math was pretty easy: If the ball hits the wall, Cowser scores. That’s why the broadcast cut to Cowser rounding second; he was the focus of attention at that point.
In his younger years, Springer might have gotten to that one standing up. But even missing a step or two, he has outstanding defensive instincts. He realized there was little downside and plenty of upside in trying to make a tough play, then pulled it off perfectly:
Every little thing about that is gorgeous. He was into the slide with legs extended by the time the ball hit his glove. He set his feet and lifted his body off the turf without using either hand, which let him complete the transfer from glove to throwing hand more quickly. Check out his left foot as he pivoted into the throw; his toe was pointed in the wrong direction at first, so he gave a quick jab to establish the correct position. Then he ripped the throw, off balance and falling away, hitting the cutoff man on the fly. Cowser had rounded second before Springer even started his slide, and yet the ball was back in an infielder’s hands by the time he stepped on third.
Small potatoes? Sure. He didn’t record an out or even prevent the hitter from getting to second. But keeping a runner from scoring, even with one out, has value. The O’s didn’t score in this inning, and that definitely wouldn’t have been true if Springer hadn’t made the play so seamlessly. And seriously, he was way off the line for that one. Here’s where he started the play:
The Jays like to shade Springer that way against lefties, but it’s nowhere near a straight-up right field position. Look at where he was standing against righties:
Now, did I pick that particular clip to show you that Andrés Giménez can juggle a baseball with his feet? I sure did. But you can see where Springer came into the picture, and he was maybe 20 feet closer to the line than he was against O’Hearn. My point is that it would have been easy for him to play that ball off the wall, or trap it with his momentum going the wrong way, or any number of ways that bad defenders play the ball when it’s not right at them. But Springer still has the elite defensive instincts he showed earlier in his career, and he made the kind of play that he always has. I love it. Even as he ages, you can still see what makes Springer so electric. Oh, and he’s slugging so far this year too. You love to see it.
Programming note: My chat next week will take place Tuesday at 2 p.m. Eastern, as I’ll be out on Monday. Talk to you then, I hope.
Department: Baseball Operations Employee Type: Full Time FLSA: Exempt
Primary Purpose
The Cleveland Guardians Baseball Operations department is seeking analysts who are creative, curious, and collaborative teammates who enjoy tackling unique and challenging problems. The Pro Acquisitions Department is charged with preparing for acquisition opportunities through every avenue of professional player acquisition by leading in-depth player and market analysis and synthesizing information for organizational leadership. The Pro Acquisitions Analyst will collaborate with different stakeholders to drive continuous process improvements in player evaluations and valuations, new data streams, and player recommendations.
Core Job Functions
Analysts are expected to work in a fast-paced, team environment and communicate effectively with various organizational stakeholders. The core responsibility is comprehensive player analysis to create accurate valuations, identify and fill information gaps, and synthesize information for organizational leaders. The bullets below are intended to capture major realms in which work might be focused, although the specifics might differ based on their interests, skillset, and the team’s needs.
Facilitate and conduct evidence-based player analysis in support of Pro Player Acquisitions using all available information streams.
Continually assess market conditions, team trends and acquisition opportunities across all acquisition avenues.
Build and maintain various high priority pref lists.
Communicate findings to key stakeholders in a clear, comprehensible manner.
Work collaboratively with Baseball Research & Development to uncover actionable insights across fundamental, strategic and valuation processes.
Work collaboratively with Baseball Systems to build and manage software products that directly drive our internal processes.
Facilitate and conduct analysis to support organizational strategic planning, particularly for key acquisition windows.
Provide player-specific valuations and transactional recommendations using organizational best practices and valuation frameworks.
We know that historically marginalized groups – including people of color, women, people from working class backgrounds, and people who identify as LGBTQ – are less likely to apply unless and until they meet every requirement for a job. We encourage you to reach out if you have questions about the role or your qualifications. We are happy to help you feel ready to apply!
Basic Requirements
Ability to craft and articulate a compelling message to others in both written and verbal form.
Collaborative and able to succeed in a team-oriented environment.
An ability to build and maintain relationships with a broad range of baseball operations employees, including but not limited to scouts, coaches, and front office members.
Willing to frequently work nights, weekends, and holidays—particularly during the season.
Expected relocation to Cleveland.
Preferred Experience
While we don’t expect any candidate to meet every requirement, we’re looking for either a breadth of experience or deep expertise in a particular area. We’re considering applicants with a wide variety of past experiences.
Demonstrated expertise in player analysis, valuation frameworks, and market behavior.
Working knowledge of cutting-edge, publicly available baseball research.
Demonstrated understanding of statistics and experience carrying out quantitative analysis.
Bachelor’s degree or prior professional experience.
Track record of and proficiency with relationship building in the baseball industry.
Demonstrated experience with a database language such as SQL and R.
Organizational Requirements
Reads, speaks, comprehends, and communicates English effectively in all communications.
Represents the Cleveland Guardians in a positive fashion to all business partners and the general public.
Ability to develop and maintain successful working relationships with members of the Front Office.
Ability to act according to the organizational values and service excellence at all times.
Demonstrated commitment to working with diverse populations and contributing to an inclusive working environment.
Ability to walk, sit or stand for an entire shift.
Ability to work extended days and hours, including holidays and weekends.
Ability to move throughout all areas and levels of the Ballpark.
Ability to work in a diverse and changing environment.
Occasional physical activity such as lifting and carrying boxes up to 25 lbs.
At the Cleveland Guardians, we are all about creating an inclusive environment that brings out the best in everyone. It is a big part of who we are, how we compete, and how we make an impact in our community. We want every employee to feel like they truly belong here.
We also know that people from historically underserved groups—like women and people of color—sometimes hesitate to apply for jobs unless they check every single box on the qualifications list. We’re looking for the best person for the job, and we know that you might bring skills and experiences that aren’t exactly listed but could be a huge asset to our team. So, if this role excites you, we encourage you to apply, even if you don’t meet every single qualification.
About Us
In Baseball Operations, our shared goal is to identify and develop diverse players and front office teammates who contribute to our mission. By effectively and collaboratively working together, we create a family atmosphere that supports learning as we strive for excellence in everything we do. We believe that we will achieve our goals by making evidence-based decisions and creating environments that support our people and empower them to learn.
Daphne Lemke/USA TODAY NETWORK-Wisconsin-USA TODAY NETWORK via Imagn Images
Every year, most teams hold some sort of team bonding, social event during spring training. The specifics of the event vary from team to team, but frequently they include renting out a movie theater and showing some cloying, inspirational movie like The Blind Side, Cool Runnings, Rudy, or better yet, a documentary like Free Solo. Regardless of the team’s outlook on the year, the goal is to get the players amped up for the season and ready to compete on the field, even if the competition in question is for fourth place in the division.
But what if instead of taking the clichéd route, teams actually tried to select a movie that fits their current vibe, one that’s thematically on brand with the current state of their franchise? They won’t do this because spring training is a time for hope merchants to peddle their wares, even if they’re selling snake oil to sub-.500 teams. But spring training is over. It’s time to get real. So here are my movie selections for each American League team, sorted by release date from oldest to newest.
The week leading up to Opening Day is extension season. Players want to put aside money discussions when the games start to matter, teams crave cost certainty, and everyone’s packing up from spring training with hope in their hearts; it’s a perfect setting for agreeing to deals. Amid a flurry of other activity, the Cleveland Guardians got in on the act by signing Tanner Bibee to a five-year, $48.5 million extension, with a club option for another year after that.
Let’s get straight to what you came here for, the ZiPS projections:
ZiPS Projection – Tanner Bibee
Year
W
L
ERA
G
GS
IP
H
ER
HR
BB
SO
ERA+
WAR
$
Status
2025
10
8
3.48
29
29
160.3
141
62
20
45
163
120
3.0
$0.8M
PRE
2026
10
7
3.43
28
28
154.7
137
59
19
42
154
122
2.9
$4.2M
ARB1
2027
10
7
3.50
27
27
151.7
136
59
19
40
148
119
2.8
$7.5M
ARB2
2028
9
8
3.58
27
27
146.0
132
58
18
38
139
117
2.6
$10.7M
ARB3
2029
9
7
3.59
27
27
145.3
133
58
18
38
134
116
2.5
$23.4M
FA
Those are pretty much what I expected. Through two years in the big leagues, Bibee has been a steady contributor whose best skill is good command. ZiPS projects more of the same for the next five years. That slight decline in innings you see over the course of the projection isn’t really a Bibee thing, it’s a pitcher thing. You just never know when one awkward elbow twinge will cost someone a year, and that’s reflected in declining innings totals over time.
Let’s talk about Bibee the pitcher for a moment before getting into the Guardians. He’s a product of the organization in the Shane Bieber mold, a crafty college arm who added velocity in the Cleveland system and went from fifth-round draft pick to runner-up for the 2023 AL Rookie of the Year award. That velocity doesn’t give him an unhittable fastball or anything like that. But where his fastball was a key sticking point in his pre-professional profile, now it’s just another average pitch. It sits 94-95 mph, touches the upper 90s in big spots, and has decent shape — more rise than run, but not a ton of movement overall.
That might not sound intriguing to you; after all, plenty of major leaguers have fastballs like that. But that’s the revelation here. With a boring fastball, Bibee’s other pitches all play up. He has impeccable command of spinning stuff, to the point where his pitches sometimes bleed together in our classification systems. There’s the hard one, either a cutter or sharp slider depending on who you ask, mid-80s and biting hard glove side. That’s his workhorse pitch, the one he favors in key spots and uses to set up strikeouts. There’s the sweepier version, a few miles an hour slower but with much more horizontal movement. He throws that one as a putaway pitch. Then there’s the curveball, slower still and with big north-south movement. He uses that as a change of pace, only when ahead in the count and largely fishing for strikeouts. The three combine to leave batters off balance and lunging.
That blended breaking ball complex looks a lot like Bieber, who followed a similar trajectory to the majors but then rode it even higher, to the 2020 Cy Young. Like Bieber, Bibee has a changeup to complement the bendy stuff. Bibee’s is loopy, 12 mph slower than his fastball, and most useful against lefties. His arm action disguises it enough that he can throw it to righties, too, and he’s willing to use it late in counts after batters have seen mostly fastballs and sliders.
As was the case with Bibee’s fastball, lots of major league pitchers have pitches that vaguely sound like the secondary stuff that I just described. What sets Bibee apart is his placement of those pitches. His fastball lives up in the zone. He attacks the glove-side edge with his hard slider and mixes locations haphazardly with the loopier breaking balls, alternating between placing them for called strikes and trying to pick out a corner or bounce a curveball. His changeup consistently hits the arm-side edge of the plate. He barely walked anyone in the minors, and that has carried over even against major league hitters.
You’ve seen the ZiPS median forecasts. The upside outcomes? Those will come if Bibee takes the next step with his slider by using it proactively and creatively. I keep comparing him to Bieber because we’ve seen that this exact skill set can produce ace-level seasons if everything breaks right. Maybe Bibee will top out as a three-win true-talent pitcher, but the future is unknowable, and he has the tools to break out to an even higher level than he’s already displayed.
For the Guardians, that present talent level is already mighty valuable. They just made the playoffs with Bibee as their no. 1 starter. They’re one of four contenders in the AL Central this year, again with him as their best option in the rotation. It’s a poor starting rotation, if we’re being honest, but that only makes him more important. It’s not Bibee and a bunch of similar options; it’s Bibee and then a bunch of question marks. Despite only two years in the majors, he’s a rock of stability in a sea of uncertainty.
This contract extension buys out either one or two years of free agency, depending on the club option. The value is almost exactly in line with what he’d expect to make in arbitration, plus a reasonable rate for the free agency year(s). This isn’t some outrageous bargain; it’s just two sides agreeing to tamp down volatility.
You can imagine some ways that this deal could end up making Bibee a lot more money than he otherwise would’ve received. Mainly, that’d be because of a future injury: As a fifth-round pick, Bibee never received a huge signing bonus, and he wasn’t due to hit arbitration (and bigger salaries) until 2026. That means he would’ve earned a raise pending health, but “pending health” is a scary phrase for pitchers. By signing this deal, he removed that risk. Now, there are no possible outcomes where Bibee doesn’t end up rich for life.
The Guardians, on the other hand, are getting future cost certainty. Not so much in the arbitration years – the terms of his extension roughly match what ZiPS would expect for those payouts. But let’s put it this way: The Guardians don’t sign big deals in free agency. They haven’t signed a marquee free agent on the open market in 20 years, since they added peak Kevin Millwood before the 2005 season. Those two years of free agency represent something the Guardians have no other way of obtaining – extra team control of very good players.
The Cleveland model has been remarkably successful for a long time now. It’s about constantly remaking the team even while the current version excels, finding new key players to replace the old key players while José Ramírez keeps the tempo. The Guardians deal in two currencies: talent and years. They’re adept at finding talent. Their budget and approach limit them on the years side of things.
In other words, Cleveland is always balancing competing now with competing in the future, and the limiting factor is usually how many years of good players the team has in hand. This extension addresses that directly by adding to the number of years that Bibee will be around, and adding in a way that the franchise can stomach financially. This deal won’t make the Guardians better in 2025, and it won’t even save them money in the immediate future. But now they have one more good player for at least one more year, at a price that makes sense for both sides. They’re in the business of sustainability, and this deal is perfect for their purposes.
After an impressive rookie season for the Rockies in 2023, Nolan Jones struggled mightily last year, missing roughly two and a half months due to recurring lower back woes and a left knee injury, and slipping below replacement level when he was able to play. On Saturday, the Rockies traded him back to the Guardians — the team that originally drafted and developed him — in exchange for superutilityman Tyler Freeman. It’s puzzling to see the Rockies punt a player who just a year ago appeared to be a franchise cornerstone, particularly as their acquisition of Freeman is driven by the loss of starting second baseman Thairo Estrada to a broken wrist, a short-term problem considering Colorado is unlikely to contend this season.
The 26-year-old Jones hit just .227/.321/.320 (70 wRC+) with three homers in 297 plate appearances for the Rockies last season while splitting his time between left and right field. His 67-point drop from his 137 wRC+ in 2023 tied for the second largest in the majors:
While Jones has shown that he can be a productive major leaguer, the same can’t yet be said for the 25-year-old Freeman, who hit .209/.305/.321 with seven homers in 383 PA for the Guardians last year while mainly playing center field but spotting at second base, shortstop, and third base. His 84 wRC+ was his highest mark in parts of three major league seasons, which isn’t saying much. Read the rest of this entry »
If you’re a Cleveland Guardians fan, the ritual is surely getting old at this point. The team develops an All-Star middle infielder, and times are good. Then, inevitably, that player leaves and is replaced by a new and unproven middle infielder. Can the team make it work? Tune in next season to find out.
The latest intriguing replacement is Gabriel Arias, who, like seemingly every recent Guardians hitting prospect, is a shortstop by trade. He looked like the heir apparent to the job in 2023, backing up at short before Amed Rosario’s departure. But Arias scuffled, then broke his wrist at the tail end of the season. That injury might have lingered into last year, and whatever the reason, he struggled mightily, ceding the shortstop job to Brayan Rocchio. Luckily, in Cleveland, a contributing role is only one trade away, and now that second baseman Andrés Giménez is a Blue Jay, Arias heads into 2025 as a key part of the Guardians’ infield plans.
Plenty of the particulars of Arias’ 563 major league plate appearances are ripped right out of his last prospect report. Intermittent contact issues? Yeah, he strikes out a third of the time. Potential for power? He launched 10 homers in half a season in 2023. Defensive versatility? He’s logged time at every position other than pitcher and catcher. But the relative weights of each of those features of his game matter, and so far in his career, the contact issues have dominated.
It’s possible to succeed despite a high-strikeout game, and honestly, Arias is the right kind of player to do so. Teams will tolerate a player with a bad contact rate if he hits for power and contributes with his glove. The defensive component is already there, especially because of his versatility, but the power hasn’t arrived; his career .138 ISO is the domain of contact hitters, not boom-bust guys whose muscles have muscles.
Is that going to change this year? To be clear, I don’t know. Guys like Arias flame out all the time. It’s really hard to stick around and produce in the majors when you run even a 15% swinging strike rate – and he’s up near 20%. But if things work out, it’s fairly easy to see how they would. Really, one video is all I need to show you:
If the winter is a time for dreams, the spring is a time for solutions. Your team may have been going after Juan Soto or Aaron Judge or Shohei Ohtani, depending on the offseason, but short of something going weird in free agency (like the unsigned Boras clients last year), if you don’t have them under contract at this point, they’ll be improving someone else’s club. However, that doesn’t mean that spring training is only about ramping up for the daily grind. Teams have real needs to address, and while they’re no doubt workshopping their own solutions – or possibly convincing themselves that the problem doesn’t exist, like when I wonder why my acid reflux is awful after some spicy food – that doesn’t mean that we can’t cook up some ideas in the FanGraphs test kitchen.
This is the second piece in a three-part series in which I’ll propose one way for each team to fill a roster hole or improve for future seasons. Some of my solutions are more likely to happen than others, but I tried to say away from the completely implausible ones. We’ll leave the hypothetical trades for Bobby Witt Jr. and Paul Skenes to WFAN callers. Also, I will not recommend the same fix for different teams; in real life, for example, David Robertson can help only one club’s bullpen. Today, we’ll cover the 10 teams in the Central divisions, beginning with the five in the AL Central before moving on to their counterparts in the NL Central. Each division is sorted by the current Depth Charts projected win totals.
Minnesota Twins: Take Mickey Gasper seriously
Faced with big questions at first base, the Twins made just about the least interesting move possible, signing Ty France to a cheap one-year deal. Over the last two seasons, France has put up 0.4 WAR in 1,200 plate appearances, but Minnesota seems content to run him out there in at least a timeshare with Jose Miranda. Instead, what the Twins should do is let Mickey Gasper take the majority of the playing time at first against righties, with Miranda getting the nod against lefties. Of course, the Twins probably won’t get rid of France after signing him to a guaranteed deal, but Gasper offers positional flexibility and should be on the roster anyway. In addition to first base, he also has experience at second, third and catcher. While in the minors with the Red Sox last year, Gasper posted a 165 wRC+ across 380 plate appearances, with a 179 mark over his 204 PA at Triple-A. Those numbers are more than good enough for him to deserve a chance in the majors.
Detroit Tigers: Do something weird with Javier Báez
If not for his salary, Javier Báez probably wouldn’t be guaranteed a place on this roster based on his production over the last two seasons. I think his inability to make contact is here to stay, so the Tigers are going to have to take him for what he is now instead of the player they thought they were signing three offseasons ago. At this point, he’s nothing more than a short-side platoon partner for shortstop Trey Sweeney, but if he’s going to be on the roster anyway, the Tigers might as well try some things with him. Why not get weird and give him some bullpen innings this spring? Báez has always had a strong arm, so if he’s down with the idea, maybe this is another way to justify his presence on the roster. After all, that two-way player designation is a thing now! Sure, it’s unlikely that Báez would transition into a usable relief pitcher at age 32, but the team doesn’t have much to lose here. At the very least, Detroit should give Báez reps in a super-utility role, but I like dreaming big, or at least dreaming odd. I’ve always felt spring training was the time for teams to embrace their weird impulses because it’s the only time they can truly experiment with their major league roster.
Kansas City Royals: Give Drew Waters a fair shake at a starting corner outfield job
The Royals missed an opportunity to upgrade their corner outfield positions this winter, but that doesn’t mean they should run it back with the group they had last year. Drew Waters certainly didn’t excel with a semi-regular role for a long stretch in 2023, but his wRC+ of 81 that year wasn’t much different from the 85 mark that MJ Melendez posted in 2024, and Melendez’s rough line came in three times as many plate appearances. Maybe Melendez has more offensive upside, but that isn’t enough of a reason for Kansas City to keep running him out there in left field, where he is a defensive liability. Waters is the more well-rounded player, and even if he doesn’t improve at the plate, his defensive value should make up for at least some of his lack of offense. Moreover, both players are 26, so this isn’t an age-related thing. Playing Waters in left doesn’t mean the Royals should give up on Melendez altogether; there will still be opportunities to get him plate appearances without having him wear a leather glove.
Cleveland Guardians: Stretch out a reliever for short starts
The Guardians look to have a terrific, deep, exciting bullpen, but the rotation doesn’t have that same rizz. Am I using that word right, fellow kids? I talked more about starter-reliever ambiguity with the Orioles in the first part of this series, but it’s relevant here for Cleveland, too. Triston McKenzie is no sure thing, and Shane Bieber isn’t likely returning until midseason, so another starter would be a nice thing to have. Since the Guardians don’t like to spend money, I won’t give them one of the remaining inning-eaters still available in free agency. Instead, I’ll pitch the idea of stretching out one of their relievers to start some four-inning specials. The deep bullpen gives them both the opportunity to lose someone and cover for a starter with a light workload, even by 2025 standards. Hunter Gaddis broke out in the bullpen in 2024, but he was one of their least dominant relievers in terms of punching out batters. Gaddis isn’t exactly a failed starter, because he hasn’t gotten enough run in that role, but he has refined his approach and become a better pitcher during his time in the bullpen. He’s now throwing more first-pitch strikes than he ever did in the minors. If he can keep that up, he’ll probably be the team’s best option for this starter-lite role.
Chicago White Sox: Embrace riskiness on offense
The White Sox have no hope of making a playoff run, so they have nothing to lose by taking chances with their roster. And right now, their lineup is full of veteran role players who don’t offer them much future value. Guys like Mike Tauchman, Michael A. Taylor, Austin Slater, Andrew Benintendi, and Joey Gallo won’t be around by the time this team is ready to contend again, and Chicago probably won’t be able to flip them for much at the trade deadline. So what’s the point in giving them regular playing time? Instead, the White Sox should be chasing upside right now, even if that upside comes with risk.
At this point in the offseason, the Pale Hose won’t find high-upside hitters on the free agent market, but they have plenty of them in their farm system. Really, the White Sox should be extremely aggressive with their prospects and non-prospect minor leaguers this spring, and give them as many opportunities as possible to snatch a starting spot away from the veterans. Let Chase Meidroth push Lenyn Sosa; offer Bryan Ramos every chance to knock Miguel Vargas permanently off the hot corner. Even less-heralded guys like Cal Mitchell, Andre Lipcius, or the recently outrighted Zach DeLoach have a better chance of one day contributing to a good White Sox team than Benintendi or Slater do.
Chicago Cubs: Explore a trade for Germán Márquez
ZiPS is highly optimistic about the Cubs entering 2025, but that’s largely due to a very bullish outlook on the bullpen, rather than a great deal of sunshine radiating over the pitching staff. The Cubs feel like a team that could use one more starting pitcher, with our Depth Charts having them just ahead of the Cardinals for the worst projected rotation in the NL Central, and ZiPS liking them only slightly better.
My inclination here was to effect a reunion with Marcus Stroman, but the Luis Gil injury seems to have put the kibosh on that. With that no longer an option, I’d love to see the Cubs swing a deal with the Rockies for Germán Márquez. A legitimate Cy Young contender at one point, Márquez has seen his last two seasons more or less wiped out due to elbow problems. That means there’s real risk, but as Michael Baumann wrote last week, Márquez’s velocity is back, and there’s a great deal of upside here if he’s healthy, similar to Jack Flaherty entering 2024. If there’s room for Márquez to make his hard sinker a larger part of his game, there are few better places to allow some extra grounders than in front of Nico Hoerner and Dansby Swanson.
Milwaukee Brewers: Trade with the Nats for Andrés Chaparro
The Brewers love low-key additions, and one player who fascinates me at the moment is Andrés Chaparro, a former “sorta” prospect with the Yankees and Nationals. He destroyed Triple-A pitching last year, but Washington’s additions of Nathaniel Lowe and Josh Bell complicate his path to playing time. The Brewers already had Rhys Hoskins when they signed Mark Canha this offseason, meaning it might be tough for Chaparro to make the Opening Day roster as a first baseman, but at the very least he would be an interesting Triple-A stash. ZiPS is probably overrating Chaparro in projecting him to be an adequate defender at third base, but the probabilistic location-based system that ZiPS uses for minor leaguers thought he took a big step forward last year, and this methodology frequently spots some surprisingly solid fielders. I don’t think the Nats would ask for much in return, and Milwaukee ought to be adding anyone who could at least theoretically play third base, especially now that the team appears to have soured on Tyler Black at the position.
St. Louis Cardinals: Start talking about non-Arenado trades
The Cardinals are coming off one of the quietest offseasons I ever remember from them, with nearly all their effort this winter going toward a Nolan Arenado trade that hasn’t materialized. St. Louis seems to have accepted that Arenado will be its starting third baseman come Opening Day, but that doesn’t mean the team should turn off its phone. There are other trades to make. Free agency has few treasures remaining, and I’d argue that this is a seller’s market. Only handful of teams lack a realistic shot at the postseason in 2025, and I’d argue that the Cardinals should be considered among that group, even if the playoff odds say otherwise. Put it this way: If they were truly determined to contend this year, they would’ve made more of an effort this winter to improve their roster. Sonny Gray and Brendan Donovan are players that contending clubs would probably be eager to acquire if they were available.
Cincinnati Reds: Talk megadeal with Elly De La Cruz
The Reds have basically no long-term contracts bogging down their payroll, as Hunter Greene is the only player with a guaranteed deal past 2026. They haven’t made a splash in free agency to bolster their roster of cheap talent, but instead of pocketing that money saved, they should invest it in their spectacular shortstop to make sure they can keep his utter awesomeness around for the 10-15 years. Yes, Elly De La Cruz is a Scott Boras client, and Boras clients tend not to sign extensions, but that doesn’t mean the Reds shouldn’t try to work out a deal, especially now when his free agency is a long way off.
Pittsburgh Pirates: Release Andrew McCutchen
There’s nothing wrong with saying goodbye when it’s time. It was fun to see Andrew McCutchen back in Pittsburgh and be reminded of what a wonderful player he was from 2009 to 2015, good enough that I’ll have to ponder sometime in the early 2030s whether his peak was enough to make my Hall of Fame ballot. But the decision to re-sign him for $5 million for 2025 was a terrible one because using the DH spot for a no-upside 38-year-old with no defensive value is a waste of resources. I think the Pirates are far better off using those plate appearances to give Jack Suwinski a clearer bounce-back chance or to serve as a friendly home for Henry Davis at some point this season if they haven’t already given up on him. No, the Pirates won’t actually do this, but they really should. The $5 million is gone no matter what, and the Pirates are a team that actually could make the playoffs if they had a better lineup.
Ben Lindbergh and Meg Rowley banter about whether the challenge system will inevitably pave the way for full ABS, the degrees of difficulty for two-way Travis Hunter vs. two-way Shohei Ohtani, and (very briefly) reinstating Pete Rose. Then they preview the 2025 Philadelphia Phillies (36:58) with The Athletic’s Matt Gelb, and the 2025 Cleveland Guardians (1:19:49) with The Athletic’s Zack Meisel.