Archive for Teams

Welcome to PhamGraphs

Patrick Gorski, Kamil Krzaczynski-Imagn Images,

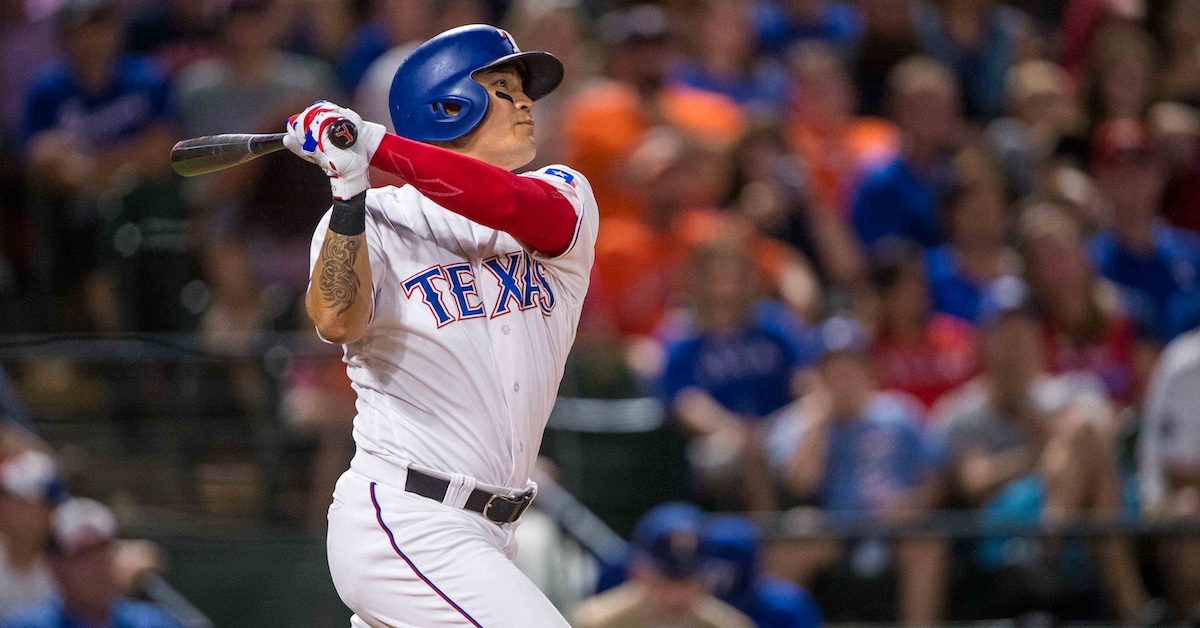
“It’s not being quantified like it should.” That’s what Tommy Pham told Will Sammon and Eno Sarris of The Athletic. Pham isn’t your stereotypical ballplayer who hates advanced stats. He’s a visionary who wants them to be even more advanced, to factor in even more context, to do an even better job of turning every tiny thing that transpires on the field into cold, hard numbers that can be credited to or debited from a ballplayer’s account. On Monday, Sammon and Sarris published an article that described Pham’s dream of a brighter sabermetric future. “I want to create a system that is going to change all that,” he said. Tommy Pham, the old school grit-and-grinder with 12 years in the majors under his belt, wants us nerds to get even nerdier, and he’s here to help. He even has a name in mind: PhamGraphs. “It’s pretty self-explanatory,” he said.

First and foremost, we here at FanGraphs want to let Tommy Pham know that we are going to sue your ass back to the stone age for trademark infringement so incredibly flattered by this charming homage. Moreover, we are here to help. We are up for the challenge. We want in. Welcome to PhamGraphs.

I can relate to Pham’s plight personally, because once upon a time, I, too, created my own FanGraphs knockoff. Specifically, I experienced a burgeoning enthusiasm for apples in the summer of 2016, so I started a spreadsheet where I’d list all the apples I ate, rate them on a scale of one to five, and write a review. The spreadsheet was titled AppleGraphs, and I figured it that if I really liked tracking my apples, I’d eventually turn it into a blog. Instead, I kept it up for a couple months and then forgot about it. I never showed it to anybody. Here’s an excerpt.

A Taste of AppleGraphs
Date Cultivar Source Grown Rating Descriptors
8/2/2016 Fuji Trader Joe’s Chile 4 Gorgeous
Notes: I took a digital art class in college. There was little in the way of instruction about improving as an artist. It seemed like the main goal was to learn how to discuss art as pretentiously as possible. When a classmate called my friend’s work cool, the professor cringed and explained that she should instead say the piece was “visually interesting.” I enjoy euphemisms as much as anybody, but that never struck me as a great bargain: surrendering immediacy and directness for the chance to sound more impressive. This is all by way of saying that the apple I ate today looked cool as hell. It was all stripy, with vertical ribbons of greens and reds like some kind of marble offering to the god of picturesque produce. It tasted pretty cool, too. It was light and refreshing, and the first slice was surprisingly sweet. For some reason I didn’t really taste that sweetness in the remainder, but big deal. The pleasure of the first bite was more than enough. Can you really ask more from an apple than one nice moment?

I wrote a total of 13 entries before it petered out (though if some venture capitalist is reading this and wants to throw a million dollars my way, I will gladly resurrect AppleGraphs as a blog or a newsletter or a zine or whatever unwieldy medium you and you blood money would prefer). You can read the whole thing here, but only if you really, really don’t have anything better to do, because, once again, it was just a spreadsheet where I described apples as a way of killing time at my desk until FanGraphs published a new article for me to read.

My extraordinarily roundabout point here is that, as someone with experience ripping off David Appelman (with apples, no less), I am determined to take Pham very seriously and answer his points as best I can, one by one. However, I want to note first that Pham’s comments revealed two overarching concerns. First, he wants the numbers to feature more context, to get into deserved performance rather than actual performance. Weighted Runs Created Plus, our flagship hitting metric, is park-adjusted and league-adjusted. The numbers are measured against the league average, which is always 100, and they’re adjusted based on the hitting environment of the park a hitter plays in. But they’re not designed to show deserved performance. They’re designed to show how well you performed relative to the league average. They don’t factor in strength of opponent or batted ball luck or a host of other factors. However, those numbers are available to Pham if he wants them. DRC+, or Deserved Runs Created Plus, is the flagship offensive metric of Baseball Prospectus. Deserved performance is what they do at BP. That may just be the site for Pham, and he may want to rethink his branding.

Actually, now that I mention it, I should probably note that Baseball Reference WAR also takes the strength of your opponent into account. The point is, Pham can keep his options open. The sabermetric community is a big tent. We’re all Pham.

That said, you have to stop somewhere. It’s impossible to factor everything in. There’s no shortage of examples. If you’re Randy Johnson and you detonate a mourning dove that divebombs into the path of your fastball, and the umpire calls the pitch a ball (which would have been the right call), should that ball really count against you? If you’re Rafael Ortega and a double falls in over your head because a territorial goose has colonized deep center field and forced you to play too shallow, should you really have your defensive metrics docked? If you’re Cody Bellinger and some room service chicken wings give you such horrendous food poisoning that you have to miss a game and bat .143 with a 24 wRC+ over the next two weeks, is that really all your fault? Shouldn’t some of the -0.2 WAR you put up over that timeframe be doled out to the chef at the hotel, to Perdue AgriBusiness, and to the chickens themselves? I could keep going all day. I’m not even done with the bird examples yet. You could keep going forever because everything’s connected. At some point, you just have to draw the line and look at what happened on the field.

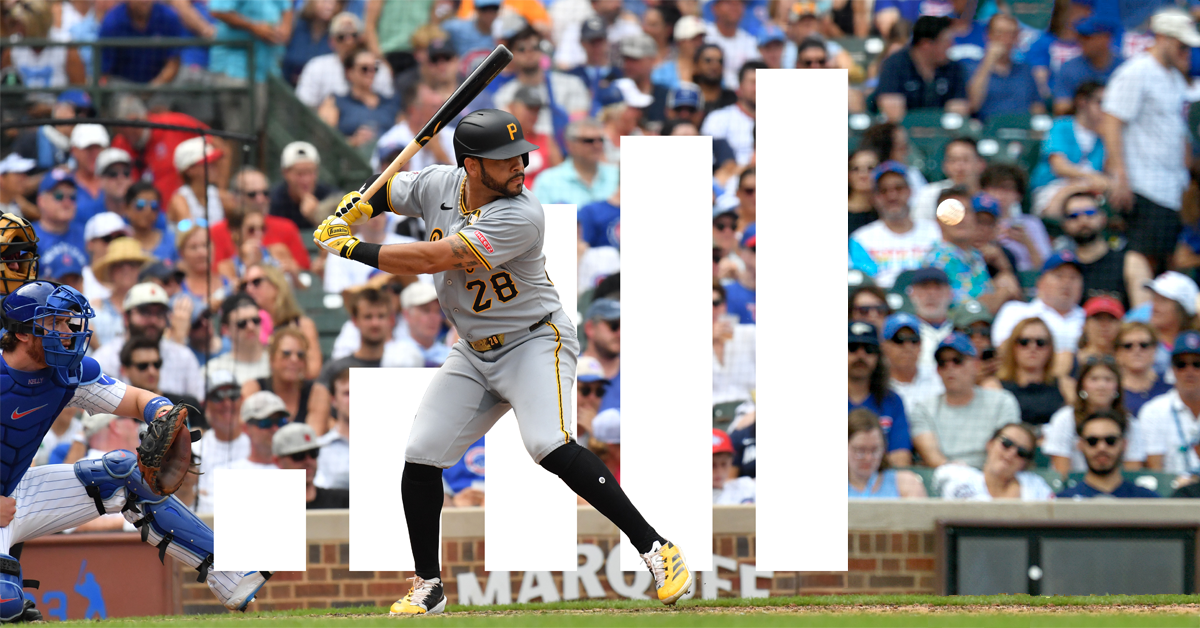
Pham’s second overarching concern was, obviously, to burnish his numbers. He’s a 37-year-old free agent who is looking for a deal. He has played for nine different teams over the last five seasons and put up a combined 0.1 WAR across the last two, and he’s been on something of a media campaign recently (and not so recently). In November, Pham revealed that he’s been playing through plantar fasciitis since the second half of 2023, but, conveniently, he’s all better now. These new comments no doubt express his true beliefs, but they also seem designed to put a positive spin on his performance in order to get himself a good deal – or as Zach Crizer put it over at The Bandwagon, “Tommy Pham has some ideas about stats that would make Tommy Pham look better.”

Now let’s get to Pham’s issues. He made two particular points. The first was that playing for a losing team, especially one that loses a lot of close games like the Pirates, means that you tend to face better pitching, because all the opponents who end up beating you have to use their high-leverage arms in order to close out their victories. The close-game qualification is an important one, and it takes some of the sting out of Pham’s argument, because bad teams end up in just as many blowouts as good teams, and the leverage is low for both teams at that point. If the Phillies are blowing your doors off, they’re not going to waste Jhoan Duran in a non-save situation. Now, the back of a good team’s bullpen is sure to be better than the back of a bad team’s, but the difference isn’t going to be quite as big.

Still, Pham is right that he’s been facing tougher arms than usual. In addition to noting all the close games the Pirates played last year, he mentioned that he switched teams twice during the 2024 season, and that those moves came at inopportune times. A series of scheduling quirks caused him to catch three straight prolonged stretches where his current team was facing off against particularly stiff competition. As a result, he believed that he faced much better pitching than most batters. (He also mentioned that he discussed this with his agent, who confirmed his hunch, and I have to admit that I’m a sucker for this line of reasoning. Anyone who has ever had an argument with a significant other has heard some version of the line, “I asked my friends, and they all think I’m right and you’re wrong.” No matter how bad the fight, it’s always at least a little bit amusing.)

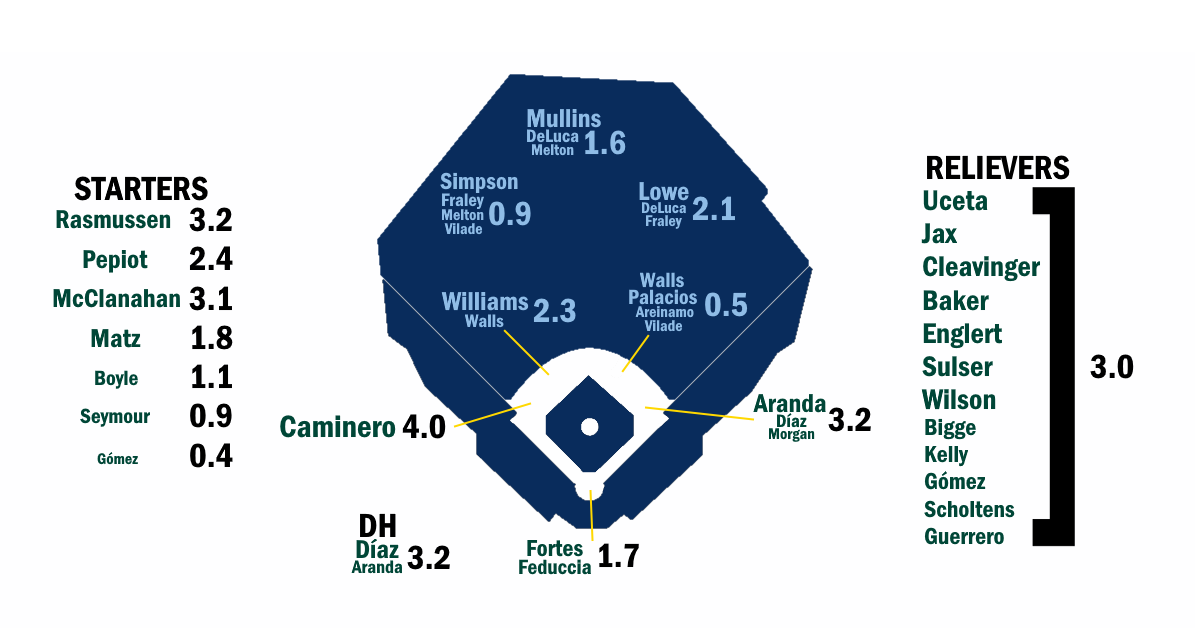
We checked this out, and when I say we, I mean David Appelman. David calculated the average ERA and FIP of the pitchers that every batter faced in both 2024 and 2025. In 2024, the pitchers Pham faced had a combined ERA of 4.02, the 19th-lowest among all batters with at least 400 plate appearances. That put him in the 90th percentile. In 2025, his opponents had a 4.17 ERA, which put him in the 75th percentile. He really has faced tough pitching over the last two years. It’s not unprecedented – somebody’s got to be in the 99th percentile every year (sorry Royce Lewis) – but it is real.

Toughest and Easiest Pitchers Faced in 2025
Rank Name ERA Rank Name ERA
1 Royce Lewis 3.84 206 Cedric Mullins 4.47
2 Chandler Simpson 3.97 207 Matt McLain 4.49
3 Jonathan Aranda 3.98 208 Jeff McNeil 4.50
4 Junior Caminero 3.98 209 Nathan Lukes 4.50
5 Yandy Díaz 4.01 210 Pete Alonso 4.50
6 Jake Mangum 4.01 211 Alec Bohm 4.52
7 Gabriel Arias 4.02 212 Gavin Lux 4.57
8 Iván Herrera 4.03 213 Brett Baty 4.58
9 Ryan Jeffers 4.05 214 Austin Hays 4.58
10 Josh Lowe 4.05 215 Carlos Narváez 4.66
Source: PhamGraphs
Minimum 400 plate appearances.

Unfortunately, Pham’s argument falls a little bit flat at this point. If you try to give him credit by regressing his performance to account for this greater degree of difficulty, you learn that the effect is much smaller than you’d expect. In 2025, Pham faced pitchers whose combined ERA was 0.08 points lower than the league average, so let’s give him credit for those extra points. There are several ways to run the numbers, but Ben Clemens showed me a quick and dirty way to do it using constants from The Book. Skip the rest of this paragraph if you don’t like math. One point of wOBA works out to roughly half a run per 600 plate appearances, and 600 plate appearances works out to roughly 141 innings. Half a run over 141 innings works out to 0.032 points of ERA. Now we have a conversion rate: one point of wOBA equals 0.032 points of ERA.

That means if we give Pham 0.08 extra points of ERA to bring him up to the league average, it only adds 2.5 points to his wOBA. That’s it. He goes from .308 to .311. Among the 215 players with at least 400 plate appearances in 2025, that takes him from the 150th-highest wOBA to the 145th.

If we use FIP rather than ERA, which Pham would presumably prefer because it’s a better indication of a pitcher’s true talent level, we’d add only 1.3 points of wOBA. (We can go even further: If we use the pitchers’ projected ERA or FIP at the time of each plate appearance according to Steamer – effectively showing how good everybody thought the pitchers were at the time – then Pham actually faced an easier slate of pitchers than the average batter!) As I mentioned earlier, DRC+ takes the strength of opponent into account, and that’s likely why it graded Pham higher than wRC+ over the last two seasons, but that bonus was just three points in 2024 (a 92 wRC+ and 95 DRC+) and four points in 2025 (a 94 wRC+ and 98 DRC+). None of this turns him into even a league-average bat. So yes, Pham faced tough pitching, but no, it doesn’t make all that much difference.

That said, I don’t want to let all these numbers get in the way of a good story. While we’re talking about all the high-leverage arms Pham has faced, we need to note that he was great in high-leverage situations. In 2025, he ran a 168 wRC+ across 40 high-leverage plate appearances, batting .355. Over the past two seasons, his 136 wRC+ in high-leverage situations puts him in the 80th percentile of all hitters (minimum 80 high-leverage plate appearances). If I were Tommy Pham, I’d be making sure that high-leverage situations were part of the conversation, too.

Pham’s second point was about how wind can play havoc with outfield defense, and here I’ll rely on an excerpt:

Pham remembers a particular play from last season that frustrated him as it related to how defensive metrics are used to value players. In a game against the Milwaukee Brewers, he was playing left field. A ball hit approximately 360 feet with a 90-mph exit velocity short-hopped the outfield wall. The wind carried it. Pham was playing in, so he couldn’t get to the ball. The play reflected poorly in his defensive numbers.

“I got docked on the ball because Statcast doesn’t factor the wind part,” Pham said. “When I learned that, I’m like, OK, if the wind’s blowing out, I need to play a little bit deeper.

“It’s a really flawed system. But it’s getting factored into our value.”

Before we get into the play in question, let’s start with the part where Pham says that he didn’t learn until age 37 that he should probably play a bit deeper when the wind is blowing out really hard. That seems – how do I put this respectfully? – unlikely to be true. Surely, this sabermetric visionary had, you know, thought about what the wind does before the year 2025. Pham makes a valid point about how defensive metrics have so far been unable to account for wind, but the example he uses to illustrate it is, by his own account, just a story about how he was positioned poorly.

Some of the details are off, but I was able to find the play in question. I understand why Pham has it stuck in his mind. It cost the Pirates a game. It was a line drive double from Caleb Durbin on May 25. It left the bat at 97.1 mph, traveled 371 feet, got over Pham’s head, and short-hopped the wall. The Pirates were leading 5-3 in the top of the eighth, and because the tying run was on second base, Pham was playing a bit shallower than usual. In 2025, the average left fielder at PNC Park played 301 feet deep, and Pham averaged 295. On this play, he was at 293 feet. He was making sure that he’d be able to hold the runner at third if Durbin singled. For that reason, I’m not so sure that he would’ve been playing deeper even if he had factored in the wind. The double scored two runs, tying the game at five, and Durbin scored the game’s deciding run when the next batter also doubled to Pham in left field.

Pham was right that the wind aided the ball a bit. Over the course of the 2025 season, 12 balls were pulled at the same launch angle and exit velocity off the same pitch type, and they traveled an average of 353 feet. This ball went an extra 17 feet. Still, his argument has several problems. The first is that Statcast only gave this ball a catch probability of 30% to begin with, thanks to the wall penalty. It graded out as a four-star play, which means that it was so difficult that it barely hurt Pham’s numbers. Second, at this stage of his career, Pham doesn’t make four-star catches anyway. His numbers going back on the ball have been bad for years now. He’s 37 and not that guy anymore (unless his plantar fasciitis really is gone forever). In fact, less than a week earlier, Elly De La Cruz hit a nearly identical ball to Pham in left field. Durbin’s ball required Pham to travel 79 feet over 4.7 seconds. De La Cruz hit his harder, but it required Pham to travel 78 feet over 4.7 seconds, and it landed in pretty much the exact same spot. On both balls, Pham had a chance to make the catch but decided to slow down — especially on De La Cruz’s — rather than risk injury by crashing into the wall.

Third, it’s also important to note that the Statcast numbers here, at least to some extent, factored in the wind already. Those catch probability numbers aren’t perfect, but this is exactly the kind of batted ball where they work well. Pham isn’t getting graded based on the launch angle and exit velocity; he’s getting graded on the hang time and the distance he had to travel. Statcast is accounting for those extra 17 feet in its grading system, and then it is knocking off some of the difficulty because the ball landed near the wall. It’s not taking off a couple extra percentage points because the wind made the ball move unexpectedly, and Pham is right that in a perfect world he would get credit for that. However, this is pretty tame in terms of wind effects. The ball didn’t change direction because of a sudden gust, and it didn’t move unpredictably due to swirling conditions. It just had a tailwind that allowed it to get on top of him. Maybe we’ll get there one day, but right now, it’s hard to imagine any system detailed enough that it could put a specific number of catch probability percentage points on just how much harder the tailwind made this play, let alone do so accurately enough to be worthwhile.

To return to the most important point, why wasn’t Pham taking the wind into account already? He got docked because he didn’t catch the ball, but he did not get docked (at least not by Statcast) for his positioning. In fact, because he started out so far from where the ball landed, Statcast gave him more leeway, reducing the catch probability, and thus the hit to his OAA. Other systems like DRP and DRS factor in positioning, and they may well have docked him for playing too shallow here. Or, maybe the opposite is true; maybe they would’ve recognized that he was playing shallow in order to hold the runner at third on a base hit, and would’ve considered his positioning to be correct even though it didn’t work out. If that were the case, perhaps they wouldn’t have held it against him either. There’s always more context to take into account, even when there are no birds in sight.

I should also note that Pham once again came close to touching on something that would have made him look great. Did you know that our splits tools allow you to check how a player performs based on the wind conditions? We can’t split out outfield defense, but it turns out that Pham is actually a great hitter when it’s windy. Over the course of his career, we have him credited with making 164 plate appearances when the wind is blowing at least 18 mph. In those plate appearances, he’s batted .354 with a 197 wRC+. Our database shows 513 players who have at least 60 plate appearances in those conditions. Pham’s 197 wRC+ ranks eighth, just a couple of spots behind Aaron Judge and Juan Soto. Yet again, Pham is doing the right thing by bringing wind into the conversation.

Before I leave you, I want to mention that, although I’ve made plenty of jokes and taken a critical eye to the issues he raised, I think Pham has the exact right attitude here. Like every player, he’s run into some bad luck at times. And, like every player, he’s also faced some good luck. Here’s a popup that turned into a double only because Pham had the good fortune to hit it to Teoscar Hernández:

Pham doesn’t sitting around thinking about all the times he got lucky, and for good reason. He plays the game at the highest level, where failure lurks around every corner. Nine years ago, right around the time I started the now-legendary AppleGraphs, I was playing in a pickup baseball league in Queens and saved this quote from Grégor Blanco. Coincidentally, it too appeared in an article by Eno Sarris:

“These things are going to happen. You go up and you go down. When you go down, you need to realize that it happens. Don’t let frustration get you. Try to simplify the game. Take some pitches, start seeing the ball again. Build that confidence again. You need to start seeing it inside yourself. ‘I got a walk! That’s good. I hit the ball hard.’ Sometimes in a streak, you hit the ball hard right at someone, and you think, ‘What do I have to do?’ Instead, say, ‘Yeah, that’s what I want. I hit the ball hard.’”

I saved it because, even in this silly adult league, I found it useful to trick myself into staying positive. When I hit a bloop single or reached on an error, I’d tell myself, ‘Great job, you got on base.’ When I lined out, I’d tell myself, ‘Great job, you hit the ball hard.’ In other words, I found a way to take something positive out of nearly every at-bat.

Pham has a tattoo that reads “Believe in Yourself” on his left arm, just below the spot where his sleeve ends. I’d be remiss if I didn’t point out that it was a huge missed opportunity for him not to spell it ‘Yourselph,’ but I’m sure the location was no accident. I’m sure the tattoo is right there so that Pham can look down to remind himself of that whenever he feels the slightest bit of doubt creep in. If he wants to create his own statistics in order to help him follow the instructions on his arm, then we here at FanGraphs and PhamGraphs are happy to do our part.


Michael Lorenzen and the Rockies Get What They Want From Each Other

Jay Biggerstaff-Imagn Images

Every free agent signing is a trade. For that matter, every job everywhere is a transaction. The employer agrees to give you money and maybe even health insurance. You agree to give them your work. You’re trading something they want in exchange for something you want (or at least something you need in order to not die). But we don’t tend to think about things this way. Everybody has to work, so everybody just gets the best job they can. For ballplayers who have reached free agency, that generally means maximizing earnings. That’s what Michael Lorenzen did on Wednesday, when ESPN’s Jeff Passan reported that the muscular right-hander agreed to a one-year, $8 million deal with the Rockies (with a $9 million club option for 2027). Still, this deal is notable for the starkness of the wants on either side and the concessions they made to get them. Lorenzen wants to be a starting pitcher. That’s all he’s ever wanted. The Rockies want a starting pitcher who is willing to ply his trade under two adverse circumstances: in Colorado and for the Rockies.

In 2015, toward the end of a rookie season in which he put up a 5.45 ERA and 5.48 FIP, the Reds relegated Lorenzen to the bullpen. During six subsequent seasons in Cincinnati, Lorenzen wasn’t shy about the fact that he wanted to go back to starting and often appeared in line to get that chance, but underperformance and injuries – a UCL sprain, a teres major strain, a shoulder strain, even a bout of mono – pushed him into relief roles (and the occasional appearance as an outfielder). He started just five more games in his final six seasons with the Reds. Although he ended on a down note, he ran a 3.65 ERA and 3.92 FIP over those six seasons. He’d earned the chance to pitch where he wanted on his own terms, and he did just that. Lorenzen signed with the Angels, then the Tigers, then the Rangers, then the Royals, and now with the Rockies, all on one-year deals (usually incentive-laden ones), and all with the publicly-acknowledged understanding that he would be given the chance to start.

Making that part clear up front was important because no matter how well he pitched, it was all too easy for people to put together a table that showed his splits as a starter and a reliever. You’d rather have the second guy, right? The one whose strikeout rate is within shouting distance of the league average and who possesses some ability to keep the ball in the yard?

The Splits Michael Lorenzen Can’t Escape
Role K% HR/9 ERA FIP wOBA
Starter 18.8 1.26 4.27 4.71 .325
Reliever 21.1 0.86 3.75 3.93 .295

But Lorenzen persisted. He’s 34 now, and he made the most of his seven-pitch starter’s arsenal. Over the past four years, he made 93 starts for six different teams. And he pitched fine! He ran a combined ERA- of 99 and FIP- of 110. He was an average pitcher, a desirable enough arm that playoff-bound teams traded for him at the deadline in two of the past three seasons. In 2023, he threw a no-hitter. In 2024, thanks to good fortune in the form of a low BABIP and high strand rate, he ran a 3.31 ERA. In 2025, he wasn’t so fortunate, running a 4.64 ERA that matched his 4.59 FIP. Over the past three years, he’s been right around the top 50 in terms of games started and innings pitched. Nevertheless, when things got real, when the season wound down, when Lorenzen found himself in the playoffs, he also found himself back in the bullpen. He won’t have to worry about that in Colorado.

Lorenzen has found the toughest pitching environment in baseball, but he’s also found a situation where league-average numbers would put him in rarefied air. In 2025, Colorado’s starting pitchers ran a 6.65 ERA. That’s the worst mark ever. And when I say ever, I mean ever. It’s the highest starting pitching ERA in AL/NL history. Fourth place belongs to the 1899 Spiders. (Although the 2025 bullpen didn’t set a record, Colorado does own the highest combined bullpen ERA of any franchise at 4.81.) RosterResource pegs Lorenzen as the Rockies’ no. 2 starter, behind lefty Kyle Freeland and ahead of Chase Dollander, Tanner Gordon, and Ryan Feltner. Freeland was the only one of the four incumbents with an ERA below 6.00 or a FIP below 5.00.

But this is a new era. Lorenzen will be the first major leaguer to sign with the Rockies in the Paul DePodesta era. He will also be the team’s first investment in starting pitching of any substance at all since 2015, when they signed Kyle Kendrick for $5.5 million. Somehow, Lorenzen is only the fifth starting pitcher to sign a deal with the Rockies in the past seven years. I went through Colorado’s RosterResource free agent tracker to check. The tracker goes back to 2020, and the four starters I found put up a combined -0.1 WAR with the Rockies. They won a combined 11 games. Chad Kuhl ran the best ERA. It was 5.72.

Rockies Starting Pitcher Free Agent Signings
Year Player Salary ERA FIP WAR
2021 Chi Chi González $1.1M 6.46 5.37 0.3
2022 Chad Kuhl $3M 5.72 5.27 0.4
2023 José Ureña $3.5M 9.82 10.95 -0.8
2024 Dakota Hudson $1.5M 6.17 5.53 0.0

It’s scary to think about how many homers Lorenzen could give up in the thin Denver air, but he’d have to crash spectacularly hard in order be anything less than a significant upgrade for this rotation. Everybody gets what they want here, and all it took to get it was a couple extra millions on one side and a willingness to pitch on a mountain on the other. The Rockies get to take their first step on the long road to reputability, and they get to sign their first decent starting pitcher in years. Lorenzen gets his money – almost certainly more money than he would have gotten anywhere else – and he gets what must have been his last chance to remain a starting pitcher. If he defies the odds and pitches well, maybe he can keep the streak going and sign a similar deal next year.


2026 ZiPS Projections: Los Angeles Angels

For the 22nd consecutive season, the ZiPS projection system is unleashing a full set of prognostications. For more information on the ZiPS projections, please consult this year’s introduction, as well as MLB’s glossary entry. The team order is selected by lot, and the next team up is the Los Angeles Angels.

Batters

Zach Neto is really good. That is all. Let’s just move on with our lives.

[…]

[…]

OK, before I get the “Dan.” message in our company Slack, I’ll regretfully talk more about the Angels. They weren’t the worst team in baseball in 2025, nor will they be in 2026, but I think they’ve become the least interesting team in baseball. At this point, they’re a bit like when you hear for the first time about some TV show on the Hallmark or Roku Channel starring someone you vaguely recall from 1998 and find out that not only the TV show exists, but that it’s been on for a decade and there are like 110 episodes. The White Sox and Rockies have won a lot fewer games than the Angels in recent years, but being terrible is, on some level, interesting. The Angels were a mediocre team with peak Mike Trout and peak Shohei Ohtani, so it’s perhaps not surprising that with Trout in steep decline, and Ohtani gone, they’re having trouble getting into contention.

ZiPS is as optimistic about Neto as Steamer is, and he’s likely the best player on the team now. Trout did finally have a full, healthy-adjacent season in 2025, but he did so mostly as a designated hitter, with the lowest wRC+ of his career (120). He turns 35 in August, and I am increasingly pessimistic about whether there are any vintage Trout seasons left in the tank

Elsewhere, ZiPS struggles to see upside. Catcher would be among the most plausible places to see some improved performance, but the Apostrophe Boyz, Logan O’Hoppe and Travis d’Arnaud, were both absolutely dreadful last year, and this projection already represents a pretty sizable bounce back. Nolan Schanuel makes good contact, but a first baseman that doesn’t hit for much power or maintain high batting averages is going to struggle to have much value.

The Angels have designated hitters playing both corners. One, Jorge Soler, looks very much like he’s approaching the end. The other, Jo Adell, erupted for 37 home runs, which was nice, but it was one of the lowest impact near-40-homer seasons in history because he didn’t do much else all that well. Vaughn Grissom and Christian Moore rank very highly in the projected WAR rankings for the Angels, but that is more a reflection of the quality of their teammates rather than an indication that they’re due for a breakout performance.

One player who does violate this theme is Nelson Rada. A lot will come down to just how well his defense plays in center field long term, and he has little power, but he did perform quite well in the high minors for a player still in his teens. ZiPS actually thinks he may very well be the team’s best option in center right now.

The Angels will be a below-average offense, but probably not the worst in the league.

Pitchers

The rotation is, at least according to ZiPS, a step up from the lineup, with the important caveat if healthy. Yusei Kikuchi, José Soriano, and Reid Detmers — who is the returning to the rotation in 2026 — are all acceptable starters, even if none remotely screams “ace.” Grayson Rodriguez was just the kind of pickup the Angels should be making, and still has all sorts of upside remaining. Some combination of Alek Manoah, Caden Dana, and Sam Aldegheri is likely fine for the last spot in the rotation. The problem is what happens if (read: when) injuries hit. George Klassen throws really hard, and his control might just be just good enough to allow him to have a career, but once you get past Klassen, you quickly get to a recent retiree (Kyle Hendricks), a guy with an ERA near seven in more than 100 innings (Jack Kochanowicz), and a pitcher I forgot still played baseball (Dakota Hudson). The starting five could be adequate, but there’s a massive amount of downside behind them.

The bullpen looks very ordinary, but there are some sources of upside: Robert Stephenson and Ben Joyce can both be quite effective, but they come with serious injury concerns. Drew Pomeranz was highly effective for the Cubs last season, but he also has a significant injury history that cannot be ignored. Kirby Yates is nearing 40 and wasn’t particularly good last year, but ZiPS legitimately likes Brock Burke. This all averages out to, well, an average bullpen, but with some good dice rolls, there’s a pretty decent ceiling here, more than anywhere else on the team. Alas, the bullpen rocking will be most relevant in the last week of July.

Right now, the Angels look like a 70- to 75-win team with a rather unimpressive ceiling. I’ve done enough projections to be well aware of the pitfalls of projecting the future, so the team spiking an 86-win season and sneaking a wild card spot isn’t out of the realm of possibility. It does seem out of the realm of likely, though I don’t think that’s an actual expression.

Ballpark graphic courtesy Eephus League. Depth charts constructed by way of those listed here. Size of player names is very roughly proportional to Depth Chart playing time. The final team projections may differ considerably from our Depth Chart playing time.

Batters – Standard
Player B Age PO PA AB R H 2B 3B HR RBI BB SO SB CS
Zach Neto R 25 SS 592 528 85 136 31 1 25 82 41 142 23 8
Mike Trout R 34 DH 464 388 62 91 15 1 21 60 67 142 2 0
Vaughn Grissom R 25 2B 468 423 61 106 20 1 10 48 34 87 8 2
Nelson Rada L 20 CF 596 519 66 128 17 2 3 52 53 139 30 12
Yoán Moncada B 31 3B 339 301 40 72 16 1 12 42 33 91 1 0
Christian Moore R 23 2B 476 426 54 97 15 5 11 52 43 150 8 3
Logan O’Hoppe R 26 C 443 405 45 95 12 1 19 53 31 123 2 2
Nolan Schanuel L 24 1B 572 495 67 129 23 1 12 58 61 79 5 1
Donovan Walton L 32 2B 427 383 49 91 16 1 7 42 32 67 3 3
Jo Adell R 27 CF 518 472 60 110 21 1 27 84 35 139 7 4
Kyren Paris R 24 CF 402 355 52 73 14 3 11 45 37 138 19 4
Travis d’Arnaud R 37 C 259 237 25 51 13 1 8 29 16 73 0 0
Bryce Teodosio R 27 CF 379 346 40 76 13 4 4 35 20 122 18 4
Gustavo Campero B 28 RF 345 305 44 76 16 3 8 45 24 62 15 3
Oswald Peraza R 26 3B 400 366 45 78 12 0 10 37 27 103 14 3
Denzer Guzman R 22 SS 569 514 56 113 24 2 13 62 44 171 8 3
J.D. Davis R 33 3B 336 302 35 68 13 1 10 35 28 109 3 1
Jorge Soler R 34 RF 422 370 50 83 18 0 18 52 44 117 0 0
Luis Rengifo B 29 2B 481 444 49 111 17 3 9 48 30 85 10 5
Niko Kavadas L 27 1B 510 438 53 88 18 1 18 63 58 191 1 1
Ben Gobbel R 26 3B 455 422 50 98 20 1 12 56 21 117 6 3
Josh Crouch R 27 C 291 268 27 56 12 0 7 33 17 92 0 1
LaMonte Wade Jr. L 32 1B 356 298 40 66 11 1 9 32 48 82 1 0
Anthony Rendon R 36 3B 195 168 19 39 8 0 2 15 20 30 3 0
Cavan Biggio L 31 2B 349 298 44 63 13 1 6 31 38 98 3 2
Adrian Placencia B 23 2B 519 456 55 88 14 3 13 53 49 186 5 5
Carter Kieboom R 28 DH 380 348 40 87 13 1 7 40 27 88 5 1
Chad Wallach R 34 C 267 242 24 49 9 1 7 29 19 84 0 1
Yolmer Sánchez B 34 2B 428 372 40 74 13 2 4 31 45 119 5 2
Zach Humphreys R 28 C 265 235 26 48 11 0 3 22 23 66 6 1
Myles Emmerson R 28 C 278 254 24 51 11 1 3 22 19 83 1 1
Tim Anderson R 33 2B 343 324 33 79 10 1 2 22 14 85 7 2
Travis Blankenhorn L 29 LF 389 353 38 71 16 1 13 48 28 115 1 1
Chris Taylor R 35 LF 302 267 34 57 13 1 6 27 26 101 6 2
Peter Burns L 26 C 118 104 10 19 2 0 1 12 11 26 1 1
Rio Foster R 23 LF 375 332 39 71 17 2 7 43 33 118 5 2
Caleb Pendleton R 24 1B 94 91 7 16 2 0 2 8 3 42 1 0
Juan Flores R 20 C 385 353 37 69 13 0 7 40 14 118 1 1
Omar Martinez L 24 C 432 386 44 75 11 1 12 45 41 143 1 1
Brandon Drury R 33 DH 368 333 38 73 17 1 9 40 27 87 1 1
Tucker Flint L 25 RF 494 435 55 88 19 2 12 54 47 186 10 3
Joe Redfield L 24 LF 210 186 17 38 8 2 1 17 11 60 4 3
Matthew Lugo R 25 CF 480 450 54 101 23 4 12 55 23 149 8 5
Oscar Colás L 27 RF 458 423 45 93 16 2 12 50 29 127 4 3
Matt Coutney L 26 1B 469 424 43 92 19 2 11 52 33 152 2 1
Capri Ortiz B 21 SS 440 401 47 85 12 3 4 39 25 119 16 6
David Calabrese L 23 LF 441 399 41 76 13 1 9 42 32 125 8 5
Ryan Nicholson L 25 1B 508 452 49 95 19 1 13 55 44 148 1 1
Evan Edwards L 29 DH 282 251 19 48 6 2 6 27 23 105 4 0
Kevin Maitan R 26 1B 260 241 22 50 10 1 3 25 14 103 0 1
Sebastián Rivero R 27 C 283 262 22 52 12 1 4 27 12 65 1 1
Sonny DiChiara R 26 DH 308 272 23 51 10 0 7 32 28 116 0 0
Mitchell Daly R 25 3B 305 275 25 47 7 1 3 19 21 113 2 1
Arol Vera B 23 2B 425 390 36 78 14 1 5 35 22 120 3 2
Cole Fontenelle B 24 3B 395 356 37 64 9 3 7 39 25 174 9 6
David Mershon B 23 SS 351 308 29 55 12 2 1 22 37 103 13 3
Anthony Scull L 22 CF 515 475 54 103 17 1 10 57 22 136 6 6
Korey Holland R 26 LF 335 314 27 64 15 2 6 30 17 135 7 2
Alexander Ramirez R 23 LF 308 288 36 53 9 1 8 33 15 157 6 4
Caleb Ketchup R 24 LF 412 373 52 68 10 3 6 33 33 148 18 4
Alberto Rios R 24 C 214 191 16 30 4 1 2 15 13 65 2 1
Mac McCroskey R 26 2B 293 263 24 45 6 2 1 17 19 101 5 4
Dario Laverde L 21 DH 411 383 31 77 12 2 4 35 20 112 1 0
Randy De Jesus R 21 RF 492 453 42 85 15 1 14 55 29 191 2 3

Batters – Advanced
Player PA BA OBP SLG OPS+ ISO BABIP Def WAR wOBA 3YOPS+ RC
Zach Neto 592 .258 .331 .462 118 .204 .307 -1 3.8 .341 119 89
Mike Trout 464 .235 .353 .441 120 .206 .311 0 1.8 .343 111 61
Vaughn Grissom 468 .251 .316 .374 91 .123 .294 -2 1.2 .304 92 52
Nelson Rada 596 .247 .326 .304 78 .057 .332 3 1.1 .287 80 62
Yoán Moncada 339 .239 .322 .419 104 .180 .303 -3 1.1 .322 99 41
Christian Moore 476 .228 .301 .364 84 .136 .325 2 1.0 .292 89 50
Logan O’Hoppe 443 .235 .296 .410 94 .175 .289 -7 1.0 .307 96 50
Nolan Schanuel 572 .261 .350 .384 105 .123 .290 -3 1.0 .325 105 68
Donovan Walton 427 .238 .304 .339 79 .102 .272 4 0.8 .285 76 41
Jo Adell 518 .233 .297 .453 105 .220 .271 -13 0.7 .322 105 67
Kyren Paris 402 .206 .290 .355 79 .149 .301 0 0.7 .286 84 42
Travis d’Arnaud 259 .215 .278 .380 81 .165 .276 1 0.7 .287 74 25
Bryce Teodosio 379 .220 .274 .315 64 .095 .327 8 0.6 .261 68 35
Gustavo Campero 345 .249 .327 .400 101 .151 .289 -3 0.6 .319 100 44
Oswald Peraza 400 .213 .278 .328 68 .115 .269 6 0.6 .269 71 37
Denzer Guzman 569 .220 .288 .350 77 .130 .303 -4 0.5 .282 83 55
J.D. Davis 336 .225 .298 .374 86 .149 .317 -1 0.5 .295 82 35
Jorge Soler 422 .224 .313 .419 101 .195 .277 -6 0.3 .318 93 49
Luis Rengifo 481 .250 .302 .363 84 .113 .291 -5 0.3 .292 84 53
Niko Kavadas 510 .201 .308 .370 88 .169 .306 2 0.3 .301 89 51
Ben Gobbel 455 .232 .283 .370 80 .138 .294 -2 0.2 .286 82 47
Josh Crouch 291 .209 .268 .332 66 .123 .290 1 0.2 .266 66 24
LaMonte Wade Jr. 356 .221 .336 .356 93 .135 .275 -2 0.2 .309 89 36
Anthony Rendon 195 .232 .323 .315 79 .083 .272 -2 0.1 .289 78 18
Cavan Biggio 349 .211 .317 .322 79 .111 .294 -4 0.1 .290 75 32
Adrian Placencia 519 .193 .278 .322 67 .129 .292 3 0.0 .268 72 44
Carter Kieboom 380 .250 .308 .353 84 .103 .316 0 -0.1 .291 83 39
Chad Wallach 267 .202 .267 .335 66 .133 .278 -2 -0.1 .266 63 22
Yolmer Sánchez 428 .199 .292 .277 60 .078 .281 3 -0.1 .260 54 32
Zach Humphreys 265 .204 .279 .289 59 .085 .271 -1 -0.1 .257 59 21
Myles Emmerson 278 .201 .261 .287 53 .086 .286 2 -0.2 .246 54 20
Tim Anderson 343 .244 .281 .299 62 .055 .325 2 -0.2 .258 59 29
Travis Blankenhorn 389 .201 .271 .363 74 .162 .258 3 -0.2 .277 75 35
Chris Taylor 302 .213 .296 .337 76 .124 .319 0 -0.3 .281 73 29
Peter Burns 118 .183 .280 .231 45 .048 .234 -1 -0.3 .241 47 7
Rio Foster 375 .214 .301 .340 79 .127 .309 -2 -0.4 .287 83 36
Caleb Pendleton 94 .176 .202 .264 28 .088 .298 3 -0.4 .205 31 5
Juan Flores 385 .195 .245 .292 49 .097 .272 3 -0.4 .239 57 26
Omar Martinez 432 .194 .275 .321 67 .127 .273 -8 -0.4 .266 72 35
Brandon Drury 368 .219 .285 .357 78 .138 .270 0 -0.5 .283 75 35
Tucker Flint 494 .202 .291 .338 75 .136 .321 -1 -0.5 .281 79 46
Joe Redfield 210 .204 .266 .285 54 .081 .296 2 -0.6 .248 54 16
Matthew Lugo 480 .224 .269 .373 77 .149 .308 -8 -0.6 .279 81 49
Oscar Colás 458 .220 .273 .352 72 .132 .285 2 -0.6 .273 73 43
Matt Coutney 469 .217 .283 .349 75 .132 .310 1 -0.7 .278 77 43
Capri Ortiz 440 .212 .268 .287 55 .075 .291 -3 -0.8 .248 62 37
David Calabrese 441 .190 .256 .296 53 .106 .253 9 -0.8 .247 61 34
Ryan Nicholson 508 .210 .287 .343 75 .133 .282 0 -0.8 .279 78 45
Evan Edwards 282 .191 .270 .303 59 .112 .300 0 -0.9 .257 57 21
Kevin Maitan 260 .207 .258 .295 54 .088 .348 3 -0.9 .245 57 19
Sebastián Rivero 283 .198 .240 .298 49 .100 .249 -3 -0.9 .237 53 19
Sonny DiChiara 308 .188 .276 .301 61 .113 .295 0 -0.9 .261 62 23
Mitchell Daly 305 .171 .237 .236 33 .065 .277 4 -1.0 .216 36 16
Arol Vera 425 .200 .248 .279 47 .079 .275 3 -1.0 .234 52 28
Cole Fontenelle 395 .180 .253 .281 49 .101 .326 1 -1.1 .240 55 30
David Mershon 351 .179 .268 .240 44 .061 .265 -5 -1.2 .236 49 24
Anthony Scull 515 .217 .267 .320 63 .103 .283 -5 -1.2 .260 69 44
Korey Holland 335 .204 .246 .322 56 .118 .335 -1 -1.3 .248 57 27
Alexander Ramirez 308 .184 .231 .306 48 .122 .366 2 -1.3 .236 60 23
Caleb Ketchup 412 .182 .253 .273 47 .091 .283 3 -1.4 .238 52 31
Alberto Rios 214 .157 .221 .220 24 .063 .226 -5 -1.5 .202 29 10
Mac McCroskey 293 .171 .232 .221 27 .050 .273 -3 -1.9 .207 29 16
Dario Laverde 411 .201 .251 .274 47 .073 .273 0 -2.1 .235 54 27
Randy De Jesus 492 .188 .246 .318 56 .130 .286 -3 -2.2 .249 66 37

Batters – Top Near-Age Offensive Comps
Player Hit Comp 1 Hit Comp 2 Hit Comp 3
Zach Neto Travis Jackson Trevor Story Ken Boyer
Mike Trout George Selkirk Bob Allison Jason Bay
Vaughn Grissom Maurice Lerner Don Mason Scott Fletcher
Nelson Rada Mallex Smith Thad Bosley Tommie Martz
Yoán Moncada Jim Fregosi Wilson Betemit Bobby Prescott
Christian Moore Neil McPhee Billy Consolo Jorge Orta
Logan O’Hoppe Bill Nahorodny Johnny Blanchard Dan Graham
Nolan Schanuel Craig Cacek Adam Casillas Gail Hopkins
Donovan Walton Ted Sizemore Loren Babe Casey Candaele
Jo Adell Ron Gant Bill Schlesinger Matt Carson
Kyren Paris Estevan Florial Al Smith Tanner English
Travis d’Arnaud Mike Macfarlane Brian Dorsett Todd Greene
Bryce Teodosio Casio Grider Manny Jose Ramon Gomez
Gustavo Campero Jordany Valdespin Óscar Mercado Albert Hall
Oswald Peraza Pokey Reese Pat Creech Bill Barrett
Denzer Guzman Kelly Johnson Dick Schofield Jack Damaska
J.D. Davis Ray Jablonski Cory Snyder Dale Sveum
Jorge Soler Luke Scott Jim Hickman Adam LaRoche
Luis Rengifo Marty Malloy Jimmy Brown Carlos Garcia
Niko Kavadas Ryan Noda Karl Pagel Rob Nelson
Ben Gobbel Fausto Cruz Dick Windle David Thompson
Josh Crouch Jacob Stallings Cael Brockmeyer Dave Plumb
LaMonte Wade Jr. Ed Bouchee Ron Roenicke Norm Siebern
Anthony Rendon Ramon Santiago Ken Oberkfell Don Kelly
Cavan Biggio Woody English Danny Muno Eddy Alvarez
Adrian Placencia Karexon Sanchez Rich Puig Drew Robinson
Carter Kieboom Marv Galliher Bob Seeds Ron Gardenhire
Chad Wallach Frank Snyder Kelly Stinnett Steve Patchin
Yolmer Sánchez Snuffy Stirnweiss Whitey Wietelmann Steve Hine
Zach Humphreys Joe Pignatano Charlie White Jeff Farnham
Myles Emmerson Greg Almond Dan Conway Patrick Arlis
Tim Anderson Ed Rogers Luis Ordaz Bobby Wilson
Travis Blankenhorn Jeff Kipila Chris Cassels Jim Bennett
Chris Taylor James Mouton Reggie Williams Fred Lewis
Peter Burns Joe Oliveira Jesse Baez Scott Stricklin
Rio Foster Alex Call KD Kang Jeff Hermann
Caleb Pendleton Kim Flowers Ronarsy Ledesma Del Bender
Juan Flores Phil Roof Alex Sirota Kurt Brown
Omar Martinez Marc Sullivan Don Werner Leonard Merullo
Brandon Drury Pat Putnam Pidge Browne Jackie Brandt
Tucker Flint Marv Blaylock Skip Kiil Marcus Wilson
Joe Redfield Carlos Duran Victor Fernandez Malique Ziegler
Matthew Lugo Scott Cousins Alejandro Sanchez Todd Dunwoody
Oscar Colás Doug DeVore Steve Hazlett Paul Hertzler
Matt Coutney Kevin Burns Leo Smith Scott Cepicky
Capri Ortiz Masyn Winn Anderson Hernandez Marten Gasparini
David Calabrese Paul Nelson Jose Camilo Craig Curtis
Ryan Nicholson Kevin Barker Justin Bloxom Barry Miller
Evan Edwards T.J. Staton Gib Seibert Tommy Bost
Kevin Maitan Jeremy Todd Devin Thomas Lydell Moseby
Sebastián Rivero Joe Cipolloni John Purdom Darren Loy
Sonny DiChiara Phil Strom Jim Bishop Sean Bischofberger
Mitchell Daly Bobby Filotei Nick Frank Pete Piskol
Arol Vera Lance Downing Crucito Lara Luis Suarez
Cole Fontenelle Ike Brown U L Washington Sean Berry
David Mershon Jeff Venghaus Troy Haugen Garrett Hampson
Anthony Scull Steve Harvey Kenneth Berger Miguel Negron
Korey Holland Sandy Vasquez Mike Moore Brent Krause
Alexander Ramirez Virgil Hill Michael Bernal Tyler Johnson
Caleb Ketchup Adam White Cam Gibson Brian Seever
Alberto Rios Travis Chapman Mike Morland Blake Ochoa
Mac McCroskey Scott Madsen Chase Tucker Billy Malone
Dario Laverde Dave Callahan Edgar Avila Jon Waltenbury
Randy De Jesus Brian Morrison Bennie Sandlin Tonus Thomas

Batters – 80th/20th Percentiles
Player 80th BA 80th OBP 80th SLG 80th OPS+ 80th WAR 20th BA 20th OBP 20th SLG 20th OPS+ 20th WAR
Zach Neto .281 .353 .513 136 5.1 .234 .307 .410 98 2.3
Mike Trout .260 .380 .502 140 2.9 .209 .329 .389 101 0.7
Vaughn Grissom .277 .343 .419 110 2.2 .222 .290 .329 74 0.1
Nelson Rada .273 .354 .338 93 2.3 .216 .298 .267 60 -0.2
Yoán Moncada .266 .348 .479 127 2.0 .213 .290 .371 85 0.3
Christian Moore .254 .328 .419 105 2.2 .200 .276 .311 65 -0.1
Logan O’Hoppe .269 .325 .471 118 2.3 .205 .266 .354 72 -0.3
Nolan Schanuel .287 .379 .431 123 2.3 .234 .322 .348 86 -0.3
Donovan Walton .265 .332 .379 96 1.7 .211 .277 .297 61 -0.1
Jo Adell .261 .322 .517 127 2.2 .206 .271 .396 84 -0.6
Kyren Paris .231 .316 .401 96 1.6 .177 .263 .308 60 -0.3
Travis d’Arnaud .244 .306 .445 103 1.4 .186 .251 .321 59 0.0
Bryce Teodosio .245 .297 .357 81 1.5 .190 .246 .274 46 -0.2
Gustavo Campero .277 .352 .450 120 1.3 .225 .299 .356 82 -0.3
Oswald Peraza .241 .306 .372 87 1.5 .189 .255 .282 52 -0.2
Denzer Guzman .247 .317 .408 97 1.8 .199 .268 .310 61 -0.6
J.D. Davis .255 .328 .424 106 1.3 .197 .271 .321 67 -0.3
Jorge Soler .247 .337 .473 118 1.2 .201 .289 .364 81 -0.7
Luis Rengifo .278 .329 .404 102 1.4 .223 .275 .317 66 -0.8
Niko Kavadas .228 .334 .424 107 1.5 .171 .280 .320 67 -1.0
Ben Gobbel .256 .303 .413 97 1.2 .206 .255 .322 60 -0.9
Josh Crouch .237 .303 .380 84 0.9 .181 .238 .282 44 -0.6
LaMonte Wade Jr. .249 .368 .400 114 1.0 .194 .310 .304 73 -0.7
Anthony Rendon .264 .356 .357 98 0.6 .203 .293 .274 61 -0.4
Cavan Biggio .238 .341 .367 97 0.9 .186 .291 .283 62 -0.6
Adrian Placencia .221 .307 .375 88 1.3 .167 .255 .277 50 -1.0
Carter Kieboom .280 .334 .399 104 0.8 .220 .276 .309 62 -1.2
Chad Wallach .233 .295 .396 85 0.6 .176 .240 .281 45 -0.8
Yolmer Sánchez .224 .319 .317 76 0.8 .173 .269 .240 44 -0.8
Zach Humphreys .235 .312 .336 77 0.6 .174 .248 .250 39 -0.8
Myles Emmerson .232 .294 .336 77 0.7 .172 .231 .246 36 -0.9
Tim Anderson .280 .316 .340 82 0.7 .211 .251 .265 45 -0.9
Travis Blankenhorn .225 .300 .421 95 0.8 .175 .249 .314 57 -1.0
Chris Taylor .248 .327 .391 98 0.5 .186 .268 .287 56 -1.0
Peter Burns .217 .312 .273 64 0.0 .151 .254 .193 27 -0.5
Rio Foster .238 .329 .387 97 0.5 .188 .276 .295 61 -1.2
Caleb Pendleton .200 .229 .314 48 -0.2 .148 .173 .224 10 -0.6
Juan Flores .227 .279 .345 71 0.7 .167 .219 .253 31 -1.2
Omar Martinez .225 .306 .380 91 0.9 .168 .248 .275 49 -1.3
Brandon Drury .249 .315 .421 102 0.6 .189 .256 .301 56 -1.4
Tucker Flint .231 .316 .389 94 0.7 .176 .264 .292 55 -1.7
Joe Redfield .234 .296 .329 73 -0.2 .175 .237 .245 37 -1.1
Matthew Lugo .252 .295 .422 98 0.7 .199 .242 .332 60 -1.6
Oscar Colás .248 .299 .401 93 0.6 .197 .249 .312 57 -1.4
Matt Coutney .244 .306 .392 92 0.3 .190 .258 .303 56 -1.7
Capri Ortiz .241 .294 .331 74 0.3 .189 .244 .252 41 -1.6
David Calabrese .217 .281 .342 69 0.0 .167 .232 .260 37 -1.8
Ryan Nicholson .236 .312 .386 91 0.3 .185 .262 .301 56 -1.9
Evan Edwards .224 .302 .360 82 -0.1 .166 .246 .259 41 -1.5
Kevin Maitan .237 .289 .343 73 -0.3 .176 .227 .246 32 -1.6
Sebastián Rivero .225 .268 .341 67 -0.2 .168 .212 .253 30 -1.6
Sonny DiChiara .215 .304 .352 80 -0.2 .162 .246 .261 42 -1.6
Mitchell Daly .199 .266 .275 49 -0.3 .146 .210 .196 15 -1.7
Arol Vera .229 .275 .330 67 0.0 .174 .219 .245 29 -2.0
Cole Fontenelle .209 .283 .338 71 0.0 .154 .228 .236 29 -2.0
David Mershon .209 .299 .280 61 -0.3 .151 .240 .203 25 -2.0
Anthony Scull .244 .291 .358 79 -0.2 .191 .243 .278 46 -2.4
Korey Holland .236 .273 .370 76 -0.4 .174 .215 .275 36 -2.2
Alexander Ramirez .223 .269 .371 74 -0.4 .154 .203 .252 26 -2.3
Caleb Ketchup .212 .282 .319 64 -0.4 .155 .228 .239 29 -2.3
Alberto Rios .188 .252 .266 43 -1.0 .131 .197 .179 5 -2.0
Mac McCroskey .195 .254 .249 41 -1.3 .145 .207 .187 12 -2.5
Dario Laverde .232 .282 .321 68 -1.0 .173 .224 .240 30 -2.9
Randy De Jesus .215 .277 .370 76 -1.0 .160 .221 .273 37 -3.5

Batters – Platoon Splits
Player BA vs. L OBP vs. L SLG vs. L BA vs. R OBP vs. R SLG vs. R
Zach Neto .274 .348 .500 .251 .324 .448
Mike Trout .231 .357 .413 .236 .352 .451
Vaughn Grissom .252 .323 .361 .250 .313 .380
Nelson Rada .236 .316 .286 .251 .330 .311
Yoán Moncada .232 .308 .390 .242 .327 .429
Christian Moore .233 .315 .395 .226 .295 .350
Logan O’Hoppe .242 .312 .438 .231 .289 .397
Nolan Schanuel .252 .340 .366 .264 .353 .390
Donovan Walton .232 .293 .330 .240 .308 .343
Jo Adell .238 .302 .483 .231 .295 .440
Kyren Paris .210 .301 .370 .203 .284 .347
Travis d’Arnaud .219 .286 .375 .214 .275 .382
Bryce Teodosio .219 .274 .298 .220 .274 .323
Gustavo Campero .253 .321 .421 .248 .329 .390
Oswald Peraza .214 .285 .336 .213 .273 .323
Denzer Guzman .227 .299 .367 .217 .283 .343
J.D. Davis .233 .310 .398 .221 .291 .362
Jorge Soler .228 .325 .426 .223 .308 .416
Luis Rengifo .257 .301 .382 .247 .302 .354
Niko Kavadas .189 .291 .320 .206 .314 .389
Ben Gobbel .231 .285 .380 .233 .282 .365
Josh Crouch .209 .265 .352 .209 .269 .322
LaMonte Wade Jr. .203 .307 .281 .226 .344 .376
Anthony Rendon .250 .346 .364 .226 .315 .298
Cavan Biggio .205 .308 .282 .214 .320 .336
Adrian Placencia .203 .283 .331 .188 .276 .318
Carter Kieboom .257 .317 .376 .247 .304 .343
Chad Wallach .209 .281 .349 .199 .259 .327
Yolmer Sánchez .204 .289 .265 .197 .293 .282
Zach Humphreys .213 .294 .307 .200 .271 .281
Myles Emmerson .212 .280 .294 .195 .251 .284
Tim Anderson .264 .295 .330 .236 .275 .288
Travis Blankenhorn .200 .267 .318 .202 .272 .383
Chris Taylor .211 .294 .333 .215 .296 .339
Peter Burns .172 .273 .207 .187 .282 .240
Rio Foster .216 .309 .351 .213 .298 .336
Caleb Pendleton .167 .194 .300 .180 .206 .246
Juan Flores .202 .250 .298 .193 .243 .289
Omar Martinez .190 .261 .280 .196 .280 .336
Brandon Drury .225 .286 .363 .216 .285 .355
Tucker Flint .200 .281 .333 .203 .294 .340
Joe Redfield .208 .276 .283 .203 .262 .286
Matthew Lugo .227 .275 .373 .223 .266 .373
Oscar Colás .218 .269 .339 .221 .275 .358
Matt Coutney .209 .276 .348 .220 .285 .350
Capri Ortiz .212 .268 .288 .212 .268 .286
David Calabrese .183 .243 .262 .194 .262 .311
Ryan Nicholson .198 .269 .306 .215 .293 .356
Evan Edwards .187 .265 .297 .194 .272 .306
Kevin Maitan .213 .268 .292 .204 .252 .296
Sebastián Rivero .202 .253 .286 .197 .234 .303
Sonny DiChiara .190 .289 .310 .186 .270 .298
Mitchell Daly .182 .258 .239 .166 .227 .235
Arol Vera .202 .246 .264 .199 .249 .287
Cole Fontenelle .173 .243 .279 .183 .257 .282
David Mershon .180 .263 .213 .178 .270 .251
Anthony Scull .213 .263 .291 .218 .269 .330
Korey Holland .211 .256 .339 .200 .240 .312
Alexander Ramirez .190 .241 .314 .180 .226 .301
Caleb Ketchup .186 .262 .283 .181 .249 .269
Alberto Rios .169 .246 .237 .152 .210 .212
Mac McCroskey .175 .241 .225 .169 .227 .219
Dario Laverde .200 .248 .273 .201 .253 .275
Randy De Jesus .193 .257 .341 .186 .242 .308

Pitchers – Standard
Player T Age W L ERA G GS IP H ER HR BB SO
José Soriano R 27 9 8 4.05 30 24 142.3 127 64 12 63 133
Yusei Kikuchi L 35 7 8 4.33 29 28 147.7 150 71 22 57 151
Reid Detmers L 26 7 7 4.12 39 17 113.7 99 52 14 39 129
Grayson Rodriguez R 26 5 6 4.10 19 19 96.7 90 44 13 32 101
George Klassen R 24 6 8 4.68 23 23 102.0 100 53 14 42 94
Ryan Johnson R 23 4 5 4.24 27 12 70.0 71 33 9 22 64
Tyler Anderson L 36 5 8 4.84 24 23 126.3 129 68 21 51 98
Alek Manoah R 28 4 6 4.00 17 17 87.0 82 45 11 35 73
Caden Dana R 22 7 11 4.91 24 23 117.3 112 64 18 51 108
Mitch Farris L 25 5 8 4.89 25 23 119.7 119 65 18 51 111
Chase Silseth R 26 3 4 4.36 27 12 66.0 61 32 9 29 67
Brock Burke L 29 4 3 3.79 61 1 61.7 59 26 7 19 57
Ben Joyce R 25 2 1 3.69 44 1 46.3 37 19 4 20 54
Kyle Hendricks R 36 5 9 5.16 24 23 122.0 136 70 20 36 85
Drew Pomeranz L 37 2 3 4.13 55 4 48.0 44 22 6 15 49
Kirby Yates R 39 3 4 3.95 48 0 43.3 34 19 5 21 52
Jack Kochanowicz R 25 6 9 5.26 25 24 125.0 134 73 17 46 77
Luis García R 39 2 2 4.10 51 1 48.3 49 22 4 19 42
Victor Mederos R 25 5 9 5.12 22 20 103.7 109 59 15 43 77
Jose Gonzalez R 24 5 8 5.24 21 19 91.0 99 53 15 26 67
Cody Laweryson R 28 3 3 4.26 34 2 50.7 50 24 7 16 45
Dakota Hudson R 31 5 8 5.35 23 20 117.7 133 70 16 44 67
Shaun Anderson R 31 4 7 5.30 26 18 103.7 120 61 18 30 70
José Fermin R 24 4 6 4.37 54 1 57.7 50 28 8 26 59
Angel Felipe R 28 1 2 4.35 35 2 39.3 35 19 4 22 41
Carson Fulmer R 32 2 3 4.96 30 6 69.0 70 38 10 29 57
Sam Aldegheri L 24 6 10 5.43 24 23 122.7 130 74 20 55 92
Sam Bachman R 26 3 4 4.56 35 5 47.3 47 24 5 23 40
Walbert Urena R 22 5 8 5.40 25 25 118.3 124 71 16 61 85
Robert Stephenson R 33 1 2 4.25 31 0 29.7 27 14 4 9 33
Houston Harding L 28 2 3 5.05 17 7 51.7 56 29 7 25 36
Touki Toussaint R 30 2 4 5.14 23 6 68.3 66 39 9 38 63
José Quijada L 30 2 3 4.33 38 0 35.3 30 17 4 17 40
Mason Erla R 28 2 4 5.16 18 6 45.3 51 26 7 17 28
Joel Hurtado R 25 4 8 5.52 19 18 89.7 101 55 14 38 54
José Ureña R 34 2 4 5.22 23 11 70.7 78 41 11 32 48
Andrew Chafin L 36 2 3 4.46 50 0 42.3 40 21 5 23 46
Jordan Romano R 33 3 3 4.43 44 0 40.7 37 20 6 15 44
Ryan Costeiu R 25 4 8 5.54 21 17 92.7 98 57 16 39 73
Brett Kerry R 27 5 8 5.57 22 19 108.3 118 67 21 34 75
Jack Dashwood L 28 2 4 4.94 39 2 51.0 53 28 8 19 44
Ryan Zeferjahn R 28 4 4 4.58 50 1 55.0 47 28 8 30 63
Luke Murphy R 26 2 2 4.88 37 1 48.0 48 26 6 20 40
Andrew Vasquez L 32 2 4 5.27 29 2 41.0 42 24 6 15 33
Camden Minacci R 24 3 3 4.82 45 0 56.0 59 30 7 23 44
Kenyon Yovan R 28 3 3 4.89 40 1 49.7 51 27 7 21 41
Angel Perdomo L 32 1 3 5.00 26 0 27.0 24 15 4 17 28
Kelvin Cáceres R 26 2 2 5.10 32 1 42.3 40 24 5 24 40
Brady Choban R 25 3 5 5.04 45 0 50.0 52 28 6 19 34
Victor González L 30 1 2 4.99 37 0 39.7 39 22 5 20 30
Dylan Phillips L 27 2 4 5.04 41 1 60.7 63 34 9 23 47
Hunter Strickland R 37 2 3 5.06 41 0 42.7 43 24 6 20 32
Jared Southard R 25 2 3 4.88 43 0 55.3 56 30 8 22 47
Nick Jones L 27 2 3 5.21 35 2 48.3 50 28 7 22 40
A.J. Block L 28 2 3 5.24 31 1 46.3 46 27 6 23 42
Bryce Osmond R 25 2 6 6.00 14 13 51.0 55 34 10 25 39
Samy Natera Jr. L 26 2 4 5.40 38 5 55.0 52 33 9 34 56
Roman Phansalkar R 28 1 2 5.87 30 0 38.3 40 25 6 22 29
Endrys Briceno R 34 1 1 6.14 24 0 36.7 41 25 6 21 26

Pitchers – Advanced
Player IP K/9 BB/9 HR/9 BB% K% BABIP ERA+ 3ERA+ FIP ERA- WAR
José Soriano 142.3 8.4 4.0 0.8 10.2% 21.6% .288 104 104 3.93 96 2.2
Yusei Kikuchi 147.7 9.2 3.5 1.3 8.8% 23.4% .312 97 91 4.29 103 1.8
Reid Detmers 113.7 10.2 3.1 1.1 8.2% 27.1% .293 102 106 3.68 98 1.7
Grayson Rodriguez 96.7 9.4 3.0 1.2 7.8% 24.6% .296 103 103 3.94 97 1.4
George Klassen 102.0 8.3 3.7 1.2 9.3% 20.7% .296 90 95 4.49 111 1.0
Ryan Johnson 70.0 8.2 2.8 1.2 7.4% 21.5% .305 99 105 3.95 101 0.9
Tyler Anderson 126.3 7.0 3.6 1.5 9.2% 17.7% .285 87 81 5.10 115 0.9
Alek Manoah 87.0 7.6 3.6 1.1 9.3% 19.5% .281 90 91 4.61 110 0.8
Caden Dana 117.3 8.3 3.9 1.4 9.9% 20.9% .285 86 92 4.80 116 0.8
Mitch Farris 119.7 8.3 3.8 1.4 9.7% 21.0% .296 86 91 4.62 116 0.8
Chase Silseth 66.0 9.1 4.0 1.2 10.0% 23.2% .291 97 100 4.36 103 0.7
Brock Burke 61.7 8.3 2.8 1.0 7.3% 21.9% .295 111 108 3.81 90 0.6
Ben Joyce 46.3 10.5 3.9 0.8 10.2% 27.4% .287 114 117 3.64 88 0.6
Kyle Hendricks 122.0 6.3 2.7 1.5 6.8% 16.1% .300 82 76 4.88 122 0.5
Drew Pomeranz 48.0 9.2 2.8 1.1 7.4% 24.3% .292 102 93 4.00 98 0.5
Kirby Yates 43.3 10.8 4.4 1.0 11.4% 28.3% .279 107 101 3.92 94 0.4
Jack Kochanowicz 125.0 5.5 3.3 1.2 8.3% 14.0% .289 80 84 5.07 125 0.4
Luis García 48.3 7.8 3.5 0.7 8.9% 19.6% .313 103 99 3.87 97 0.4
Victor Mederos 103.7 6.7 3.7 1.3 9.4% 16.8% .294 82 85 5.18 122 0.4
Jose Gonzalez 91.0 6.6 2.6 1.5 6.5% 16.8% .297 80 86 4.99 124 0.3
Cody Laweryson 50.7 8.0 2.8 1.2 7.4% 20.9% .295 99 99 4.25 101 0.3
Dakota Hudson 117.7 5.1 3.4 1.2 8.4% 12.8% .298 79 78 5.09 127 0.3
Shaun Anderson 103.7 6.1 2.6 1.6 6.5% 15.3% .304 80 78 5.03 125 0.3
José Fermin 57.7 9.2 4.1 1.2 10.4% 23.7% .276 96 103 4.38 104 0.2
Angel Felipe 39.3 9.4 5.0 0.9 12.6% 23.4% .295 97 96 4.38 103 0.2
Carson Fulmer 69.0 7.4 3.8 1.3 9.5% 18.6% .293 85 83 4.79 118 0.2
Sam Aldegheri 122.7 6.7 4.0 1.5 9.9% 16.6% .292 78 83 5.35 128 0.2
Sam Bachman 47.3 7.6 4.4 1.0 10.8% 18.9% .300 92 95 4.56 109 0.2
Walbert Urena 118.3 6.5 4.6 1.2 11.3% 15.7% .293 78 84 5.23 128 0.2
Robert Stephenson 29.7 10.0 2.7 1.2 7.2% 26.4% .299 99 95 3.70 101 0.2
Houston Harding 51.7 6.3 4.4 1.2 10.7% 15.4% .299 83 84 5.04 120 0.1
Touki Toussaint 68.3 8.3 5.0 1.2 12.4% 20.5% .294 82 81 4.96 122 0.1
José Quijada 35.3 10.2 4.3 1.0 11.3% 26.5% .289 97 96 3.98 103 0.1
Mason Erla 45.3 5.6 3.4 1.4 8.4% 13.9% .297 82 83 5.19 122 0.1
Joel Hurtado 89.7 5.4 3.8 1.4 9.3% 13.3% .295 76 80 5.49 132 0.1
José Ureña 70.7 6.1 4.1 1.4 10.1% 15.1% .298 81 76 5.31 124 0.1
Andrew Chafin 42.3 9.8 4.9 1.1 12.0% 24.0% .310 94 85 4.23 106 0.1
Jordan Romano 40.7 9.7 3.3 1.3 8.8% 25.7% .292 95 89 4.25 105 0.1
Ryan Costeiu 92.7 7.1 3.8 1.6 9.4% 17.7% .293 76 81 5.19 131 0.0
Brett Kerry 108.3 6.2 2.8 1.7 7.2% 15.9% .286 76 78 5.35 132 0.0
Jack Dashwood 51.0 7.8 3.4 1.4 8.5% 19.7% .300 85 87 4.71 118 0.0
Ryan Zeferjahn 55.0 10.3 4.9 1.3 12.3% 25.9% .283 92 92 4.73 109 0.0
Luke Murphy 48.0 7.5 3.8 1.1 9.5% 19.0% .296 86 90 4.56 116 -0.1
Andrew Vasquez 41.0 7.2 3.3 1.3 8.4% 18.5% .293 80 79 5.07 125 -0.1
Camden Minacci 56.0 7.1 3.7 1.1 9.2% 17.5% .302 87 93 4.56 115 -0.1
Kenyon Yovan 49.7 7.4 3.8 1.3 9.4% 18.4% .297 86 87 4.79 116 -0.1
Angel Perdomo 27.0 9.3 5.7 1.3 13.8% 22.8% .282 84 80 5.24 119 -0.1
Kelvin Cáceres 42.3 8.5 5.1 1.1 12.2% 20.4% .294 83 85 4.94 121 -0.2
Brady Choban 50.0 6.1 3.4 1.1 8.6% 15.4% .291 84 87 4.74 120 -0.2
Victor González 39.7 6.8 4.5 1.1 11.2% 16.8% .283 84 83 5.10 118 -0.2
Dylan Phillips 60.7 7.0 3.4 1.3 8.5% 17.4% .292 84 86 5.03 119 -0.2
Hunter Strickland 42.7 6.7 4.2 1.3 10.6% 16.9% .285 83 76 5.04 120 -0.2
Jared Southard 55.3 7.6 3.6 1.3 8.9% 19.0% .294 86 91 4.81 116 -0.2
Nick Jones 48.3 7.5 4.1 1.3 10.1% 18.3% .299 81 83 5.00 123 -0.2
A.J. Block 46.3 8.2 4.5 1.2 11.1% 20.2% .299 80 82 4.91 125 -0.2
Bryce Osmond 51.0 6.9 4.4 1.8 10.8% 16.8% .290 70 76 5.95 142 -0.2
Samy Natera Jr. 55.0 9.2 5.6 1.5 13.4% 22.1% .291 78 82 5.38 128 -0.2
Roman Phansalkar 38.3 6.8 5.2 1.4 12.5% 16.5% .291 72 73 5.80 139 -0.6
Endrys Briceno 36.7 6.4 5.2 1.5 12.1% 15.0% .302 69 66 6.00 146 -0.6

Pitchers – Top Near-Age Comps
Player Pit Comp 1 Pit Comp 2 Pit Comp 3
José Soriano Garrett Richards Yordano Ventura Dean Chance
Yusei Kikuchi Chuck Finley Jerry Koosman Gary Peters
Reid Detmers Bob Shirley Denny Lemaster Jerry Koosman
Grayson Rodriguez Ken Forsch Paul Moskau Bill Knox
George Klassen Ramon Ramirez Dean Kremer Chuck Johnson
Ryan Johnson Ed Hobaugh William Bird Arthur White
Tyler Anderson Randy Wolf Fernando Valenzuela Mike Cuellar
Alek Manoah Paul Byrd Ed Whitson Pat Zachry
Caden Dana Sean Reid-Foley Herm Wehmeier Gavin Floyd
Mitch Farris Austin Gomber James Gillheeney Alex Kellner
Chase Silseth Jim Hannan Fernando Nieve Andrew Cashner
Brock Burke Jose Luis Garcia Dave Schuler Gary Lucas
Ben Joyce Brad Lesley Miguel Rubio Joey Devine
Kyle Hendricks Braden Looper Steve Sparks Livan Hernandez
Drew Pomeranz Gary Lavelle Bobby Shantz Greg Swindell
Kirby Yates Grant Balfour Don McMahon Steve Farr
Jack Kochanowicz Sal Romano José Ureña Luis Perdomo
Luis García Jim Johnson Blaine Boyer LaTroy Hawkins
Victor Mederos Dan Slania Heath Fillmyer Kent Bottenfield
Jose Gonzalez Taylor Stanton Jason McCommon Gabe Mosser
Cody Laweryson Ryan Doolittle Jonathan Albaladejo Jack Hardy
Dakota Hudson Andy Hawkins Rob Mattson Scott Carroll
Shaun Anderson Virgil Vasquez Alex Cobb Nick Blackburn
José Fermin Gene Pentz Joey Krehbiel Enoli Paredes
Angel Felipe Dave Campbell Gene Harris Fred Lasher
Carson Fulmer Francisco Oliveras John Tsitouris Jorge Sosa
Sam Aldegheri Luis Lugo Jhonathan Diaz Evan Kruczynski
Sam Bachman Dan Ledduke Tim Millner Fabio Castillo
Walbert Urena Conner Greene Jose Mesa Keith Silver
Robert Stephenson Mark Huismann Gordon Maltzberger Jeff Reardon
Houston Harding Ron Locke Scott Baker Darrell Peters
Touki Toussaint Al Schroll Bob Greenwood Winston Brown
José Quijada Drew Hall Yorkis Perez Atahualpa Severino
Mason Erla Ryan Doolittle Scott McKenzie Jim McCready
Joel Hurtado Chuck Davis Trey Nielsen Pete Walker
José Ureña Ken Ray Andrew Cashner Mike Romano
Andrew Chafin Scott Eyre Yorkis Perez Ron Mahay
Jordan Romano Xavier Hernandez Mel Rojas Anthony Swarzak
Ryan Costeiu Alfred Gutierrez Matt Esparza Henry Gomez
Brett Kerry Conor Fisk Dereck Rodríguez Doug Waechter
Jack Dashwood Bill Edgerton Ken Page John Duffy
Ryan Zeferjahn Ken Robinson Curtis Partch Bob Gibson
Luke Murphy Elvys Quezada Matt Hauser Mike Dupree
Andrew Vasquez Bob Chipman Chuck Stobbs Tom Burgmeier
Camden Minacci Julio Perez Robert Hinton Brandon Pello
Kenyon Yovan Elvys Quezada Mike Cather Geoff Broussard
Angel Perdomo Andy Hassler Al Hrabosky Lou Sleater
Kelvin Cáceres David Shafer Andre Scrubb Don DeMola
Brady Choban Chris Bennett Milt Wilcox David Duran
Victor González Fred Scherman George Cappuzzello Bob Myrick
Dylan Phillips Ryan Dennick Clint Goocher Brendan Lafferty
Hunter Strickland Jose Mesa Tom Hurd Jamey Wright
Jared Southard Alex Burnett Blake Wood Paul Cave
Nick Jones Jordan Mills Christian Jones Len Whitehouse
A.J. Block Wade Korpi Tom Funk Terry Burrows
Bryce Osmond Jeff Ames Jesus Vila Gary Weese
Samy Natera Jr. Alan Webb Alex Herrera Victor Payano
Roman Phansalkar Kris Harvey Gary Murphy Marcel Lachemann
Endrys Briceno Dave Stenhouse Luis Angel Daniel Francisco Rodriguez

Pitchers – Splits and Percentiles
Player BA vs. L OBP vs. L SLG vs. L BA vs. R OBP vs. R SLG vs. R 80th WAR 20th WAR 80th ERA 20th ERA
José Soriano .217 .309 .336 .254 .339 .387 3.1 0.9 3.54 4.82
Yusei Kikuchi .224 .286 .366 .265 .335 .448 2.8 0.5 3.70 5.25
Reid Detmers .204 .278 .340 .236 .305 .393 2.6 0.4 3.50 5.05
Grayson Rodriguez .223 .289 .380 .255 .318 .423 2.2 0.6 3.43 4.83
George Klassen .242 .322 .401 .258 .330 .428 1.7 0.2 4.08 5.27
Ryan Johnson .271 .331 .443 .229 .273 .361 1.6 0.4 3.51 5.00
Tyler Anderson .270 .343 .451 .258 .331 .454 1.7 0.1 4.26 5.53
Alek Manoah .273 .362 .459 .216 .293 .352 1.3 0.2 4.13 5.28
Caden Dana .244 .352 .394 .250 .314 .450 1.5 -0.1 4.42 5.50
Mitch Farris .238 .310 .338 .258 .333 .466 1.7 -0.1 4.29 5.63
Chase Silseth .244 .341 .437 .237 .307 .370 1.3 0.1 3.68 5.19
Brock Burke .240 .293 .360 .248 .309 .406 1.2 0.1 3.12 4.58
Ben Joyce .214 .320 .357 .216 .314 .318 1.0 0.0 3.07 4.57
Kyle Hendricks .277 .342 .485 .276 .315 .452 1.1 -0.5 4.63 6.04
Drew Pomeranz .224 .296 .327 .248 .322 .429 1.0 -0.2 3.05 5.73
Kirby Yates .224 .342 .388 .209 .298 .352 1.0 -0.2 2.84 5.67
Jack Kochanowicz .282 .359 .473 .256 .324 .407 1.0 -0.3 4.85 5.78
Luis García .274 .358 .405 .241 .308 .361 0.8 -0.2 3.28 5.24
Victor Mederos .266 .360 .432 .264 .341 .445 1.0 -0.2 4.70 5.69
Jose Gonzalez .282 .344 .492 .255 .316 .427 0.8 -0.2 4.75 5.91
Cody Laweryson .247 .311 .452 .255 .310 .387 0.7 -0.2 3.60 5.13
Dakota Hudson .284 .358 .476 .273 .333 .427 0.8 -0.5 4.94 5.96
Shaun Anderson .302 .350 .520 .263 .313 .446 0.8 -0.4 4.77 5.94
José Fermin .231 .317 .407 .232 .317 .392 0.7 -0.3 3.70 5.17
Angel Felipe .257 .366 .457 .213 .326 .300 0.5 -0.3 3.74 5.51
Carson Fulmer .279 .360 .475 .243 .315 .392 0.6 -0.4 4.33 5.86
Sam Aldegheri .239 .324 .355 .278 .360 .503 0.9 -0.7 4.89 6.10
Sam Bachman .267 .357 .442 .240 .336 .360 0.5 -0.2 4.08 5.22
Walbert Urena .270 .363 .434 .257 .348 .433 0.8 -0.6 4.97 6.01
Robert Stephenson .231 .298 .423 .242 .294 .387 0.5 -0.2 3.12 5.98
Houston Harding .268 .354 .366 .268 .342 .471 0.5 -0.2 4.58 5.70
Touki Toussaint .273 .386 .446 .229 .325 .382 0.7 -0.5 4.43 6.00
José Quijada .213 .315 .298 .230 .320 .414 0.5 -0.4 3.49 5.65
Mason Erla .289 .368 .530 .267 .318 .406 0.3 -0.2 4.62 5.73
Joel Hurtado .279 .356 .453 .276 .353 .469 0.4 -0.4 5.14 6.03
José Ureña .295 .373 .496 .255 .331 .428 0.5 -0.4 4.66 5.91
Andrew Chafin .242 .342 .379 .242 .333 .404 0.6 -0.6 3.40 6.41
Jordan Romano .221 .303 .382 .250 .323 .432 0.5 -0.4 3.58 5.59
Ryan Costeiu .269 .348 .469 .260 .326 .449 0.6 -0.6 5.03 6.13
Brett Kerry .283 .342 .490 .264 .316 .477 0.8 -0.7 4.96 6.16
Jack Dashwood .250 .316 .382 .265 .331 .471 0.4 -0.5 4.23 5.77
Ryan Zeferjahn .234 .351 .436 .221 .331 .363 0.6 -0.6 3.90 5.59
Luke Murphy .253 .343 .437 .255 .325 .392 0.2 -0.4 4.30 5.48
Andrew Vasquez .246 .338 .351 .269 .353 .490 0.2 -0.5 4.47 6.37
Camden Minacci .282 .355 .445 .239 .308 .385 0.2 -0.5 4.32 5.39
Kenyon Yovan .253 .333 .425 .266 .341 .440 0.3 -0.5 4.22 5.64
Angel Perdomo .200 .333 .314 .258 .375 .455 0.1 -0.5 4.16 6.24
Kelvin Cáceres .260 .367 .429 .227 .349 .364 0.1 -0.6 4.59 5.99
Brady Choban .268 .339 .433 .255 .330 .402 0.1 -0.5 4.52 5.61
Victor González .236 .333 .345 .265 .365 .459 0.1 -0.6 4.33 5.84
Dylan Phillips .265 .347 .494 .261 .339 .408 0.2 -0.7 4.47 5.87
Hunter Strickland .279 .380 .471 .247 .321 .412 0.2 -0.7 4.26 6.42
Jared Southard .240 .325 .410 .269 .343 .445 0.2 -0.5 4.34 5.41
Nick Jones .231 .320 .354 .276 .359 .472 0.2 -0.6 4.54 6.07
A.J. Block .224 .338 .362 .264 .359 .440 0.2 -0.6 4.54 5.96
Bryce Osmond .253 .357 .432 .284 .363 .523 0.2 -0.6 5.41 6.78
Samy Natera Jr. .235 .354 .397 .250 .363 .451 0.3 -0.8 4.59 6.30
Roman Phansalkar .284 .422 .507 .247 .330 .400 -0.3 -0.9 5.16 6.74
Endrys Briceno .279 .395 .426 .275 .372 .513 -0.3 -0.9 5.37 7.03

Players are listed with their most recent teams wherever possible. This includes players who are unsigned or have retired, players who will miss 2026 due to injury, and players who were released in 2025. So yes, if you see Joe Schmoe, who quit baseball back in August to form a Ambient Math-Rock Trip-Hop Yacht Metal band that only performs in abandoned malls, he’s still listed here intentionally. ZiPS is assuming a league with an ERA of 4.16.

Hitters are ranked by zWAR, which is to say, WAR values as calculated by me, Dan Szymborski, whose surname is spelled with a z. WAR values might differ slightly from those that appear in the full release of ZiPS. Finally, I will advise anyone against — and might karate chop anyone guilty of — merely adding up WAR totals on a depth chart to produce projected team WAR. It is important to remember that ZiPS is agnostic about playing time, and has no information about, for example, how quickly a team will call up a prospect or what veteran has fallen into disfavor.

As always, incorrect projections are either caused by misinformation, a non-pragmatic reality, or by the skillful sabotage of our friend and former editor. You can, however, still get mad at me on Twitter or on Bluesky. This last is, however, not an actual requirement.


Cubs Trade for Edward Cabrera and His Amazing Changeup

Sam Navarro-Imagn Images

This offseason has been reasonably busy in terms of actual moves, but light on rumors. One of the few exceptions has involved the Marlins’ Edward Cabrera. The Yankees’ interest in the 27-year-old right-hander has been consistent throughout the winter, but it appears they’ve been beaten to the punch.

Cabrera is indeed on the move, but he’s bound for Chicago, not New York, as Michael Cerami of Bleacher Nation reported late Wednesday morning. The Cubs get a hard-throwing starting pitcher, fresh off a 3.53 ERA in 137 2/3 innings, with three years of team control remaining. In order to entice the Marlins to part with Cabrera, Chicago gave up three position player prospects: Owen Caissie, shortstop Cristian Hernandez, and corner infielder Edgardo De Leon. The Yankees, Jon Heyman says, were “never close.” Read the rest of this entry »


Let’s Hear About Four Prominent Minnesota Twins Prospects

Brett Rojo-USA TODAY Sports

On December 28, Sunday Notes led with a look at how seven of the nine position players projected to start for the Minnesota Twins this coming season were drafted by the club in either the first or second round. (The column also cited homegrown numbers for several other organizations.) Twins president of baseball operations Derek Falvey was quoted extensively within the piece, offering perspective on how the current roster came together.

Today we’ll hear from Twins GM Jeremy Zoll, as well as from Falvey, on a quartet of first- and second-round picks who have yet to reach Minnesota. One is a middle infielder, three are pitchers, and all rank among the team’s top prospects. I asked about each of them when the executives met with members of the media during the Winter Meetings.

———

“It was Kaelen’s first full season, and he had an awesome year,” Zoll said of 23-year-old shortstop Kaelen Culpepper, whom the Twins drafted 21st overall in 2024 out of Kansas State University. “He was between High-A and Double-A, and we couldn’t have asked for it go much better. We’re really pleased. He had the opportunity to go to the Futures Game.

“He’s primarily playing shortstop, but he’s also getting some early work at second base and third base, as well as a little bit of game exposure at both spots. We’ll continue to let that play out as we get through spring training and into the season. We’ll figure it out exactly in terms of placement and proximity. We always kind of let the player dictate that with his performance, but he’s put just about as much pressure on us [as anyone] in terms of us wanting to keep moving him, and keeping him challenged.” Read the rest of this entry »


JAWS and the 2026 Hall of Fame Ballot: Shin-Soo Choo

Jerome Miron-USA TODAY Sports

The following article is part of Jay Jaffe’s ongoing look at the candidates on the BBWAA 2026 Hall of Fame ballot. For a detailed introduction to this year’s ballot, and other candidates in the series, use the tool above; an introduction to JAWS can be found here. For a tentative schedule, see here. All WAR figures refer to the Baseball Reference version unless otherwise indicated.

2026 BBWAA Candidate: Shin-Soo Choo
Player Pos Career WAR Peak WAR JAWS H HR SB AVG/OBP/SLG OPS+
Shin-Soo Choo RF 34.7 29.3 32.0 1,671 218 157 .275/.377/.447 122
Source: Baseball-Reference

By the time Shin-Soo Choo reached the majors with the Mariners in 2005, nine South Korea-born pitchers had followed in the wake of Chan Ho Park, who debuted with the Dodgers in 1994, but just one position player preceded him, namely Hee-Seop Choi. It took a few years and a lopsided trade before Choo’s major league career got off the ground, and he lost significant time to a variety of injuries, but over the course of his 16 seasons with Seattle, Cleveland, Cincinnati, and Texas, he established himself as an on-base machine with considerable pop. He set a number of firsts, including becoming the first South Korean position player to make an All-Star team and now, the first such player to make a Hall of Fame ballot.

To these eyes, that latter distinction is a big deal. Most of the 12 newcomers on this year’s Hall of Fame ballot don’t have the numbers to merit election or even much debate. Their appearance on the ballot after spending at least 10 seasons in the majors with some distinction is its own reward, and with the deadline for voting now past, we’re in the part of the cycle where we can take the time to celebrate these players’ fine careers in their own right. A decade ago, I raised a bit of an international stink when Park — who spent 17 seasons in the majors (1994–2010), won 124 games (still the major league record for a player born in Asia, one ahead of former teammate Hideo Nomo), and became the first South Korea-born player to make an All-Star team — was left off. It felt like a needless snub. “Like Hideo Nomo, who blazed a trail for modern Japanese players to come to the majors, Park deserves the recognition that comes with a spot on the ballot,” I wrote for SI.com. I’ve made noise about other slights since then, and I think the situation has improved over time, so I’m particularly glad to see Choo here.

Shin-Soo Choo was born on July 13, 1982 in the Nam district of Busan, South Korea, a coastal city that is the country’s second-largest, behind Seoul. He’s the oldest son of father So-min Choo and mother Yu-jeon Park. He was born into a baseball family, as his mother’s brother, Jeong-Tae Park, starred as a second baseman for the KBO’s Lotte Giants from 1991–2004, winning five Gold Gloves (given to the best all-around player at each position, not just the best defender) and sealing the Giants’ 1992 championship by recording the final out in their Korean Series victory over the Binggrae Eagles. Read the rest of this entry »


Can You Make More Contact by Standing Closer to the Plate?

Sergio Estrada-Imagn Images

Back in the fall, Daniel R. Epstein of Baseball Prospectus wrote a couple of articles about where hitters stand in the batter’s box. Statcast released batting stance information last year as part of the ongoing rollout of bat tracking information that started in 2024. Understandably, the location of a hitter’s center of mass got a bit overshadowed by the wealth of information about how their bat moves through space and finds its way to the ball (or not), but Dan did his part to drag it into the light. He found a relationship between contact rate and where the batter stands. Specifically, standing deeper in the box and standing closer to home plate are both associated with higher contact rates.

Both of those findings are intuitive enough. Standing deeper in the box gives you a longer reaction time. It’s no surprise that batters who take advantage of that extra information make more contact. It’s also easy to spot a potential selection bias: The players in the back of the box are likely back there because they’re the kind of contact-oriented players who want the extra reaction time.

I saw less of a physical reason for players who stand farther from home plate to make more contact, unless they stand so far from the plate that they have trouble reaching the outside corner, but (almost) nobody actually does that. It might take your bat head slightly longer to reach the outside part of the plate, but the ideal contact point for an outside pitch is deeper anyway, so I assumed the two would balance out and chalked the difference up to selection bias. Bigger players with longer arms naturally feel more comfortable farther away from home plate, and those bigger players tend to have more powerful swings, which tend to result in more whiffs. Causation isn’t correlation, and I wasn’t ready to go so far as to assume that standing farther away from home plate actually causes a batter to make less contact. Then I watched A League of Their Own again. Read the rest of this entry »


2026 ZiPS Projections: Tampa Bay Rays

For the 22nd consecutive season, the ZiPS projection system is unleashing a full set of prognostications. For more information on the ZiPS projections, please consult this year’s introduction, as well as MLB’s glossary entry. The team order is selected by lot, and the next team up is the Tampa Bay Rays.

Batters

The Orioles hogged most of the AL East Disappointment space in 2025, but the Rays were similarly uninspiring. Rather than bouncing back from a down 2024, their first losing season in a pretty long stretch, they dropped down a few more wins in 2025, and never felt like they were relevant, either as dominating contender or incompetent doormat. While the Rays are historically great when it comes to squeezing as much out of every penny, it can be difficult for them to turn things around quickly because they won’t bridge gaps with big spending. So now they enter 2026 with their usual m.o. of trying to accumulate enough incremental advantages to sneakily win 90 games.

Tampa Bay doesn’t have a particularly deep offense, so if the team is successful, it’ll likely require big years from Yandy Díaz and Junior Caminero. ZiPS is still happy with Díaz as one of the better DHs in baseball, though the fact that he’ll turn 35 in August can’t completely be ignored. Nor is ZiPS projecting 45 home runs from Caminero, but he still should be easily this lineup’s largest source of pure power. The computer does expect some offensive regression from Jonathan Aranda, since being able to run a .409 BABIP — like he did last year — isn’t a skill that major leaguers just happen to possess. That said, he’s still projected to produce enough to play first base, rather than getting stuck in tweener hell — that awful place reserved for players who both aren’t good enough offensively to be first basemen and who aren’t strong enough defensively to play a more important infield spot.

ZiPS is not electronically enamored with either recent signee Cedric Mullins or Josh Lowe in the outfield, and it sees the Nick Fortes-led catching tandem as less forte and more pianissimo, but the Rays look at least passable at those positions. Carson Williams gets a solid projection from ZiPS, better than either Steamer or THEBAT, but it is a lot less excited about him, both offensively and defensively, after his rough 2025 season. Left field projects to be a real problem spot, and though Brandon Lowe is probably overrated at this point, ZiPS doesn’t really like any of his possible replacements at second base on our depth chart. ZiPS does like Jadher Areinamo’s defense a lot more than the consensus, so he’s at least interesting. Prospect Xavier Isaac doesn’t spike a big projection, but his offensive upside is real, and there’s hope that his elbow is fine, and that there are no lasting repercussions from the “life-saving” brain surgery he had over the summer.

Pitchers

Even after trading right-hander Shane Baz to the Orioles, the Rays rotation looks to be in at least decent shape. If Shane McClanahan, who hasn’t pitched in the majors since 2023, is fully healthy, he rounds out a pretty nice top trio with Drew Rasmussen and Ryan Pepiot. Meanwhile, offseason acquisition Steven Matz could be either a decent fourth starter or strong in a relief role, and Tropicana Field is a fairly safe home to limit his occasional homericiousness. Both Joe Boyle and Ian Seymour project as league average or just a skosh worse, so there are at least six plausible rotation candidates here, and Yoendrys Gómez isn’t that far back. What ZiPS doesn’t see is a lot of emergency depth here; it usually thinks the Rays have a number of fringy pitching prospects who could fill in admirably, but that’s not the case this time around.

The bullpen is a similar story. ZiPS isn’t super excited about Edwin Uceta, but it remains a huge fan of Griffin Jax, picked up last summer when the league pillaged the Twins. Jax was a short-term play, but ZiPS doesn’t see Taj Bradley, whom Tampa Bay sent to Minnesota in return, as being much more interesting than either Boyle or Seymour. Garrett Cleavinger gets a solid projection, and ZiPS is happy with Bryan Baker, Mason Englert, and Kevin Kelly. ZiPS is less tickled by the Rays’ options to cover lower-leverage innings, guys like Steven Wilson or Hunter Bigge, but I’m sure the team will find some random unknown reliever to put up a 3.30 ERA.

The Rays aren’t bad, but this is a tough division, and there are enough holes and questions that ZiPS is putting them in water-treading territory again, somewhere between a few games below .500 and a few games above it. That’s still a team that can sneak into a wild card, but it’ll need some good fortune to do so.

Ballpark graphic courtesy Eephus League. Depth charts constructed by way of those listed here. Size of player names is very roughly proportional to Depth Chart playing time. The final team projections may differ considerably from our Depth Chart playing time.

Batters – Standard
Player B Age PO PA AB R H 2B 3B HR RBI BB SO SB CS
Junior Caminero R 22 3B 637 585 83 158 27 0 36 115 44 119 6 1
Yandy Díaz R 34 DH 585 520 70 154 27 0 17 74 55 83 2 1
Jonathan Aranda L 28 1B 449 394 60 108 18 0 16 62 43 110 1 1
Carson Williams R 23 SS 554 498 74 110 17 4 21 72 47 189 16 7
Jadher Areinamo R 22 2B 570 529 63 136 25 0 14 64 30 82 13 6
Josh Lowe L 28 RF 467 423 62 113 24 2 15 57 38 123 21 3
Dominic Keegan R 25 C 390 351 44 83 17 2 10 46 29 105 0 0
Andrew Stevenson L 32 RF 368 338 43 88 15 3 7 43 24 88 19 5
Ryan Vilade R 27 RF 480 429 57 108 20 3 11 57 40 112 8 4
Cedric Mullins L 31 CF 478 425 59 95 19 1 15 56 43 105 20 4
Tatem Levins L 27 C 355 309 37 67 14 1 7 37 38 100 1 0
Raynel Delgado L 26 2B 447 400 48 102 14 2 6 43 36 101 20 6
Homer Bush Jr. R 24 CF 512 459 60 119 12 4 3 48 31 105 29 8
Austin Overn L 23 CF 472 418 63 97 12 3 11 50 41 150 31 7
Bob Seymour L 27 1B 486 448 65 109 18 2 20 70 33 144 3 0
Hunter Feduccia L 29 C 393 345 46 80 16 2 9 37 44 99 1 0
Chandler Simpson L 25 CF 558 519 75 151 16 3 0 43 30 55 51 12
Hunter Stovall R 29 3B 382 355 41 82 12 1 6 36 21 71 7 2
Nick Fortes R 29 C 294 265 31 59 9 0 7 30 18 49 2 1
Jacob Melton L 25 CF 368 338 47 76 15 1 10 41 27 97 20 5
Brayden Taylor L 24 3B 458 409 53 81 17 3 12 46 44 143 11 3
Cooper Hummel B 31 DH 372 317 48 73 12 3 10 43 47 96 7 3
Kenny Piper R 27 C 305 271 35 51 9 1 9 35 24 93 5 0
Tre’ Morgan L 23 1B 406 351 45 89 12 2 6 41 47 79 5 3
Aidan Smith R 21 CF 477 430 69 92 18 2 13 55 39 161 21 4
Jonny DeLuca R 27 CF 332 302 37 71 12 3 8 35 23 66 10 2
Jamie Westbrook R 31 2B 434 385 44 94 19 0 8 50 36 79 1 1
Taylor Walls B 29 SS 345 304 43 65 13 2 5 31 35 79 14 4
Xavier Isaac L 22 DH 320 280 38 60 12 1 13 43 35 114 3 2
Gregory Barrios R 22 SS 393 366 46 89 13 0 1 32 17 57 20 6
Matt Thaiss L 31 C 273 233 25 52 9 1 5 26 34 67 2 0
Noah Myers L 26 LF 426 365 50 78 12 2 7 39 51 131 17 2
Ricardo Genovés R 27 C 238 216 23 44 9 0 5 26 17 76 0 0
Émilien Pitre L 23 2B 515 464 54 104 22 2 7 49 40 119 7 4
Brock Jones L 25 RF 360 316 43 59 12 2 13 44 35 152 12 5
Coco Montes R 29 LF 429 390 48 89 16 1 9 45 32 126 6 2
Colton Ledbetter L 24 RF 508 464 59 112 21 3 9 54 32 144 19 7
Cooper Kinney L 23 2B 501 469 52 112 20 2 12 56 26 135 1 2
Richie Palacios L 29 LF 369 323 45 74 13 1 5 34 38 70 12 3
Ryan Cermak R 25 RF 170 154 20 32 7 1 4 20 11 54 5 1
Adrian Santana B 20 SS 444 414 54 97 14 2 1 33 24 70 22 6
Nathan Flewelling L 19 C 484 414 41 71 19 2 7 42 58 167 4 2
Logan Davidson B 28 1B 436 387 49 85 16 1 10 50 42 142 4 2
Jake Fraley L 31 RF 326 291 38 69 12 0 7 34 30 66 11 4
Bryan Broecker R 24 C 222 191 19 34 5 0 2 16 25 71 2 0
Mac Horvath R 24 RF 449 401 64 87 14 0 13 49 41 111 19 5
Will Simpson R 24 1B 491 449 49 103 21 1 13 57 35 134 4 2
Daniel Vellojin L 26 C 290 258 22 47 7 1 5 24 26 85 2 1
Ryan Spikes R 23 3B 393 367 42 80 11 2 10 44 17 127 9 5
Tres Barrera R 31 C 261 236 23 47 5 0 6 26 18 68 1 0
Jalen Battles R 26 3B 258 238 28 48 6 0 2 20 13 79 3 3
Angel Mateo R 21 RF 485 447 50 100 21 1 8 53 25 118 9 5
Carlos Colmenarez L 22 3B 343 302 32 55 6 1 5 31 30 128 2 3
Kamren James R 26 LF 269 245 25 48 6 1 4 25 14 90 2 2
Hunter Haas R 24 3B 342 306 26 51 11 0 4 27 24 115 4 2
Jose Perez B 22 LF 216 188 18 34 3 1 1 15 19 52 3 2
Jhon Diaz L 23 RF 409 378 41 73 10 3 10 41 24 118 8 3
Brendan Summerhill R 24 1B 447 405 37 73 20 0 6 37 34 136 1 2

Batters – Advanced
Player PA BA OBP SLG OPS+ ISO BABIP Def WAR wOBA 3YOPS+ RC
Junior Caminero 637 .270 .322 .501 126 .231 .284 -2 3.9 .350 132 96
Yandy Díaz 585 .296 .368 .446 127 .150 .326 0 2.7 .354 121 86
Jonathan Aranda 449 .274 .354 .442 122 .168 .343 7 2.4 .346 121 62
Carson Williams 554 .221 .293 .398 92 .177 .309 6 2.3 .302 97 64
Jadher Areinamo 570 .257 .298 .384 90 .127 .282 7 1.8 .296 93 66
Josh Lowe 467 .267 .328 .440 113 .173 .344 0 1.8 .331 111 67
Dominic Keegan 390 .236 .300 .382 90 .145 .309 2 1.4 .298 92 40
Andrew Stevenson 368 .260 .318 .385 96 .125 .333 7 1.4 .309 95 47
Ryan Vilade 480 .252 .322 .389 99 .137 .317 6 1.4 .312 97 57
Cedric Mullins 478 .224 .298 .379 89 .155 .262 1 1.3 .297 86 54
Tatem Levins 355 .217 .311 .337 82 .120 .297 4 1.3 .290 83 33
Raynel Delgado 447 .255 .324 .345 88 .090 .328 2 1.3 .298 88 51
Homer Bush Jr. 512 .259 .320 .322 82 .063 .330 2 1.1 .288 83 56
Austin Overn 472 .232 .306 .354 85 .122 .335 -1 1.0 .292 90 54
Bob Seymour 486 .243 .298 .426 100 .183 .313 2 0.8 .312 103 58
Hunter Feduccia 393 .232 .318 .368 92 .136 .300 -6 0.8 .304 90 41
Chandler Simpson 558 .291 .328 .333 87 .042 .325 -7 0.8 .294 85 72
Hunter Stovall 382 .231 .276 .321 67 .090 .273 10 0.8 .264 68 34
Nick Fortes 294 .223 .285 .336 74 .113 .249 4 0.8 .276 74 26
Jacob Melton 368 .225 .285 .364 81 .139 .286 2 0.8 .285 86 41
Brayden Taylor 458 .198 .276 .342 72 .144 .272 7 0.7 .273 77 42
Cooper Hummel 372 .230 .339 .382 102 .152 .299 0 0.7 .320 99 44
Kenny Piper 305 .188 .269 .328 67 .140 .249 5 0.7 .266 69 25
Tre’ Morgan 406 .254 .347 .350 97 .096 .312 3 0.7 .312 100 45
Aidan Smith 477 .214 .285 .356 79 .142 .309 0 0.7 .283 87 50
Jonny DeLuca 332 .235 .299 .374 88 .139 .276 -1 0.6 .295 90 37
Jamie Westbrook 434 .244 .319 .356 89 .112 .289 -5 0.5 .300 87 44
Taylor Walls 345 .214 .294 .319 73 .105 .273 0 0.4 .275 73 33
Xavier Isaac 320 .214 .309 .404 98 .190 .307 0 0.4 .313 106 36
Gregory Barrios 393 .243 .284 .287 61 .044 .286 4 0.3 .255 63 36
Matt Thaiss 273 .223 .327 .335 87 .112 .292 -6 0.3 .299 83 26
Noah Myers 426 .214 .314 .315 78 .101 .313 3 0.3 .284 80 40
Ricardo Genovés 238 .204 .273 .315 65 .111 .289 3 0.3 .263 69 19
Émilien Pitre 515 .224 .289 .325 73 .101 .287 3 0.3 .272 77 47
Brock Jones 360 .187 .277 .361 77 .174 .305 5 0.2 .281 81 36
Coco Montes 429 .228 .291 .344 78 .116 .314 5 0.2 .281 77 41
Colton Ledbetter 508 .241 .294 .358 82 .117 .331 4 0.2 .285 86 56
Cooper Kinney 501 .239 .281 .367 80 .128 .311 -1 0.2 .283 84 49
Richie Palacios 369 .229 .315 .322 80 .093 .278 2 0.2 .286 82 36
Ryan Cermak 170 .208 .276 .344 73 .136 .292 4 0.2 .272 77 16
Adrian Santana 444 .234 .276 .285 58 .051 .280 5 0.2 .250 64 39
Nathan Flewelling 484 .171 .278 .278 57 .106 .267 4 0.2 .254 67 34
Logan Davidson 436 .220 .301 .344 81 .124 .319 6 0.2 .287 81 42
Jake Fraley 326 .237 .316 .351 87 .114 .284 0 0.1 .296 87 36
Bryan Broecker 222 .178 .282 .236 48 .058 .271 3 0.0 .244 51 13
Mac Horvath 449 .217 .290 .349 78 .132 .267 2 0.0 .282 84 46
Will Simpson 491 .229 .286 .367 82 .138 .298 3 -0.2 .286 85 49
Daniel Vellojin 290 .182 .264 .275 52 .093 .250 -1 -0.4 .245 53 20
Ryan Spikes 393 .218 .261 .341 67 .123 .304 0 -0.4 .263 71 37
Tres Barrera 261 .199 .266 .297 58 .098 .253 -3 -0.4 .253 55 19
Jalen Battles 258 .202 .254 .252 43 .050 .293 4 -0.6 .229 45 17
Angel Mateo 485 .224 .276 .329 69 .105 .287 3 -0.7 .267 75 45
Carlos Colmenarez 343 .182 .271 .258 50 .076 .296 1 -0.8 .244 58 23
Kamren James 269 .196 .256 .278 50 .082 .291 -1 -1.3 .240 52 19
Hunter Haas 342 .167 .239 .242 36 .075 .251 2 -1.4 .220 39 19
Jose Perez 216 .181 .268 .223 41 .043 .244 -4 -1.5 .230 45 13
Jhon Diaz 409 .193 .245 .315 56 .122 .252 -1 -1.6 .246 61 32
Brendan Summerhill 447 .180 .248 .274 47 .094 .255 -1 -2.4 .235 51 29

Batters – Top Near-Age Offensive Comps
Player Hit Comp 1 Hit Comp 2 Hit Comp 3
Junior Caminero Earl Williams Bob Horner Hank Majeski
Yandy Díaz Mark Grace Earl Sheely Don Mattingly
Jonathan Aranda Troy Neel Ji Man Choi Jeremy Giambi
Carson Williams Denny Gonzalez Jazz Chisholm Jr. Trevor Story
Jadher Areinamo Cesar Bernhardt Brent Abernathy Miguel Flores
Josh Lowe Todd Hollandsworth Carl Everett Hiram Bocachica
Dominic Keegan Henry Blanco Harry Chiti Jack Fimple
Andrew Stevenson Kevin Kiermaier Bubba Morton Vince Coleman
Ryan Vilade Rick Bladt Abraham Almonte Chris Jones
Cedric Mullins Oddibe McDowell Rod Craig Eddie Milner
Tatem Levins Tom Wilson Mike Mordarski Lloyd Jenney
Raynel Delgado Willie Harris Tyler Wade Jermaine Clark
Homer Bush Jr. Kyle Wren Dee Dixon Bo Way
Austin Overn Eddie Evans Chris Latham Dave Krynzel
Bob Seymour Steve Whitaker Gary Holle Andres Galarraga
Hunter Feduccia Tim Blackwell Doug Mirabelli Mike Maksudian
Chandler Simpson Ben Revere Juan Pierre Brandon Watson
Hunter Stovall Angelys Nina Rusty Hamric Vic Gutierrez
Nick Fortes Bob Didier Woody Huyke Steve Lake
Jacob Melton Blake Tekotte Tito Landrum Brody Jackson
Brayden Taylor Steve Lyons Andy Fox Steven Green
Cooper Hummel Mike Hegan Larry Harlow Willie Harris
Kenny Piper Al Grandcolas Jeffery Tipton Jeff Mathis
Tre’ Morgan Mike Twardoski Kevin Seitzer Mike Hart
Aidan Smith Alonzo Powell Ed Moxey Pat Bryant
Jonny DeLuca Leon Culberson Lloyd Merriman Harrison Kain
Jamie Westbrook Buddy Hunter Bret Barberie Andy Cannizaro
Taylor Walls Cleatus Davidson Dave Owen Matt Williams
Xavier Isaac Kenneth McGregor Dave Revering Nick Castaneda
Gregory Barrios Wladimir Sutil Pedro Lopez Grenny Cumana
Matt Thaiss Duffy Dyer Bud Bulling Rick Stelmaszek
Noah Myers Randy Curtis Willie Argo Logan Vick
Ricardo Genovés Brad Cresse Jeff Hearron Juan Espino
Émilien Pitre Tim Krauss Josh VanMeter Bobby Klaus
Brock Jones Luis Silverio Anthony Lachowetz Eli Ben
Coco Montes Ezell Carter Don Grate Santiago Rosario
Colton Ledbetter Kory DeHaan Stephen Wrenn Jason Repko
Cooper Kinney Antoin Gray Trent Gilbert Riley Mahan
Richie Palacios Adam Klein Gerald Young Josh Johnson
Ryan Cermak Raymond Goirigolzarri Bob Luzon Evandy De Leon
Adrian Santana Guillermo Reyes Omar Obregon Jesus Aristimuno
Nathan Flewelling Mark Johnson William Madden Pat Corrales
Logan Davidson Lawrence Clayton Mike Wishnevski Harvey Zernia
Jake Fraley John Lowenstein James Mouton Thurman Tucker
Bryan Broecker Orlando Thomas Scott Meier Bryan Graves
Mac Horvath Jim Weaver Tom Perdue Dylan Moore
Will Simpson Brandon Gemoll Steve Hazlett Domingo Martinez
Daniel Vellojin Kerry Baker Larry Rancourt Ben Margalski
Ryan Spikes Kim Batiste Ryan Ritter Joe Jarrell
Tres Barrera Jimmy Gonzalez Angel Flores Matt Pagnozzi
Jalen Battles Travis Weaver Battle Holley Asbel Ortiz
Angel Mateo Scott Hunter Tom Wiedenbauer Francisco Tenacen
Carlos Colmenarez Danny Simons Ryan Dineen Bob McKillop
Kamren James Tony Hill Gage Green Jose Alou
Hunter Haas Jason Camilli Das Jesson Don Cohoon
Jose Perez Bob Gutierrez David Hollifield Jake Thomas
Jhon Diaz Bobby Kingsbury Cody Rogers Harvey Brumfield
Brendan Summerhill Randy Recor Josh Kreuzer Mike Paciorek

Batters – 80th/20th Percentiles
Player 80th BA 80th OBP 80th SLG 80th OPS+ 80th WAR 20th BA 20th OBP 20th SLG 20th OPS+ 20th WAR
Junior Caminero .298 .349 .567 148 5.6 .241 .292 .438 102 1.8
Yandy Díaz .326 .395 .492 144 3.9 .269 .342 .408 110 1.4
Jonathan Aranda .302 .382 .497 143 3.5 .245 .322 .395 101 1.3
Carson Williams .251 .322 .458 115 3.8 .193 .265 .343 70 0.8
Jadher Areinamo .282 .325 .428 108 3.2 .228 .273 .333 71 0.5
Josh Lowe .296 .358 .493 133 2.9 .238 .301 .393 93 0.5
Dominic Keegan .266 .326 .427 107 2.3 .208 .271 .335 71 0.6
Andrew Stevenson .292 .348 .436 117 2.3 .234 .290 .337 76 0.5
Ryan Vilade .280 .347 .434 116 2.4 .225 .295 .341 79 0.2
Cedric Mullins .248 .328 .432 109 2.5 .193 .269 .323 67 0.1
Tatem Levins .245 .343 .386 101 2.1 .189 .283 .293 63 0.5
Raynel Delgado .284 .351 .382 105 2.2 .228 .296 .306 72 0.3
Homer Bush Jr. .285 .349 .363 98 2.2 .229 .291 .290 63 -0.1
Austin Overn .260 .333 .400 104 2.1 .201 .280 .309 68 -0.1
Bob Seymour .270 .320 .484 120 2.1 .214 .268 .372 78 -0.5
Hunter Feduccia .261 .350 .410 111 1.7 .207 .291 .315 73 -0.1
Chandler Simpson .322 .359 .367 105 2.2 .258 .299 .294 69 -0.5
Hunter Stovall .258 .306 .361 84 1.6 .205 .252 .280 50 -0.1
Nick Fortes .258 .319 .402 99 1.7 .191 .254 .292 53 0.0
Jacob Melton .250 .313 .414 100 1.7 .197 .259 .317 61 -0.2
Brayden Taylor .221 .300 .390 91 1.8 .170 .252 .299 54 -0.3
Cooper Hummel .259 .367 .436 123 1.6 .208 .310 .331 81 -0.2
Kenny Piper .216 .299 .386 88 1.6 .162 .241 .282 47 0.0
Tre’ Morgan .280 .376 .394 114 1.6 .222 .314 .311 76 -0.3
Aidan Smith .243 .311 .398 97 1.7 .191 .258 .311 61 -0.4
Jonny DeLuca .262 .325 .432 108 1.4 .209 .271 .329 70 -0.2
Jamie Westbrook .271 .346 .397 107 1.5 .218 .294 .315 72 -0.4
Taylor Walls .240 .326 .368 93 1.4 .188 .265 .279 53 -0.3
Xavier Isaac .244 .339 .460 119 1.3 .185 .282 .342 74 -0.5
Gregory Barrios .274 .312 .326 79 1.3 .218 .259 .257 46 -0.5
Matt Thaiss .254 .359 .380 107 1.0 .195 .296 .288 67 -0.3
Noah Myers .242 .342 .361 97 1.2 .184 .286 .274 60 -0.7
Ricardo Genovés .235 .306 .369 88 1.0 .176 .242 .265 43 -0.3
Émilien Pitre .249 .313 .359 87 1.2 .196 .263 .285 54 -0.9
Brock Jones .216 .302 .419 97 1.1 .156 .247 .299 53 -0.8
Coco Montes .259 .322 .396 101 1.4 .199 .259 .306 58 -0.9
Colton Ledbetter .265 .320 .401 99 1.2 .214 .271 .321 65 -0.8
Cooper Kinney .265 .308 .410 99 1.4 .214 .258 .327 65 -0.7
Richie Palacios .256 .343 .362 98 1.0 .205 .290 .283 63 -0.6
Ryan Cermak .239 .310 .400 95 0.7 .178 .248 .298 53 -0.2
Adrian Santana .261 .305 .324 75 1.3 .209 .252 .249 42 -0.8
Nathan Flewelling .202 .307 .331 81 1.5 .141 .246 .230 40 -1.0
Logan Davidson .248 .330 .395 102 1.3 .192 .270 .298 62 -0.9
Jake Fraley .269 .347 .401 109 1.0 .211 .289 .304 67 -0.6
Bryan Broecker .208 .314 .275 67 0.6 .147 .250 .198 30 -0.4
Mac Horvath .249 .314 .399 97 1.1 .191 .262 .295 56 -1.2
Will Simpson .252 .312 .407 99 0.8 .201 .261 .319 63 -1.4
Daniel Vellojin .209 .295 .326 72 0.4 .156 .237 .240 37 -0.9
Ryan Spikes .245 .285 .393 86 0.5 .188 .230 .294 46 -1.5
Tres Barrera .228 .296 .354 78 0.2 .171 .237 .258 40 -1.0
Jalen Battles .230 .283 .288 62 0.0 .174 .225 .217 26 -1.2
Angel Mateo .251 .302 .367 86 0.4 .196 .250 .285 50 -1.7
Carlos Colmenarez .215 .298 .318 73 0.1 .154 .239 .212 30 -1.7
Kamren James .222 .283 .315 67 -0.7 .170 .229 .234 33 -1.9
Hunter Haas .194 .264 .283 52 -0.6 .139 .212 .206 17 -2.1
Jose Perez .214 .299 .262 58 -1.0 .154 .241 .190 24 -1.9
Jhon Diaz .222 .275 .358 75 -0.6 .170 .224 .271 38 -2.5
Brendan Summerhill .207 .274 .313 64 -1.5 .155 .224 .238 30 -3.4

Batters – Platoon Splits
Player BA vs. L OBP vs. L SLG vs. L BA vs. R OBP vs. R SLG vs. R
Junior Caminero .282 .338 .537 .265 .314 .485
Yandy Díaz .304 .380 .475 .293 .362 .434
Jonathan Aranda .262 .343 .397 .280 .359 .463
Carson Williams .224 .299 .415 .219 .291 .390
Jadher Areinamo .263 .306 .388 .255 .295 .382
Josh Lowe .256 .314 .416 .272 .334 .450
Dominic Keegan .242 .309 .404 .234 .296 .373
Andrew Stevenson .255 .311 .378 .263 .321 .388
Ryan Vilade .265 .335 .406 .245 .314 .380
Cedric Mullins .213 .281 .352 .228 .305 .389
Tatem Levins .210 .301 .296 .219 .314 .351
Raynel Delgado .233 .299 .310 .264 .333 .359
Homer Bush Jr. .261 .324 .321 .258 .318 .323
Austin Overn .235 .305 .330 .231 .307 .363
Bob Seymour .236 .286 .415 .246 .303 .431
Hunter Feduccia .214 .294 .348 .240 .330 .378
Chandler Simpson .274 .308 .319 .297 .336 .339
Hunter Stovall .235 .287 .319 .229 .271 .322
Nick Fortes .229 .292 .365 .219 .281 .320
Jacob Melton .211 .276 .322 .230 .289 .379
Brayden Taylor .191 .260 .322 .201 .282 .350
Cooper Hummel .232 .336 .393 .229 .340 .376
Kenny Piper .200 .286 .350 .183 .262 .319
Tre’ Morgan .239 .330 .304 .259 .353 .367
Aidan Smith .218 .295 .368 .212 .280 .350
Jonny DeLuca .241 .307 .379 .231 .294 .371
Jamie Westbrook .250 .324 .371 .241 .316 .348
Taylor Walls .219 .290 .344 .212 .297 .308
Xavier Isaac .203 .292 .354 .219 .316 .423
Gregory Barrios .243 .287 .280 .243 .283 .290
Matt Thaiss .222 .313 .306 .224 .333 .348
Noah Myers .202 .296 .298 .218 .319 .321
Ricardo Genovés .215 .287 .329 .197 .265 .307
Émilien Pitre .209 .278 .310 .230 .294 .331
Brock Jones .169 .264 .338 .192 .280 .368
Coco Montes .231 .299 .346 .227 .288 .342
Colton Ledbetter .224 .277 .328 .248 .300 .369
Cooper Kinney .230 .269 .357 .242 .286 .370
Richie Palacios .231 .311 .297 .228 .317 .332
Ryan Cermak .208 .283 .313 .208 .274 .358
Adrian Santana .239 .275 .274 .233 .276 .289
Nathan Flewelling .159 .262 .257 .176 .284 .286
Logan Davidson .213 .289 .346 .223 .307 .343
Jake Fraley .222 .300 .292 .242 .321 .370
Bryan Broecker .190 .309 .276 .173 .270 .218
Mac Horvath .222 .298 .359 .215 .286 .345
Will Simpson .231 .297 .373 .229 .281 .365
Daniel Vellojin .171 .253 .268 .188 .269 .278
Ryan Spikes .223 .267 .357 .216 .258 .333
Tres Barrera .205 .279 .308 .196 .260 .291
Jalen Battles .200 .253 .271 .202 .254 .244
Angel Mateo .226 .281 .323 .223 .274 .331
Carlos Colmenarez .173 .264 .222 .186 .273 .271
Kamren James .205 .266 .274 .192 .251 .279
Hunter Haas .169 .242 .236 .166 .238 .244
Jose Perez .182 .258 .200 .180 .272 .233
Jhon Diaz .184 .234 .282 .196 .249 .327
Brendan Summerhill .188 .264 .286 .176 .240 .268

Pitchers – Standard
Player T Age W L ERA G GS IP H ER HR BB SO
Drew Rasmussen R 30 8 6 3.56 29 28 136.7 120 54 16 35 116
Shane McClanahan L 29 8 5 3.31 20 20 111.3 95 41 13 30 117
Ryan Pepiot R 28 10 9 4.08 27 27 143.3 121 65 21 51 142
Griffin Jax R 31 6 3 2.73 68 1 66.0 51 20 6 17 88
Joe Boyle R 26 7 8 4.21 27 23 113.3 94 53 13 63 126
Ian Seymour L 27 7 8 4.33 29 19 120.7 111 58 18 35 115
Joe Rock L 25 5 6 4.30 29 17 106.7 108 51 13 35 85
Ty Johnson R 24 6 6 4.00 25 18 94.0 84 44 12 33 94
Brian Van Belle R 29 6 7 4.38 24 16 102.7 111 50 15 22 72
Steven Matz L 35 3 3 3.84 35 7 65.7 66 28 8 17 61
Michael Forret R 22 4 4 4.52 25 21 89.7 85 45 12 34 78
Logan Workman R 27 6 8 4.73 25 24 123.7 127 65 20 36 95
Garrett Cleavinger L 32 5 3 3.30 61 0 57.3 43 21 7 20 72
T.J. Nichols R 24 6 9 4.68 22 20 105.7 107 55 16 29 86
Yoendrys Gómez R 26 5 5 4.44 30 19 93.3 84 46 14 39 92
Edwin Uceta R 28 6 4 3.69 59 0 70.7 56 29 9 27 87
Mason Englert R 26 3 2 3.97 38 5 70.3 66 31 9 19 66
Brody Hopkins R 24 5 6 4.73 24 24 104.7 99 55 14 48 92
Jesse Scholtens R 32 3 3 4.52 21 14 75.7 78 38 11 25 63
Kyle Gibson R 38 6 8 4.88 22 22 120.0 128 65 18 47 102
Jake Woodford

R 29 4 6 4.70 30 12 92.0 96 48 11 30 67
Caleb Boushley R 32 3 5 4.67 28 14 90.7 99 47 12 27 65
Kevin Kelly R 28 4 4 3.81 56 1 59.0 53 25 7 13 53
Santiago Suarez R 21 4 5 4.94 18 18 82.0 87 45 14 21 59
Alex Faedo R 30 3 4 4.53 23 10 59.7 56 30 8 24 53
Forrest Whitley R 28 4 5 4.42 26 9 57.0 52 28 7 25 57
Ty Cummings R 24 4 6 4.93 25 19 107.7 116 59 15 37 67
Osvaldo Bido R 30 4 6 4.93 26 14 91.3 89 50 14 39 81
Bryan Baker R 31 4 3 3.94 61 0 59.3 50 26 8 21 65
Manuel Rodríguez R 29 3 3 4.01 42 0 42.7 39 19 4 15 38
Cole Sulser R 36 2 3 4.26 39 1 44.3 44 21 6 15 39
Trevor Martin R 25 4 5 4.91 30 12 77.0 81 42 13 26 62
John Rooney L 29 3 3 4.50 41 3 52.0 47 26 6 25 52
Owen Wild R 23 5 7 5.23 21 21 96.3 102 56 17 33 71
Jonathan Hernández R 29 2 2 4.50 39 1 46.0 45 23 5 24 41
Kodi Whitley R 31 2 2 4.21 29 0 36.3 35 17 5 11 33
Alex Cook R 25 2 3 4.58 20 2 35.3 35 18 6 14 32
Jackson Baumeister R 23 2 4 5.30 19 19 73.0 75 43 12 31 54
Roel Garcia III R 27 3 4 5.12 19 8 58.0 63 33 10 18 40
Sean Hunley R 26 3 5 5.05 26 7 66.0 72 37 10 20 38
Hunter Bigge R 28 1 2 4.29 32 0 35.7 33 17 5 18 36
Evan Reifert R 27 2 3 4.70 31 1 30.7 26 16 4 18 34
Tommy McCollum R 27 2 2 4.53 44 0 47.7 47 24 6 20 41
Peter Strzelecki R 31 2 2 4.82 33 0 37.3 37 20 5 17 31
Derrick Edington R 26 3 3 4.53 44 0 49.7 49 25 6 19 40
Jacob Watters R 25 3 5 5.59 13 10 48.3 50 30 7 26 36
Mike Flynn R 29 1 2 4.99 27 1 30.7 29 17 4 14 28
Steven Wilson R 31 2 2 4.73 55 0 53.3 46 28 9 24 52
Austin Vernon R 27 3 4 5.08 31 3 51.3 49 29 8 30 49
Jack Snyder R 27 2 2 5.09 26 0 35.3 38 20 5 17 27
Luis Guerrero R 25 3 3 4.86 42 0 50.0 45 27 7 28 44
Jack Hartman R 27 2 3 5.12 33 0 38.7 41 22 6 18 28
Jackson Lancaster L 27 2 4 4.95 27 0 40.0 41 22 6 17 32
Ryan Shreve R 28 4 5 5.09 31 1 58.3 65 33 8 24 33
Dan Hammer R 28 2 4 5.75 27 2 40.7 42 26 6 28 32
Keyshawn Askew L 26 2 4 5.54 32 3 50.3 48 31 6 33 40
Jonny Cuevas R 25 2 5 5.60 30 2 53.0 59 33 9 26 31

Pitchers – Advanced
Player IP K/9 BB/9 HR/9 BB% K% BABIP ERA+ 3ERA+ FIP ERA- WAR
Drew Rasmussen 136.7 7.6 2.3 1.1 6.3% 20.7% .268 115 112 3.84 87 2.6
Shane McClanahan 111.3 9.5 2.4 1.1 6.6% 25.6% .281 123 119 3.44 81 2.4
Ryan Pepiot 143.3 8.9 3.2 1.3 8.6% 23.9% .265 100 101 4.32 100 1.9
Griffin Jax 66.0 12.0 2.3 0.8 6.4% 33.3% .298 150 138 2.54 67 1.6
Joe Boyle 113.3 10.0 5.0 1.0 12.6% 25.2% .281 97 98 4.28 103 1.3
Ian Seymour 120.7 8.6 2.6 1.3 7.0% 22.9% .280 94 95 4.27 106 1.2
Joe Rock 106.7 7.2 3.0 1.1 7.6% 18.5% .295 95 99 4.28 105 1.1
Ty Johnson 94.0 9.0 3.2 1.1 8.3% 23.7% .283 97 99 4.16 103 1.1
Brian Van Belle 102.7 6.3 1.9 1.3 5.0% 16.5% .296 93 94 4.39 107 1.0
Steven Matz 65.7 8.4 2.3 1.1 6.1% 22.0% .307 106 99 3.76 94 0.9
Michael Forret 89.7 7.8 3.4 1.2 8.8% 20.2% .283 90 96 4.50 111 0.8
Logan Workman 123.7 6.9 2.6 1.5 6.8% 18.0% .286 86 89 4.70 116 0.8
Garrett Cleavinger 57.3 11.3 3.1 1.1 8.5% 30.8% .271 124 117 3.60 81 0.8
T.J. Nichols 105.7 7.3 2.5 1.4 6.4% 19.1% .290 87 92 4.47 115 0.8
Yoendrys Gómez 93.3 8.9 3.8 1.4 9.8% 23.0% .278 92 94 4.59 109 0.8
Edwin Uceta 70.7 11.1 3.4 1.1 9.2% 29.8% .280 110 110 3.76 91 0.7
Mason Englert 70.3 8.4 2.4 1.2 6.5% 22.5% .289 103 107 3.89 97 0.7
Brody Hopkins 104.7 7.9 4.1 1.2 10.4% 19.9% .283 86 91 4.86 116 0.7
Jesse Scholtens 75.7 7.5 3.0 1.3 7.6% 19.2% .296 90 87 4.46 111 0.6
Kyle Gibson 120.0 7.7 3.5 1.4 8.9% 19.2% .306 84 77 4.69 120 0.6
Jake Woodford 92.0 6.6 2.9 1.1 7.5% 16.8% .296 87 87 4.44 115 0.5
Caleb Boushley 90.7 6.4 2.7 1.2 6.9% 16.5% .303 87 86 4.41 115 0.5
Kevin Kelly 59.0 8.1 2.0 1.1 5.4% 22.0% .277 107 109 3.93 93 0.5
Santiago Suarez 82.0 6.5 2.3 1.5 6.0% 16.9% .287 83 90 4.75 121 0.4
Alex Faedo 59.7 8.0 3.6 1.2 9.3% 20.5% .282 90 89 4.44 111 0.4
Forrest Whitley 57.0 9.0 3.9 1.1 10.2% 23.2% .290 92 94 4.29 109 0.4
Ty Cummings 107.7 5.6 3.1 1.3 7.9% 14.2% .290 83 87 4.90 120 0.4
Osvaldo Bido 91.3 8.0 3.8 1.4 9.8% 20.4% .287 83 83 4.96 121 0.3
Bryan Baker 59.3 9.9 3.2 1.2 8.5% 26.3% .278 103 101 3.84 97 0.3
Manuel Rodríguez 42.7 8.0 3.2 0.8 8.3% 21.0% .287 102 102 3.94 98 0.3
Cole Sulser 44.3 7.9 3.0 1.2 7.9% 20.6% .295 96 88 4.25 104 0.2
Trevor Martin 77.0 7.2 3.0 1.5 7.7% 18.5% .294 83 88 4.92 120 0.2
John Rooney 52.0 9.0 4.3 1.0 11.0% 22.9% .291 91 91 4.51 110 0.2
Owen Wild 96.3 6.6 3.1 1.6 7.9% 16.9% .287 78 84 5.07 128 0.1
Jonathan Hernández 46.0 8.0 4.7 1.0 11.7% 19.9% .299 91 92 4.49 110 0.1
Kodi Whitley 36.3 8.2 2.7 1.2 7.2% 21.6% .291 97 94 4.13 103 0.1
Alex Cook 35.3 8.2 3.6 1.5 9.0% 20.6% .290 89 94 4.83 112 0.1
Jackson Baumeister 73.0 6.7 3.8 1.5 9.5% 16.6% .284 77 83 5.30 130 0.0
Roel Garcia III 58.0 6.2 2.8 1.6 7.1% 15.8% .291 80 82 5.11 126 0.0
Sean Hunley 66.0 5.2 2.7 1.4 7.0% 13.3% .286 81 84 5.16 124 0.0
Hunter Bigge 35.7 9.1 4.5 1.3 11.3% 22.6% .289 95 95 4.57 105 0.0
Evan Reifert 30.7 10.0 5.3 1.2 12.9% 24.3% .282 87 91 4.89 115 0.0
Tommy McCollum 47.7 7.7 3.8 1.1 9.5% 19.4% .293 90 91 4.59 111 -0.1
Peter Strzelecki 37.3 7.5 4.1 1.2 10.4% 18.9% .291 85 84 4.85 118 -0.1
Derrick Edington 49.7 7.2 3.4 1.1 8.8% 18.4% .291 90 94 4.45 111 -0.1
Jacob Watters 48.3 6.7 4.8 1.3 11.8% 16.3% .291 73 80 5.42 137 -0.1
Mike Flynn 30.7 8.2 4.1 1.2 10.3% 20.6% .287 82 81 4.89 122 -0.1
Steven Wilson 53.3 8.8 4.1 1.5 10.5% 22.8% .262 86 85 4.93 116 -0.2
Austin Vernon 51.3 8.6 5.3 1.4 12.8% 20.9% .289 80 83 5.21 125 -0.2
Jack Snyder 35.3 6.9 4.3 1.3 10.6% 16.9% .303 80 83 5.00 125 -0.3
Luis Guerrero 50.0 7.9 5.0 1.3 12.6% 19.7% .271 84 88 5.14 119 -0.3
Jack Hartman 38.7 6.5 4.2 1.4 10.2% 15.9% .292 80 82 5.21 125 -0.3
Jackson Lancaster 40.0 7.2 3.8 1.4 9.5% 17.9% .292 82 85 4.94 122 -0.3
Ryan Shreve 58.3 5.1 3.7 1.2 9.2% 12.6% .294 80 81 5.10 125 -0.4
Dan Hammer 40.7 7.1 6.2 1.3 14.5% 16.6% .293 71 72 5.79 141 -0.5
Keyshawn Askew 50.3 7.2 5.9 1.1 13.9% 16.9% .282 74 76 5.69 135 -0.5
Jonny Cuevas 53.0 5.3 4.4 1.5 10.7% 12.8% .287 73 78 5.73 137 -0.5

Pitchers – Top Near-Age Comps
Player Pit Comp 1 Pit Comp 2 Pit Comp 3
Drew Rasmussen Jordan Zimmermann Bob Welch Johnny Cueto
Shane McClanahan Carl Hubbell Harry Brecheen Juan Pizarro
Ryan Pepiot Josh Beckett Pete Harnisch Ron Darling
Griffin Jax Liam Hendriks Rollie Fingers Heath Bell
Joe Boyle Jose De Jesus Daniel Cabrera Rick Ownbey
Ian Seymour Curt Young Matthew Boyd Allen Watson
Joe Rock Kevin Bearse Atlee Hammaker Pete Kendrick
Ty Johnson Pete Smith Kent Greenfield Paul Wilson
Brian Van Belle Adrian Sampson Bryan Rekar Bill Long
Steven Matz Bob Patterson Al Brazle Larry French
Michael Forret Roger Nelson Todd Burns Joe Edelen
Logan Workman Nick Kingham Sid Hudson Dereck Rodríguez
Garrett Cleavinger Al Holland Jesse Orosco John Hiller
T.J. Nichols Mike Pitz Donald Callaway Brian Keller
Yoendrys Gómez Claudio Vargas Randall Delgado Robert Person
Edwin Uceta Jim Brosnan David Hernandez Xavier Hernandez
Mason Englert Randy St. Claire Keefe Cato Edgar Santana
Brody Hopkins Chance Adams Zac Paris Brian Holman
Jesse Scholtens Mike Gardiner Hank Borowy Mitch Wylie
Kyle Gibson Manny Perez Jackie Brown Rick Sutcliffe
Jake Woodford Philip Humber Bruce Billings Matt Bruback
Caleb Boushley Josh Geer Jose Mercedes Daniel McCutchen
Kevin Kelly Huck Betts Cris Carpenter Jose Cabrera
Santiago Suarez Erik Des Rosiers Lachlan Wells Steve Woodard
Alex Faedo Jim Dickson Jim Winford Ralph Branca
Forrest Whitley Frank Wills Jose Pena Jonathan Johnson
Ty Cummings Chase De Jong Sean O’Sullivan Aaron Slegers
Osvaldo Bido Brad Lincoln Joe Coleman Bennie Daniels
Bryan Baker Moe Drabowsky Scott Proctor Jeff Reardon
Manuel Rodríguez Danys Baez Brandon League Danny Kolb
Cole Sulser Lindy McDaniel Ted Power Dyar Miller
Trevor Martin Eric Glaser Brian Carpenter Carlos Ladeuth
John Rooney Dusty Hughes Dennis Miscik Mike Mohler
Owen Wild David Morgan Benton Moss Jake Walsh
Jonathan Hernández Adam Russell Jimmy Cordero Blaine Boyer
Kodi Whitley Bill Faul T.J. Mathews Mike Browning
Alex Cook Ron Kaufman David Hansen John Birtwell
Jackson Baumeister Larry Yellen Pablo Arias Matt White
Roel Garcia III Mike McTamney Conrad Flynn Delbert Bandy
Sean Hunley Dennis Ribant Tyler Waldron Dom DeSantis
Hunter Bigge Joey McLaughlin Chad Harville Fred Lasher
Evan Reifert Marc Kroon Robert Bishop Wilfrido Cordoba
Tommy McCollum Elvys Quezada Edwin Salas Marco Mainini
Peter Strzelecki Vinnie Chulk Oscar Villarreal Gary Waslewski
Derrick Edington Elvys Quezada Geoff Broussard Peter Palermo
Jacob Watters Kiki Jones Myron Gardner Steven Norwood
Mike Flynn John Lamb Daryl Patterson Duane Shaffer
Steven Wilson Vicente Romo Scott Proctor Alexi Ogando
Austin Vernon Barry Armitage Ryan Keefer Julio Solano
Jack Snyder Joe Maskivish Clint Gould MacKenzie King
Luis Guerrero Renie Martin Roman Mendez Scott Oberg
Jack Hartman Matt Davis Angel Aragon Michael Young
Jackson Lancaster Charlie Rogers Jake Drehoff Stephen Peterson
Ryan Shreve Hector Ramirez Steve Marsden Ricky Brooks
Dan Hammer Tad Slowik Dumas Garcia Luis Vasquez
Keyshawn Askew Mark Bowden Sean Keselica Gil Blanco
Jonny Cuevas Starlin Peralta Steve Chamberlain Greg Holt

Pitchers – Splits and Percentiles
Player BA vs. L OBP vs. L SLG vs. L BA vs. R OBP vs. R SLG vs. R 80th WAR 20th WAR 80th ERA 20th ERA
Drew Rasmussen .237 .295 .378 .234 .280 .387 3.3 1.7 3.09 4.17
Shane McClanahan .237 .287 .333 .225 .278 .385 3.1 1.6 2.78 4.00
Ryan Pepiot .219 .310 .384 .234 .296 .410 2.9 0.8 3.56 4.83
Griffin Jax .216 .279 .315 .199 .247 .338 2.4 0.6 1.89 4.29
Joe Boyle .220 .333 .364 .222 .325 .370 2.3 0.1 3.64 5.04
Ian Seymour .240 .306 .377 .239 .301 .430 2.0 0.3 3.77 4.93
Joe Rock .267 .320 .400 .251 .318 .415 1.8 0.2 3.77 5.00
Ty Johnson .249 .332 .399 .220 .293 .387 1.8 0.3 3.61 4.93
Brian Van Belle .268 .313 .443 .269 .305 .443 1.7 0.4 3.88 4.91
Steven Matz .262 .314 .354 .250 .297 .418 1.5 0.2 3.11 5.05
Michael Forret .252 .335 .423 .238 .306 .395 1.4 0.2 3.98 5.16
Logan Workman .266 .326 .448 .253 .300 .448 1.7 0.1 4.13 5.28
Garrett Cleavinger .203 .295 .319 .212 .297 .380 1.4 0.0 2.59 4.30
T.J. Nichols .266 .312 .478 .245 .307 .389 1.4 0.0 4.18 5.37
Yoendrys Gómez .242 .323 .433 .230 .315 .393 1.4 0.1 3.89 5.05
Edwin Uceta .216 .308 .360 .212 .292 .372 1.4 -0.2 2.90 4.75
Mason Englert .224 .279 .384 .259 .313 .408 1.2 0.1 3.24 4.78
Brody Hopkins .249 .335 .421 .240 .344 .394 1.3 0.0 4.31 5.21
Jesse Scholtens .269 .336 .433 .251 .304 .437 1.2 0.1 3.86 5.17
Kyle Gibson .278 .351 .452 .253 .316 .436 1.3 -0.3 4.31 5.69
Jake Woodford .263 .326 .419 .260 .324 .415 1.1 -0.1 4.16 5.27
Caleb Boushley .282 .348 .448 .260 .298 .422 1.1 0.0 4.06 5.34
Kevin Kelly .247 .304 .398 .229 .292 .382 1.0 0.0 3.19 4.57
Santiago Suarez .253 .299 .425 .273 .315 .486 0.9 -0.2 4.32 5.73
Alex Faedo .239 .315 .381 .250 .323 .431 0.8 -0.2 3.95 5.35
Forrest Whitley .248 .336 .416 .227 .311 .370 0.9 0.0 3.74 5.23
Ty Cummings .260 .332 .431 .275 .328 .441 1.0 -0.2 4.48 5.42
Osvaldo Bido .252 .344 .459 .249 .330 .406 1.0 -0.4 4.31 5.65
Bryan Baker .225 .298 .392 .225 .288 .383 0.9 -0.4 3.06 5.16
Manuel Rodríguez .271 .354 .443 .217 .291 .326 0.6 -0.2 3.33 4.95
Cole Sulser .238 .297 .381 .270 .333 .461 0.6 -0.3 3.44 5.40
Trevor Martin .246 .312 .437 .277 .339 .476 0.7 -0.4 4.32 5.58
John Rooney .221 .338 .338 .242 .340 .409 0.6 -0.4 3.86 5.47
Owen Wild .275 .345 .500 .256 .305 .429 0.7 -0.5 4.75 5.83
Jonathan Hernández .268 .362 .427 .232 .325 .364 0.4 -0.4 3.95 5.34
Kodi Whitley .266 .329 .453 .234 .286 .390 0.4 -0.3 3.42 5.31
Alex Cook .238 .324 .460 .270 .329 .446 0.4 -0.3 3.91 5.48
Jackson Baumeister .278 .366 .466 .247 .320 .448 0.5 -0.6 4.79 6.00
Roel Garcia III .271 .336 .467 .268 .319 .457 0.4 -0.4 4.55 5.82
Sean Hunley .276 .338 .470 .269 .333 .446 0.4 -0.4 4.52 5.56
Hunter Bigge .224 .316 .448 .250 .337 .375 0.2 -0.4 3.72 5.26
Evan Reifert .216 .355 .392 .234 .351 .391 0.2 -0.3 4.04 5.54
Tommy McCollum .233 .327 .372 .267 .342 .446 0.3 -0.5 3.89 5.30
Peter Strzelecki .288 .382 .515 .222 .304 .346 0.2 -0.5 4.14 5.74
Derrick Edington .245 .321 .404 .255 .325 .402 0.3 -0.4 3.97 5.04
Jacob Watters .270 .368 .420 .247 .343 .441 0.2 -0.5 5.13 6.39
Mike Flynn .232 .338 .393 .250 .347 .422 0.1 -0.5 4.22 6.06
Steven Wilson .244 .359 .397 .229 .303 .449 0.3 -0.8 3.98 5.69
Austin Vernon .239 .364 .435 .255 .344 .425 0.2 -0.7 4.45 5.92
Jack Snyder .271 .363 .471 .257 .325 .405 0.0 -0.6 4.55 6.11
Luis Guerrero .256 .368 .456 .222 .328 .364 0.0 -0.7 4.41 5.71
Jack Hartman .288 .373 .466 .244 .315 .427 -0.1 -0.7 4.65 5.94
Jackson Lancaster .255 .333 .353 .262 .339 .477 0.0 -0.6 4.41 5.82
Ryan Shreve .275 .353 .431 .278 .336 .459 0.0 -0.8 4.61 5.79
Dan Hammer .267 .389 .467 .253 .365 .414 -0.1 -0.9 5.01 6.71
Keyshawn Askew .219 .363 .297 .260 .388 .450 -0.1 -0.9 4.92 6.29
Jonny Cuevas .265 .360 .429 .282 .346 .496 -0.2 -0.9 5.06 6.20

Players are listed with their most recent teams wherever possible. This includes players who are unsigned or have retired, players who will miss 2026 due to injury, and players who were released in 2025. So yes, if you see Joe Schmoe, who quit baseball back in August to form a Ambient Math-Rock Trip-Hop Yacht Metal band that only performs in abandoned malls, he’s still listed here intentionally. ZiPS is assuming a league with an ERA of 4.16.

Hitters are ranked by zWAR, which is to say, WAR values as calculated by me, Dan Szymborski, whose surname is spelled with a z. WAR values might differ slightly from those that appear in the full release of ZiPS. Finally, I will advise anyone against — and might karate chop anyone guilty of — merely adding up WAR totals on a depth chart to produce projected team WAR. It is important to remember that ZiPS is agnostic about playing time, and has no information about, for example, how quickly a team will call up a prospect or what veteran has fallen into disfavor.

As always, incorrect projections are either caused by misinformation, a non-pragmatic reality, or by the skillful sabotage of our friend and former editor. You can, however, still get mad at me on Twitter or on Bluesky. This last is, however, not an actual requirement.


Are the Broke Bois Spending More this Winter?

David Frerker-Imagn Images

As you’re probably aware, the collective bargaining agreement between MLB and the MLBPA expires this year. Time flies, doesn’t it? The last time this happened, MLB locked out its players — the sport’s first work stoppage since the infamous strike that canceled the 1994 World Series.

The smart money is on there being another lockout next offseason; last time around, both sides did a lot of saber-rattling, but relatively little changed. We got the pre-arb bonus pool and some tinkering around the edges, but there was no salary cap, no abolition of the arbitration system, nothing that I’d describe as revolutionary. The duration of the lockout reflects that assessment; the stalemate lasted long enough to delay the season by a week, but not to cancel any games outright.

Having walked up to the verge of the abyss, peeked over the edge, and retreated, neither capital nor labor reaped a painful object lesson in the reality of all-out labor war. Last time that happened, it scared both sides into détente for 25 years. It seems reasonable to assume that either the players or owners might at least think about tickling the dragon’s tail next winter. Read the rest of this entry »


Toronto Fortifies Lineup With Kazuma Okamoto Signing

Darren Yamashita-Imagn Images

On Saturday, the eve of his posting window’s closure, 29-year-old Japanese third baseman Kazuma Okamoto agreed to a four-year, $60 million contract with the reigning American League champion Toronto Blue Jays. Okamoto, who made his NPB debut as a teenager, is a career .277/.361/.521 hitter with Tokyo’s Yomiuri Giants. He had a power-hitting breakout in 2018, his age-22 campaign, beginning a six-year streak in which he hit 30 or more annual home runs, including a 2023 season in which he cracked 41 of them. He ranks second in all of NPB with 214 homers since 2019, our first year of NPB data tracking here at FanGraphs. During his 2025 platform year, Okamoto posted an incredible .327/.416/.598 line and career-best 11% strikeout rate, albeit in only 77 games because he sprained his left elbow in an on-field collision that caused him to miss roughly half the season.

Dangerous from top to bottom, lineup depth was the bedrock of a Toronto team that came within inches of winning a World Series, and Okamoto’s balanced contact/power hitting style fits in with the Blue Jays’ baton-passing attack. Pre-existing defensive versatility on their roster — namely, incumbent second baseman Andrés Giménez’s ability to play shortstop — gave them the flexibility to pursue players of virtually any position as a means of replacing free agent shortstop Bo Bichette. Read the rest of this entry »