In a race for a playoff spot, every edge matters. Yet all too often, for reasons that extend beyond a player’s statistics, managers and general managers fail to make the moves that could improve their teams, allowing mediocre production to fester at the risk of smothering a club’s postseason hopes. In Baseball Prospectus’ 2007 book, It Ain’t Over ‘Til It’s Over, I compiled a historical All-Star squad of ignominy, identifying players at each position whose performances had dragged their teams down in tight races: the Replacement-Level Killers. I’ve revisited the concept numerous times at multiple outlets and have adapted it at FanGraphs in an expanded format since 2018.
When it comes to defining replacement level play, we needn’t hew too closely to exactitude. Any team that’s gotten less than 0.6 WAR from a position to this point — prorating to 1.0 over a full season — is generally in the ballpark, though my final lists also incorporate our Depth Charts rest-of-season projections, which may nose them over the line. Sometimes, acceptable or even above-average defense (which may depend upon which metric one uses) coupled with total ineptitude on offense is enough to flag a team. Sometimes a club may be well ahead of replacement level but has lost a key contributor to injury; sometimes the reverse is true, but the team hasn’t yet climbed above that first-cut threshold. As with Supreme Court Justice Potter Stewart’s definition of hardcore pornography, I know replacement level when I see it. Read the rest of this entry »
Welcome to another edition of Five Things I Liked (Or Didn’t Like) This Week. Today that title is a bit of a misnomer; I got back from vacation Monday night, so I saw very little baseball before Tuesday. That said, I didn’t need to see very much to have a great time. This week has been awesome. Home runs both mammoth and inside-the-park, great baserunning by slow guys, bad baserunning by slow guys, reflex plays and dekes; the list goes on and on. We might need the All-Star break just to catch our collective breath before a bustling trade deadline and sprint to the finish. For now, though, let’s just marvel at the week – after my customary nod to Zach Lowe of The Ringer, of course.
1. Unconventional Double Plays Cody Bellinger has been great addition to the Yankees after they acquired him for peanuts over the winter. He is flashing the offensive prowess that has come and gone over the years, and with Trent Grisham manning center, he is playing the corner outfield more than he has in the past. His glove isn’t as good as it was at his peak, but putting a center fielder in left is still a plus for your team defense, as the Mets learned on Sunday. This Juan Soto line drive would have been a hit against almost anyone else:
Statcast gave it a 25% catch probability, and I think it was probably even harder than that. Catch probability measures how far Bellinger had to run and how much time he had to do it, but that ball was absolutely scalded and had so much topspin that it was hooking down hard in the brief time it was in the air. He caught it by the very end of the webbing; “baseball is a game of inches” is usually about the bat hitting the ball or a bang-bang play, but in this case, one inch separated a catch from extra bases:
Oh yeah, then this happened:
That throw is as good of a play as the catch! At full extension, stretched out awkwardly to secure the ball, Bellinger still managed to find first base on the run and unleash an absolute seed that hit Paul Goldschmidt right in the glove on the fly. Making that catch was hard enough. Making it without falling was even harder. Making it without falling and then throwing a frozen rope on target? Almost unthinkable.
Even after that catch, even with that throw, you might wonder why Francisco Lindor got doubled off. Partially, he couldn’t believe anyone could catch that line drive. Partially, too, he got deked. Goldschmidt no-sold the play, barely moving his glove until he absolutely had to. This isn’t the body language of a guy desperate to turn a double play:
That’s not the perfect angle, but you get the idea. The rhythm of this play, to Lindor, didn’t feel like the kind where he’d need to sprint and dive back to first. When someone makes a play that good, you turn around and go back, but what are they going to do, unleash an off-balance missile while the first baseman you’re staring at barely moves? Apparently, yes!
2. Irrational Exuberance Vladimir Guerrero Jr. is not a good baserunner. That’s not an opinion. He’s been below average in each year of his major league career. He has 24 career steals and has been caught stealing 12 times. He’s slow, and he hits into a lot of double plays. But despite all that, Vlad likes to run. Give him the chance, and he’ll take off. Take Wednesday, for example. Guerrero took advantage of an errant pickoff throw to scamper to second:
You’ve seen that play a million times. Everyone was pretty relaxed about it; in the game audio, you can actually hear Jays first base coach Mark Budzinski calmly telling Vlad “go ahead, go ahead.” But the play wasn’t over:
Yeah, don’t do that. I’ve already mentioned that Guerrero isn’t fleet of foot, but it also took him forever to get moving; acceleration isn’t a strength either. Watch his feet – his first step was actually backwards, out into right field. Adrian Houser was on the wrong side of the mound, but Vlad just didn’t have enough straight line speed to make it matter. To make matters even worse, that was the third out of the inning, at third base, with Addison Barger — one of the teams’ hottest hitters — at the plate. Against the White Sox! Don’t do this.
Don’t do this either:
Now, to be fair, this is a tougher play than before. The underlying cause, though, is similar: a belief that baserunning is easier than it actually is. Elite runners might be safe there. That said, elite runners are a lot faster, and better at sliding, and they’d probably take two steps to their left to better block the throwing lane. That should be an extremely difficult throw for a right-handed first baseman, instead of the easy pitch-and-catch that it was. And once you’re dead to rights, well, hitting the brakes and retreating is a better option than starting your slide so early. You probably won’t survive the rundown, but you might stay in it long enough to give the runner on third time to score before you’re tagged for the final out of the inning.
To Guerrero’s credit, he did try a nifty maneuver at second that nearly rescued the whole thing:
Again, though, leave the high-difficulty baserunning stunts for the high-talent baserunners. Both of these decisions would be excellent if, say, Trea Turner had made them. Knowing what you can accomplish is a key part of accruing value on the bases. Watching what happens when that crucial step doesn’t occur sure is fun for a neutral observer, though.
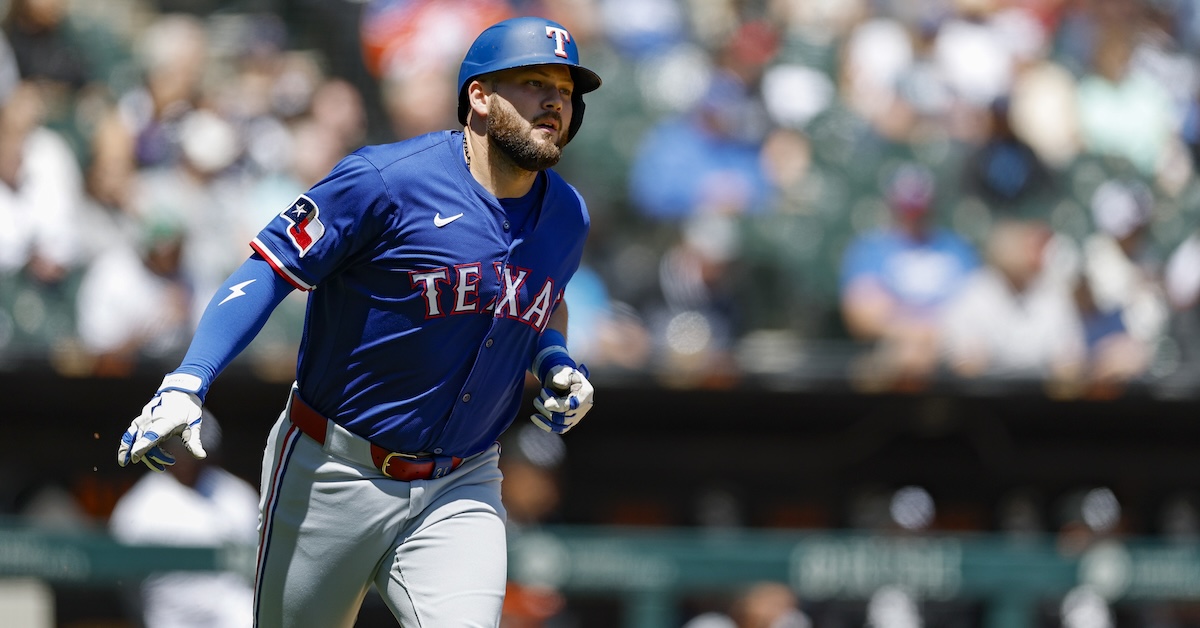
3. One-up-manship Kyle Schwarber had himself a game on Tuesday night. He went 2-for-4 with a double and a home run, and that homer was outrageous. Not only did he hit it into McCovey Cove, but he did so more or less flat-footed:
He even showed off another facet of his game an inning earlier, swiping second base off a distracted Robbie Ray:
That brought Schwarber to nine steals on the year, with only one caught stealing. He’s one of the slowest runners in baseball, but he understands the proper application of that speed, generally stealing bases off pitchers who forget about him. He’s not a particularly good baserunner overall, but he’s been picking smart spots to go this year.
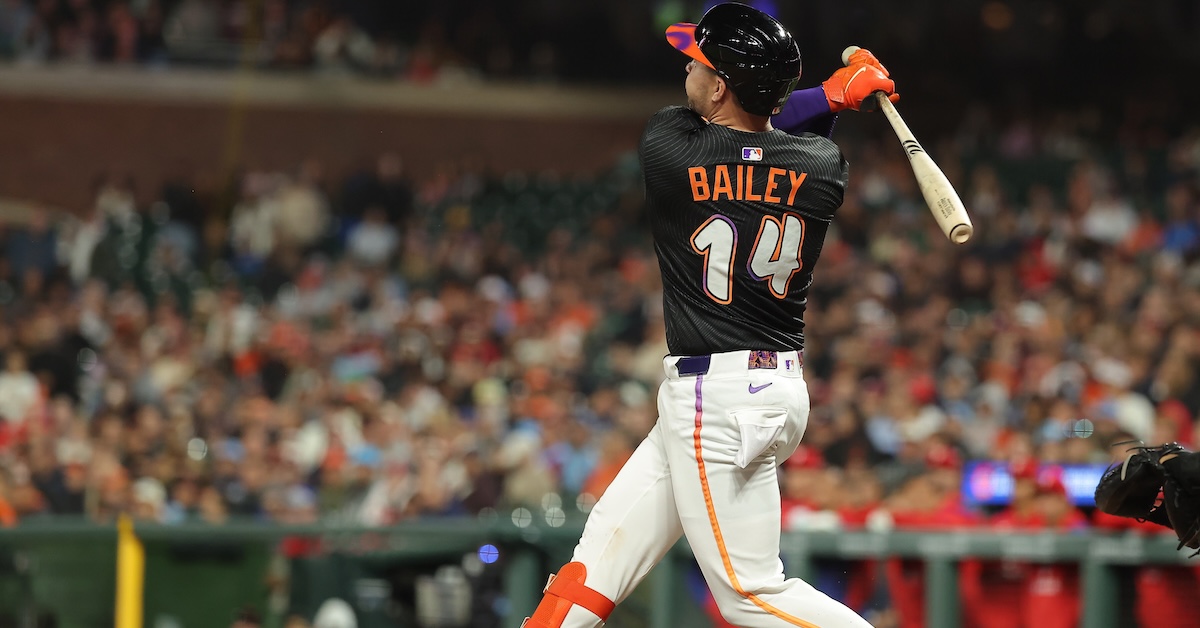
One batter later, though, Schwarber tried to double up on his baserunning feat by swiping third. Enter Patrick Bailey:
Schwarber had a great read on Ray; he got an excellent jump in a great spot to steal, with the batter screening the catcher at the plate. Bailey just did everything he had to do that much better:
Watch his footwork there. He cleared batter Alec Bohm and got his lead foot planted at the back of the batter’s box while he was catching the ball. The catch and transfer were both perfect, letting him throw in rhythm. The throw? A laser beam to Matt Chapman’s glove for a tag that got Schwarber by an inch or two. I don’t think Schwarber could have done anything better; he just got beat by perhaps the best defensive catcher in the game.
Bailey is having a miserable season at the plate, but he even outdid Schwarber there, too. The Schwarbomb in the seventh put the Phillies up 3-1, and the score stayed there until Bailey batted with one out in the ninth. Then, well:
It’s hard to imagine a more exciting walk-off than that, and it made for the perfect kicker to this game. Sure, Schwarber had a stolen base and two-run homer, but Bailey had a caught stealing and a walk-off, three-run, inside-the-park homer. Real “anything you can do I can do better” vibes.
4. Two-Way Excellence
Oh, you like inside-the-park home runs? Northern California has your back:
That’s Lawrence Butler leading off the home half of the first for the A’s with an only-in-Sacramento play. It involved the ball kicking off of a chain link fence section of the wall and eluding the entire Braves outfield. That let Butler score even with one of the most nonchalant starts to an inside-the-parker you’ll ever see:
That’s the stride of someone who thought he hit the ball out of the park, but the crazy carom and Butler’s speed made it all work in the end. That’s been a hallmark of his game this year, in fact. He’s not the best defender in the world, but he’s got enough range and instincts to make up for a scattershot arm. He has plenty of swing-and-miss in his game, but he has enough plate discipline to keep his strikeouts from capsizing his offensive contributions. He’s a savvy baserunner capable of hitting top speed faster than you’d think. And he has enough power to make up for any small flaws elsewhere:
Inside the park? Outside the park? Butler has the speed/power combination to accomplish both. He looks like a nice building block of the next good A’s team – not this year’s team, of course, but maybe next year’s. After 1,000 major league plate appearances, it seems pretty clear that he’s a solid all-around player but not quite a star. That’s just fine for both the contract and the prospect pedigree, though – and as a huge bonus, he’s tremendously fun to watch. More home runs like these, please.
5. Raw Power
More home runs like these, too. Jac Caglianone was playing college baseball last year. The sixth pick in the 2024 draft, he looked more like a developmental stash than a plug-and-play star. He played both ways in college, though he was clearly a lot better offensively, and the Royals drafted him with that in mind. But he was raw, with iffy command of the strike zone and a swing-first mentality that led to ugly swings over sliders.
A whirlwind tour of the minors – 158 wRC+ in Double-A, 164 in Triple-A – convinced Kansas City to call him up at the beginning of June. Through just over a month of play, the results have been disappointing; Caglianone is hitting .151/.205/.286, for a 31 wRC+. But the results are lying. He’s been much better than I thought he’d be, to be quite honest. He’s running a 22% strikeout rate, far lower than I would have expected given that he’s chasing 41% of the pitches he sees outside the strike zone, one of the worst marks in the big leagues. The stats might be rough, but the process isn’t; by xwOBA, he’s been about an average hitter, rather than 70% below average, thanks to his prodigious exit velocities.
In other words, over the long run. Caglianone is going to hit for a lot of power. He’s already hitting the ball very hard, in fact, he just hasn’t quite harnessed that into doubles and dingers. But oh my god, have you seen what it looks like when he gets hot? Tuesday night, he did this:
If you want to know how scalded that ball was, watch the outfielders. Those are courtesy jogs, not “maybe I can get this one” sprints. That was 114 mph off the bat, the kind of home run that only the Judges and Stantons of the world can consistently pull off. When you hit the ball that low (19 degrees), it’s hard to leave the stadium. Caglianone is part of that group of elite power hitters already.
One hard-hit ball often begets another. His results so far have been poor, but he’s clearly close to unlocking something. If you leave a pitch over the middle of the plate against Caglianone, it’s going to travel a long way. Look at this nonsense from the next day:
That’s not a reasonable place to hit a home run. It went 466 feet, some real Bo Jackson stuff. I had the volume cranked up on this game, and the crack of the bat was so thunderous that the entire crowd went “ooooh” in unison. He might not have hit that ball quite as hard as the previous one, but he got it at the perfect angle and still tattooed it. His power binges are park-proof; Kaufmann Stadium is the stingiest stadium in baseball for left-handed power hitters, but if you hit the ball as hard as Caglianone does, it doesn’t matter where the fence is.
I didn’t think Caglianone was going to hit the majors this quickly. I’m still kind of surprised at how well he’s adapted to big league pitching; he’s getting attacked relentlessly on the inside part of the plate and chasing 40% of the time, and yet still running reasonable strikeout rates. But I’m not at all surprised at how fun he is to watch – and I can’t wait for more rainmaking home runs, and more mob movie celebrations in the dugout:
Designer – User Interface/Experience Baseball Operations
Location: Milwaukee, WI
Job Description
The Designer – User Interface/Experience will deliver user-centered design solutions that balance operational goals and technical feasibility. They will partner closely with Baseball Operations software engineers, designers, and department leadership to shape, prototype, and create user experiences for enhancing existing web and mobile technologies and new tools.
Core duties for this role include, but are not limited to:
Contribute to the design process from discovery and wireframing to mid- to high-fidelity visual design and software engineer engagement including but not limited to our Baseball Operations Internal Applications.
Collaborate with baseball systems teams to ensure platforms are feasible, translatable and functional for our users.
Conduct user research, user usability and competitive analysis to inform design decisions when assessing and updating our platforms.
The ideal candidate will have a degree in Human-Computer Interaction (HCI), Design, Computer Science, or a related field and 2 to 5 years of professional UX/UI design experience. or related experience and/or training; or equivalent combination of education and experience.
Our Team
Baseball Systems is the software backbone of Baseball Operations. We provide data and decision-making tools for analysts, coaches, and front office personnel to help win a World Series. Our department consists of a team of data engineers and a team of software engineers who work across all different aspects of Baseball Operations providing support and tools relevant to each group. We work directly with stakeholders in every department of Baseball Operations to ensure every project we work on drives value to the organization and helps us win more games on the field. We help drive technical innovation to find new ways to solve baseball problems.
Our Pitch
You come here to make a difference. We are a purpose-led organization, focused on building an inclusive and engaging culture that fosters excellence, collaboration, and ingenuity. We strive to be a model employer and cultivator of talent, empowering our teams to drive innovation through the inclusion of diverse thoughts, ideas, and perspectives. We operate at the highest standard of excellence, investing in the development of our staff across all levels and embracing differences through a culture of respect and understanding.
We are proud to offer a highly competitive perks and benefits package including:
Exceptional health and dental rates, and fully covered vision package
401(K) match and an additional annual contribution from the Club
Unlimited vacation time
Paid parental leave
Collaborative recognition program and incentives
Leadership development programming
Online educational platform for personal and professional development
Employee Resource Groups
Paid time off for volunteering
Inclusive training and leadership development opportunities aligned with Club values
Brewers Home Game tickets, promotional giveaways and other discounts!
For more information about our Crew, other benefits and insight into our Club culture please visit our Careers Page.
Job Description
The Software Engineer (Baseball Systems) will collaborate with the Systems team to assist in building features for our stakeholders. This position requires strong software development skills and experience, as well as a demonstrated ability for independent thought and the willingness to work within a team framework.
Core duties for this role include, but are not limited to:
Deliver highly dependable, easy to use software while being part of a fast-moving team with supervision from department leadership.
Maintain features that deliver information to stakeholders while collaborating with Data Engineering, Tech Operations, and Research & Development.
Propose visualizations or interfaces that communicate the intended information to a broad audience throughout baseball operations.
The ideal candidate will have a bachelor’s degree (B. A.) in Computer Science, Information Systems, or related field from four-year college or university; and one- three years related experience and/or training; or equivalent combination of education and experience.
Our Team
Baseball Systems is the software backbone of Baseball Operations. We provide data and decision-making tools for analysts, coaches, and front office personnel to help win a World Series. Our department consists of a team of data engineers and a team of software engineers who work across all different aspects of Baseball Operations providing support and tools relevant to each group. We work directly with stakeholders in every department of Baseball Operations to ensure every project we work on drives value to the organization and helps us win more games on the field. We help drive technical innovation to find new ways to solve baseball problems.
Our Pitch
You come here to make a difference. We are a purpose-led organization, focused on building an inclusive and engaging culture that fosters excellence, collaboration, and ingenuity. We strive to be a model employer and cultivator of talent, empowering our teams to drive innovation through the inclusion of diverse thoughts, ideas, and perspectives. We operate at the highest standard of excellence, investing in the development of our staff across all levels and embracing differences through a culture of respect and understanding.
We are proud to offer a highly competitive perks and benefits package including:
Exceptional health and dental rates, and fully covered vision package
401(K) match and an additional annual contribution from the Club
Unlimited vacation time
Paid parental leave
Collaborative recognition program and incentives
Leadership development programming
Online educational platform for personal and professional development
Employee Resource Groups
Paid time off for volunteering
Inclusive training and leadership development opportunities aligned with Club values
Brewers Home Game tickets, promotional giveaways and other discounts!
For more information about our Crew, other benefits and insight into our Club culture please visit our Careers Page.
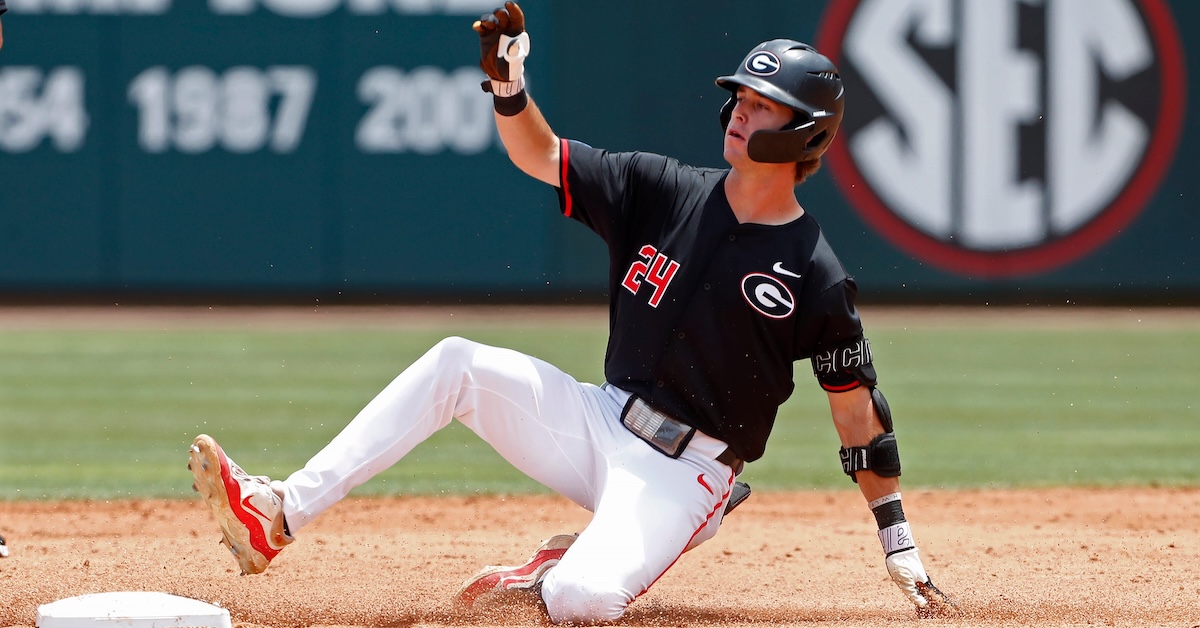
Charlie Condon was drafted just last year, so unlike the previous installments in this series, the 22-year-old corner infielder isn’t exactly revisiting “an old scouting report” here. The observations and opinions he is responding to were written by Eric Longenhagen this past January, less than sixth months after Condon was drafted third overall by Colorado out of the University of Georgia. At the time, the young power hitter had only 109 minor league plate appearances under his belt in the High-A Northwest League.
Eric wasn’t as bullish on him as many other evaluators were when our 2025 Rockies Top Prospects list was published. Our lead prospect analyst ranked Condon second in what he described as a “talented but imbalanced system,” but Eric also gave him just a 45+ FV, citing last year’s poor performance during his first professional season as one of the reasons to be concerned; Condon slashed .180/.248/.270 with a 40 wRC+.
The 6-foot-6, 215-pound right-handed hitter is doing his best to dispel doubts that he can develop into an offensive force at the big league level. After recovering from a non-displaced fracture of his left wrist suffered in spring training, Condon put up a 131 wRC+ over 167 plate appearances with High-A Spokane this season and earned a promotion to Double-A. Since joining the Hartford Yard Goats at the beginning of this month, he’s gone 6-for-27 with a pair of two-baggers.
In a twist to our Old Scouting Reports series, here are Condon’s responses to excerpts from Eric’s January write-up.
———
“Condon went third overall, signed for $9.25 million, and then had a no good very bad pro debut at Spokane during which he hit .180 and struck out 31.2% of the time.”
“That’s just baseball, man, “ Condon said of his disappointing debut. “It’s part of the learning experience, and you have to be able to accept failure and take the positives out of it. I think I’ve learned since then. It’s a tough game.
“Some of it was timing,” the slugger said when asked to elaborate. “I was also getting a little big sometimes. I had to clean up some things with my bat path to help get ready for this year.”
“During instructs, Condon played defense but didn’t get at-bats, as if he was being given time away from the plate to reset.”Read the rest of this entry »
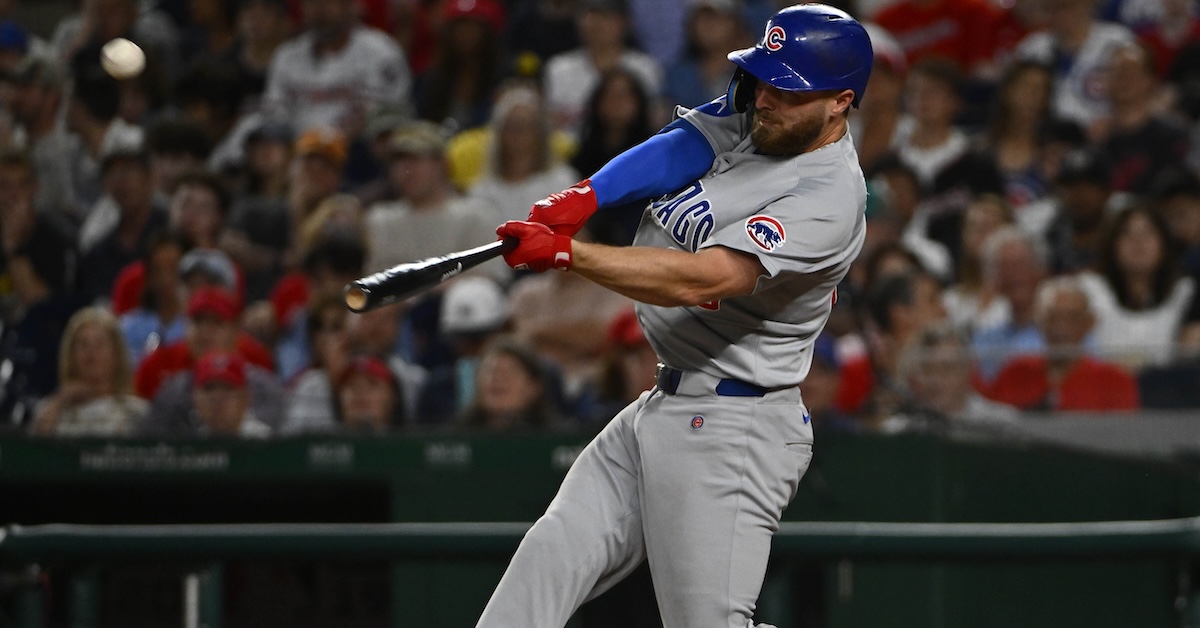
Michael Busch had a pretty nice 2024. In his first taste of everyday playing time in the majors, he hit .248/.335/.440 and socked 21 homers on the way to a 118 wRC+. After years spent in the minors in the Dodgers system, he looked to finally be delivering on his high-strikeout, high-BABIP, high-doubles promise. The Cubs penciled him in as their everyday first baseman. That’s not an imposing batting line, but it’s better than average, so the team spent its winter trading for Kyle Tucker, not trying to upgrade from an already-acceptable situation at first base.
You’ll notice that I said high doubles instead of high power. That’s because Busch had desultory bat speed numbers; he was in the 24th percentile with a 70.3-mph average swing speed. It wasn’t an issue of him having a hard swing and a soft swing that he deployed at different times, either. His fast-swing rate, or the percentage of his swings measured at 75 mph or higher, was a mere 11.3%; league average is around 23%. Busch was adept at getting his barrel to the ball and posting good exit velocity numbers, but that’s generally a recipe for doubles instead of homers. He hit 28 doubles, two triples, and 21 home runs last season, about what was expected from his profile. He got the ball in the air a lot and still hit for a high BABIP – sounds pretty good to me.
What do you think Busch could do to improve his performance in 2025? My immediate answer: Swing faster and hit more homers. Hey, check it out! Busch has already hit 18 homers this year in just over half a season. He’s on pace to shatter his performance last season in pretty much every statistic. He’s hitting .297/.382/.562 with a 165 wRC+. There’s just one problem with my swing-hard-and-prosper theory: He’s not swinging harder. Read the rest of this entry »
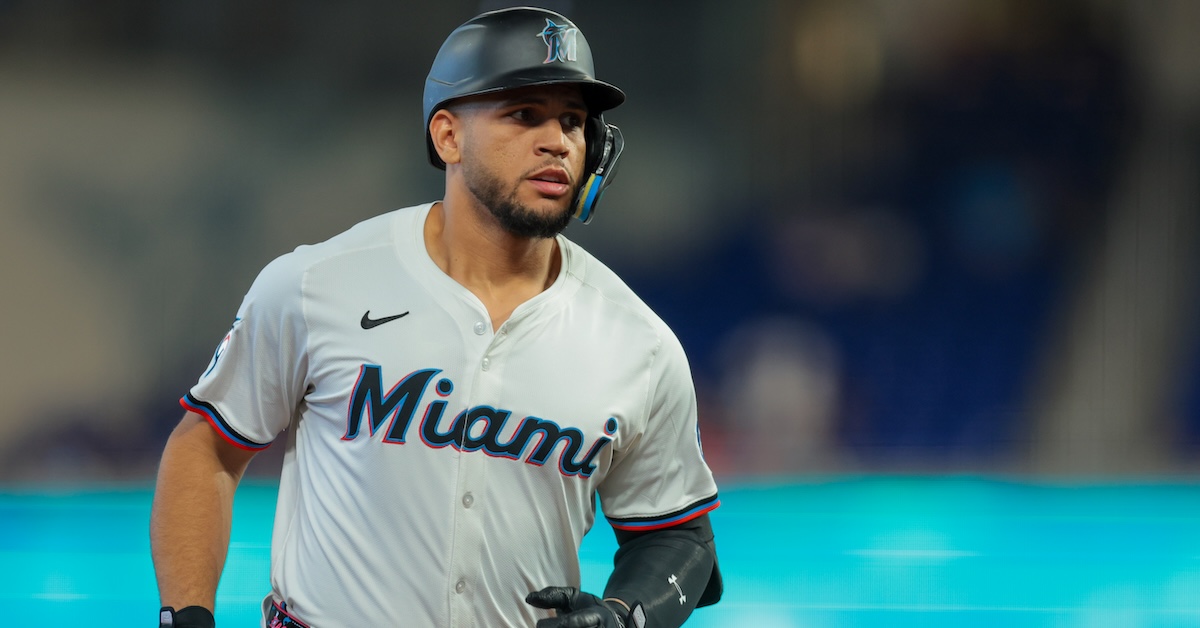
Below is an analysis of the prospects in the farm system of the Miami Marlins. Scouting reports were compiled with information provided by industry sources as well as my own observations. This is the fifth year we’re delineating between two anticipated relief roles, the abbreviations for which you’ll see in the “position” column below: MIRP for multi-inning relief pitchers, and SIRP for single-inning relief pitchers. The ETAs listed generally correspond to the year a player has to be added to the 40-man roster to avoid being made eligible for the Rule 5 draft. Manual adjustments are made where they seem appropriate, but we use that as a rule of thumb.
A quick overview of what FV (Future Value) means can be found here. A much deeper overview can be found here.
All of the ranked prospects below also appear on The Board, a resource the site offers featuring sortable scouting information for every organization. It has more details (and updated TrackMan data from various sources) than this article and integrates every team’s list so readers can compare prospects across farm systems. It can be found here. Read the rest of this entry »
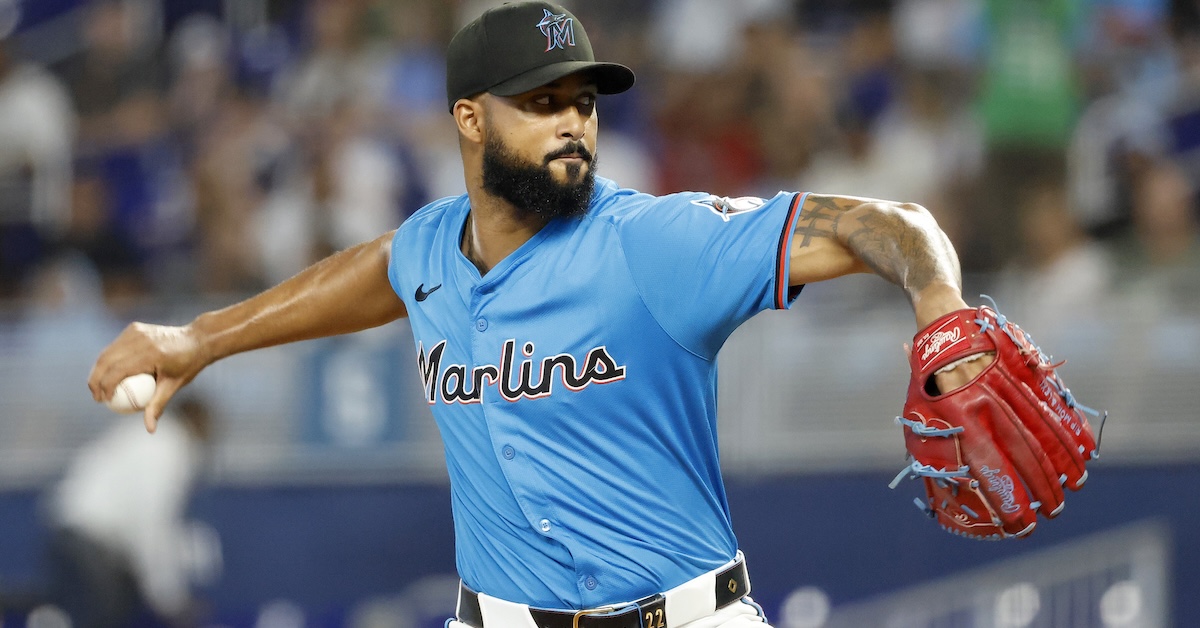
To say the last two-plus years haven’t gone the way Sandy Alcantara had hoped would be a massive understatement. Coming off winning the NL Cy Young award in 2022, his numbers dipped the following season, and he was shut down that September with a flexor strain that required Tommy John surgery in October. He returned this spring with his velocity and movement intact, but his performance to start to the season was rough; he ended April with an 8.31 ERA. The buzz about the Marlins trading Alcantara, a seemingly inevitable outcome for a franchise that is run like a glorified farm affiliate to the rest of baseball, died down temporarily. Sure, things have gone better for the ace recently, but his ERA is still inflated at 7.01, albeit with a relatively sunny 4.55 FIP. Has he done enough to fetch a high price if the Marlins trade him in the coming weeks?
My colleague Michael Baumann wrote about Alcantara back at the start of May, focusing on the righty’s poor April. One of the most concerning aspects of that dreadful start was his 14% walk rate, or 5.9 free passes per nine innings. It wasn’t so much an issue of control — Alcantara’s zone percentage was similar to past seasons — but one of command. You can see the contrast between Alcantara’s best seasons and April in botCmd (PitchingBot) and Location+ (Stuff+).
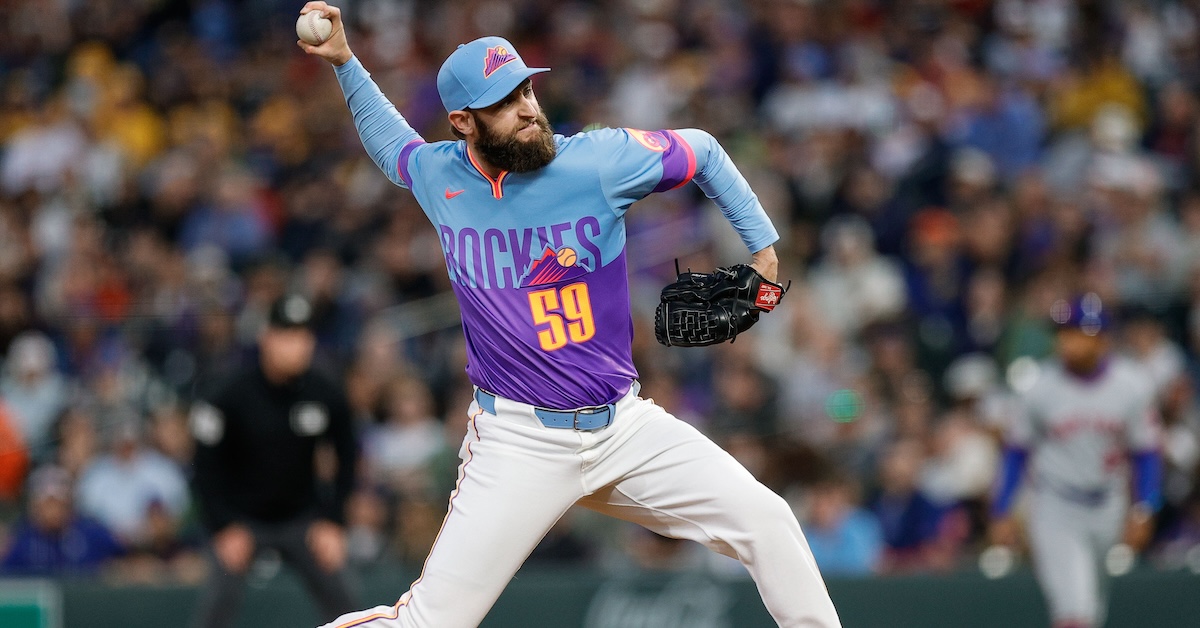
Jake Bird is having a career-best season, and conquering Coors Field has been a big part of the reason why. Over 21 relief appearances comprising 26 1/3 innings, the 29-year-old right-hander has held opposing hitters to a .196/.276/.217 slash line at home. His ERA at the notoriously hitter-friendly venue is 1.71, and his strikeout rate is a healthy 34.3%. Folding in his 18 road outings — including last night’s ERA-inflating, five-run debacle in Boston — Bird has a 3.70 ERA, a 2.92 FIP, and a 27.8% strikeout rate over 48 2/3 frames.
Prior to this year, he’d been a run-of-the-mill reliever on moribund Rockies teams. From 2022-24, Colorado’s fifth-round pick in the 2018 draft had a record of 7-9 with one save and a 4.53 ERA over 177 innings. An unranked prospect coming up through the system, Bird was in possession of an economics degree from UCLA, but boasted little in terms of big league upside. He came into the current campaign projected to essentially replicate the nondescript performances of his previous three seasons.
What is behind Bird’s unexpected emergence as a high-quality bullpen arm? Moreover, what is allowing him to have so much success in his home ballpark? I asked him those questions before Monday’s Rockies-Red Sox game at Fenway Park.
———
David Laurila: How are you having so much success at Coors this year? Can you explain it?
Jake Bird: “I think a lot of it is just the comfortability factor. After being here a few years, I’m realizing that Coors isn’t the big monster that everybody makes it out to be. It’s not that big of a deal. Sometimes [the ball] gets in the air, and the [pitches] move less, but as long as you have a plan of where you want to go with the ball, and sequence pitches, it doesn’t make too much of a difference. Read the rest of this entry »
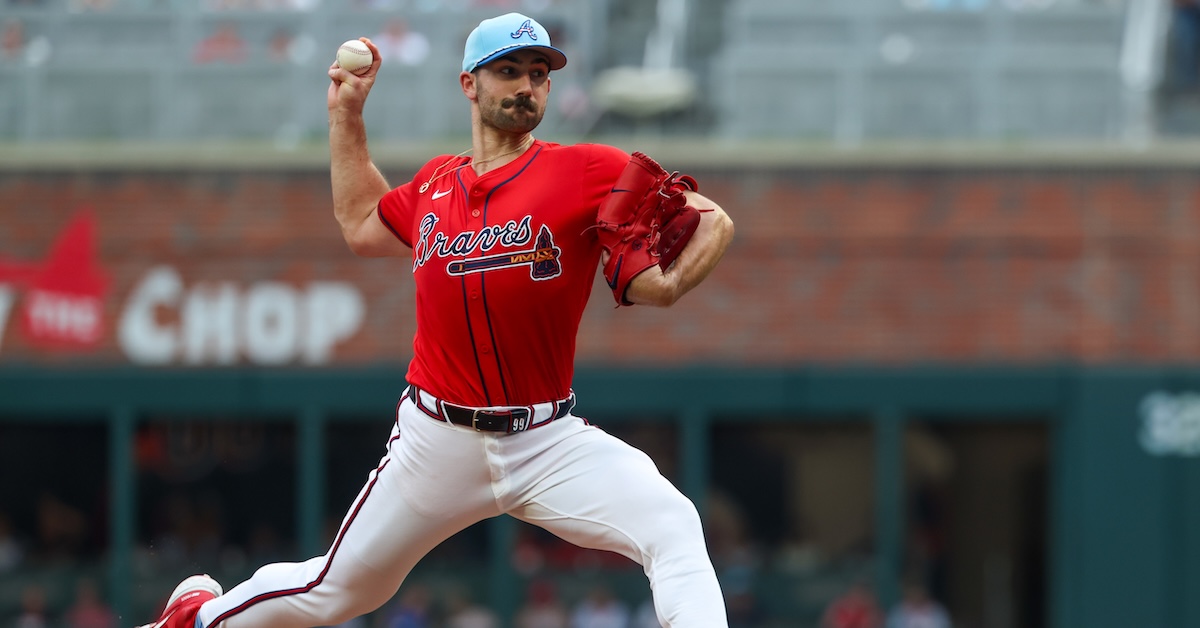
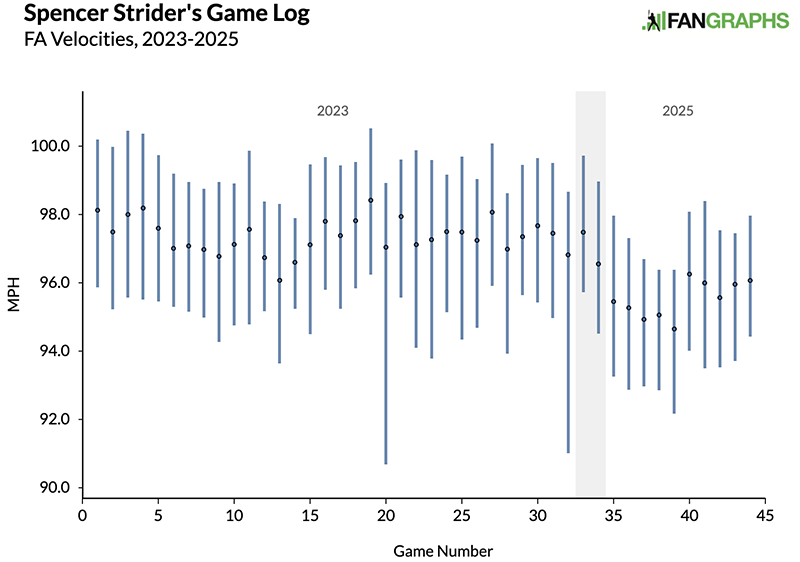
A month ago, I checked in on Spencer Strider’s worrisome return from internal brace surgery. After four starts, Strider was 0-4 with a 5.68 ERA and a 6.40 FIP. His fastball had lost two ticks. His arm angle had fallen by seven degrees. He wasn’t getting chases. He wasn’t missing bats. In short, he didn’t look like Spencer Strider. “There’s no way for us to know how long it might take Strider to get back up to speed,” I wrote, “but the longer he looks like this, the more reason there is to worry.” One month later, I return to you with good news. Strider has made six more starts, and over the last five, he is starting to look different. He’s run a 2.70 ERA and a 2.35 FIP. His strikeout rate is up and his walk rate is down. You might even say that Strider is halfway back.
Once again, the velocity is the big ticket item, so let’s not waste any time:
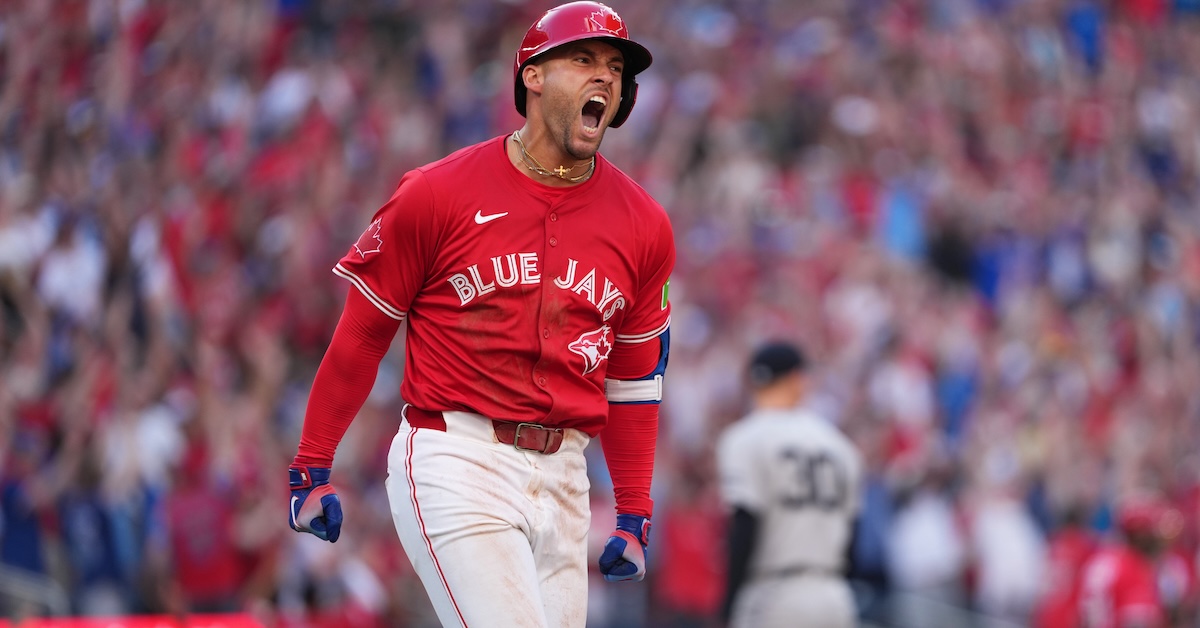
I owe George Springer an apology. Back in March, I wrote an article with a very simple premise: If Springer got off to a terrible start, the Blue Jays needed to be ready to sit him down. He was godawful at the beginning of spring training, he’d been a below-average player for two seasons in a row, and ZiPS saw him as the seventh-best outfielder on the team. Not the seventh-best defensive outfielder; ZiPS projected that Springer would put up 2.2 WAR per 600 plate appearances, a bounce-back campaign, but still worse than the projections of six other Blue Jays outfielders. I wasn’t saying he was washed or anything, but I was concerned that Springer might deliver more of the same, and that the Blue Jays would keep running him out there even though they had better options available. I needn’t have worried.
“I feel great, actually,” Springer told MLB.com’s Keegan Matheson while he was putting up those abysmal spring training numbers. “For me, it’s about the process. It’s not about the results. I want to make sure that I’m swinging at the right pitches and getting my swing off. Yeah, obviously everyone would like to see the ball hit the grass, but for me specifically, I’m working on the mechanical side of it.” Then the season started, and Springer went out and backed those words up. He’s having a renaissance. A couple months shy of his 36th birthday, he already has 1.8 WAR, and his 143 wRC+ is the best mark he’s put up since he was a fresh-faced 30-year-old Astro in 2020. He’s on pace for his highest home run total since 2019, and he’s running a career-best 12.4% walk rate. So Springer is walking more and hitting for more power, and because of a .303 BABIP, his best since 2016, he’s also running his best batting average in years. How is he doing all this? Read the rest of this entry »