Charlie Blackmon Is Chasing .500… For Now
In the run-up to the 60-game 2020 season, colleagues Craig Edwards and Dan Szymborski were among the many writers in the industry who weighed in on the possibility of a player hitting .400 or better. They used lots of fancy math and projections to do so, but it’s already clear that both laid down on the job by failing to estimate the odds of a player hitting .500, as Rockies right fielder Charlie Blackmon was through Tuesday night. Can’t anybody here play this game?
Blackmon’s 3-for-4 performance against the Diamondbacks on Tuesday extended his hitting streak to 15 games, which is tied with the Giants’ Donovan Solano for the major league high this year; during that span, he hit .567/.591/.817. The three-hit game also marked Blackmon’s sixth straight with multiple hits, tied with the Mariners’ Kyle Lewis for the big league high; over that span, he hit .739/.778/1.174 — that’s 17 hits in 23 at-bats, and without a single strikeout, to boot.
Blackmon entered Wednesday afternoon’s game against the Diamondbacks — in which he went 0-for-4 with a walk, but don’t let that tangle my yarn — at .500/.527/.721, with 34 hits through 17 games. As best as I can tell using Baseball-Reference’s Stathead service (the updated version of the Play Index), that’s tied for fourth since 1901:
| Rk | Player | Year | Team | H | PA | AVG | OBP | SLG |
|---|---|---|---|---|---|---|---|---|
| 1 | Nap Lajoie* | 1901 | Athletics | 37 | 70 | .578 | .614 | .938 |
| 2T | Stan Musial* | 1958 | Cardinals | 36 | 80 | .529 | .588 | .853 |
| Hank Aaron* | 1959 | Braves | 36 | 77 | .500 | .494 | .972 | |
| 4T | Carl Reynolds | 1934 | Red Sox | 34 | 74 | .507 | .554 | .791 |
| Pete Rose | 1976 | Reds | 34 | 85 | .466 | .541 | .616 | |
| Charlie Blackmon | 2020 | Rockies | 34 | 74 | .500 | .527 | .721 | |
| Dante Bichette | 1998 | Rockies | 34 | 77 | .453 | .455 | .587 | |
| Larry Walker* | 1997 | Rockies | 34 | 79 | .507 | .582 | 1.030 | |
| Nap Lajoie* | 1904 | Naps | 34 | 73 | .486 | .507 | .670 |
That’s some company, with four Hall of Famers — one a repeat customer, topping the list in the American League’s inaugural season (expansion alert!) — and the all-time hits leader, plus the Rockies’ original right fielder (Bichette) as well as the already-counted Hall of Famer who bumped him to left field upon arriving in 1995 (Walker). The one you don’t know about is Reynolds, a well-traveled outfielder from a high-offense era; he played for five teams in 13 years from 1927-39, batting as high as .359 for the White Sox in 1930, the year that offense was off the charts.
Stathead doesn’t make it easy to figure out who maintained a .500 batting average for any length of time, but it appears that the last player to do so for at least as long as Blackmon did is Barry Bonds, during the period that he essentially broke baseball. In 2004, Bonds hit .500/.703/1.227 in 74 PA through his team’s first 20 games, of which he played 19; during that time, he went 22-for-44 with 30 walks (14 intentional) and nine homers, numbers that looked ridiculous at the time and even more so now. Soon he would endure a seven-game hitless streak; he finished at .362/.609/.812 with 45 homers and a record 232 walks. Walker appears to be the second-to-last player to hit .500 through 17 games, that thanks to back-to-back 4-for-5 days that raised his average from .456; he went 0-for-3 the next day and it was all downhill from there. He plummeted to .366/.452/.720 and had to settle for the National League MVP award; his first of three batting titles would follow the next year.
With Wednesday’s 0-fer, Blackmon’s line dipped to .472/.506/.681; to get back to .500, he’d have to go 4-for-4 on Friday, or 6-for-8 over his next two games, or 8-for-12, 10-for-16, 12-for-20 — hitting well above .500 for a stretch just to get back to even. It’s not going to happen, of course, but it’s a once-every-couple-decades thing that we see anybody get even as far as Blackmon did. Taking a moment to savor it is the least we can do.
There are a few striking things about the 34-year-old right fielder’s performance thus far. First, he’s gotten off to a hot start after having recovered from a COVID-19 infection. He was the first big-name player to be reported as testing positive, in late June, and while he later described his illness as “mild flu symptoms” that lasted only for about 36 hours, he counts himself lucky in that regard. There are still a whole lot of unknowns about the long-term ramifications of COVID-19 for anyone who’s had it, but it’s great to see him healthy again.
Second, Blackmon is putting the ball in to play more often than at any time since 2012, when he was a rookie. He’s never been a guy who walks much; his 7.6% walk rate is a point higher than his career mark, though until Wednesday, he was at 6.8%, his fourth year out of six just below 7%. More notable is his 11.4% strikeout rate, his lowest since his cup-of-coffee 2011 season, and more than five points below his career mark of 16.7%. He’s in the 93rd percentile among all major leaguers, though his strikeout rate isn’t as low as that of former teammate DJ LeMahieu (8.5%) or current teammate Nolan Arenado (5.3%). Blackmon’s doing this despite nothing particularly remarkable when it comes to his swinging strike rate (9.2%, an eyelash above last year but a bit above his career mark of 7.7%) or any of his plate discipline stats. He’s seen more pitches in the zone, and is swinging at slightly more of them and fewer outside the zone, but nothing worth illustrating via a table.
What stands out the most, however, is Blackmon’s .508 batting average on balls in play (.534 heading into Wednesday) and the way he’s getting there. That BABIP comes at a time when the league-wide BABIP is an historically low .283. In the post-1994 strike era, league-wide BABIP has been remarkably consistent, ranging from .293 in 2002 to .303 in 2007; it’s fallen in the .299-.301 range in 11 of those 25 years, most recently in 2017, and last year, it was at .298. The highest individual BABIPs in that time belong to Yoán Moncada (.406 last year), José Hernández (.404 in 2002), Tim Anderson (.399 last year), Ichiro Suzuki (.399 in 2004), and Austin Jackson (.396 in 2010).
All of those players, and the baker’s dozen of 2020 small-sample weirdos besides Blackmon who are carrying BABIPs of .396 or better, have one thing in common: they all hit more groundballs than fly balls:
| # | Player | Season | Team | BABIP | GB/FB | GB% | FB% |
|---|---|---|---|---|---|---|---|
| 1 | Donovan Solano | 2020 | Giants | .520 | 1.40 | 41.2% | 29.4% |
| 2 | Charlie Blackmon | 2020 | Rockies | .508 | 0.54 | 22.2% | 41.3% |
| 3 | DJ LeMahieu | 2020 | Yankees | .456 | 4.63 | 62.7% | 13.6% |
| 4 | Willson Contreras | 2020 | Cubs | .444 | 2.17 | 44.8% | 20.7% |
| 5 | Daniel Murphy | 2020 | Rockies | .444 | 1.23 | 41.0% | 33.3% |
| 6 | Kyle Lewis | 2020 | Mariners | .438 | 1.60 | 46.2% | 28.8% |
| 7 | Nelson Cruz | 2020 | Twins | .432 | 2.27 | 52.1% | 22.9% |
| 8 | Carlos Correa | 2020 | Astros | .426 | 1.18 | 40.8% | 34.7% |
| 9 | Starling Marte | 2020 | Diamondbacks | .423 | 1.56 | 48.1% | 30.8% |
| 10 | Yoán Moncada | 2019 | White Sox | .406 | 1.23 | 42.3% | 34.5% |
| 11 | Franmil Reyes | 2020 | Indians | .405 | 2.27 | 56.8% | 25.0% |
| 12 | José Hernández | 2002 | Brewers | .404 | 1.68 | 47.5% | 28.2% |
| 13 | Michael Conforto | 2020 | Mets | .404 | 1.19 | 38.0% | 32.0% |
| 14 | Jesse Winker | 2020 | Reds | .400 | 2.57 | 54.5% | 21.2% |
| 15 | Luis Robert | 2020 | White Sox | .400 | 1.40 | 44.7% | 31.9% |
| 16 | Tim Anderson | 2019 | White Sox | .399 | 1.76 | 48.6% | 27.6% |
| 17 | Ichiro Suzuki | 2004 | Mariners | .399 | 3.65 | 63.1% | 17.3% |
| 18 | Austin Jackson | 2010 | Tigers | .396 | 1.77 | 48.4% | 27.4% |
| 19 | Dansby Swanson | 2020 | Braves | .396 | 1.33 | 40.0% | 30.0% |
Yes, it’s ridiculous to compare the 2020 players with fewer than 20 games to those who maintained those BABIPs for a full season, but I do this to illustrate how odd and extreme Blackmon’s performance has been. The lowest full-season groundball rate from the era is Frank Thomas‘ 22.5% in 2002; he managed just a .267 BABIP, which was almost exactly half of Blackmon’s BABIP entering Wednesday (stupid updating stats!). Of the 15 players with groundball-to-fly ball ratios under 0.55 from 1995-2019, only Mike Trout (.298 in 2019) and Alfonso Soriano (.295 in 2010) had BABIPs above .267. Hitters don’t do what Blackmon is doing.
Blackmon has had a couple of extreme stretches like this before:
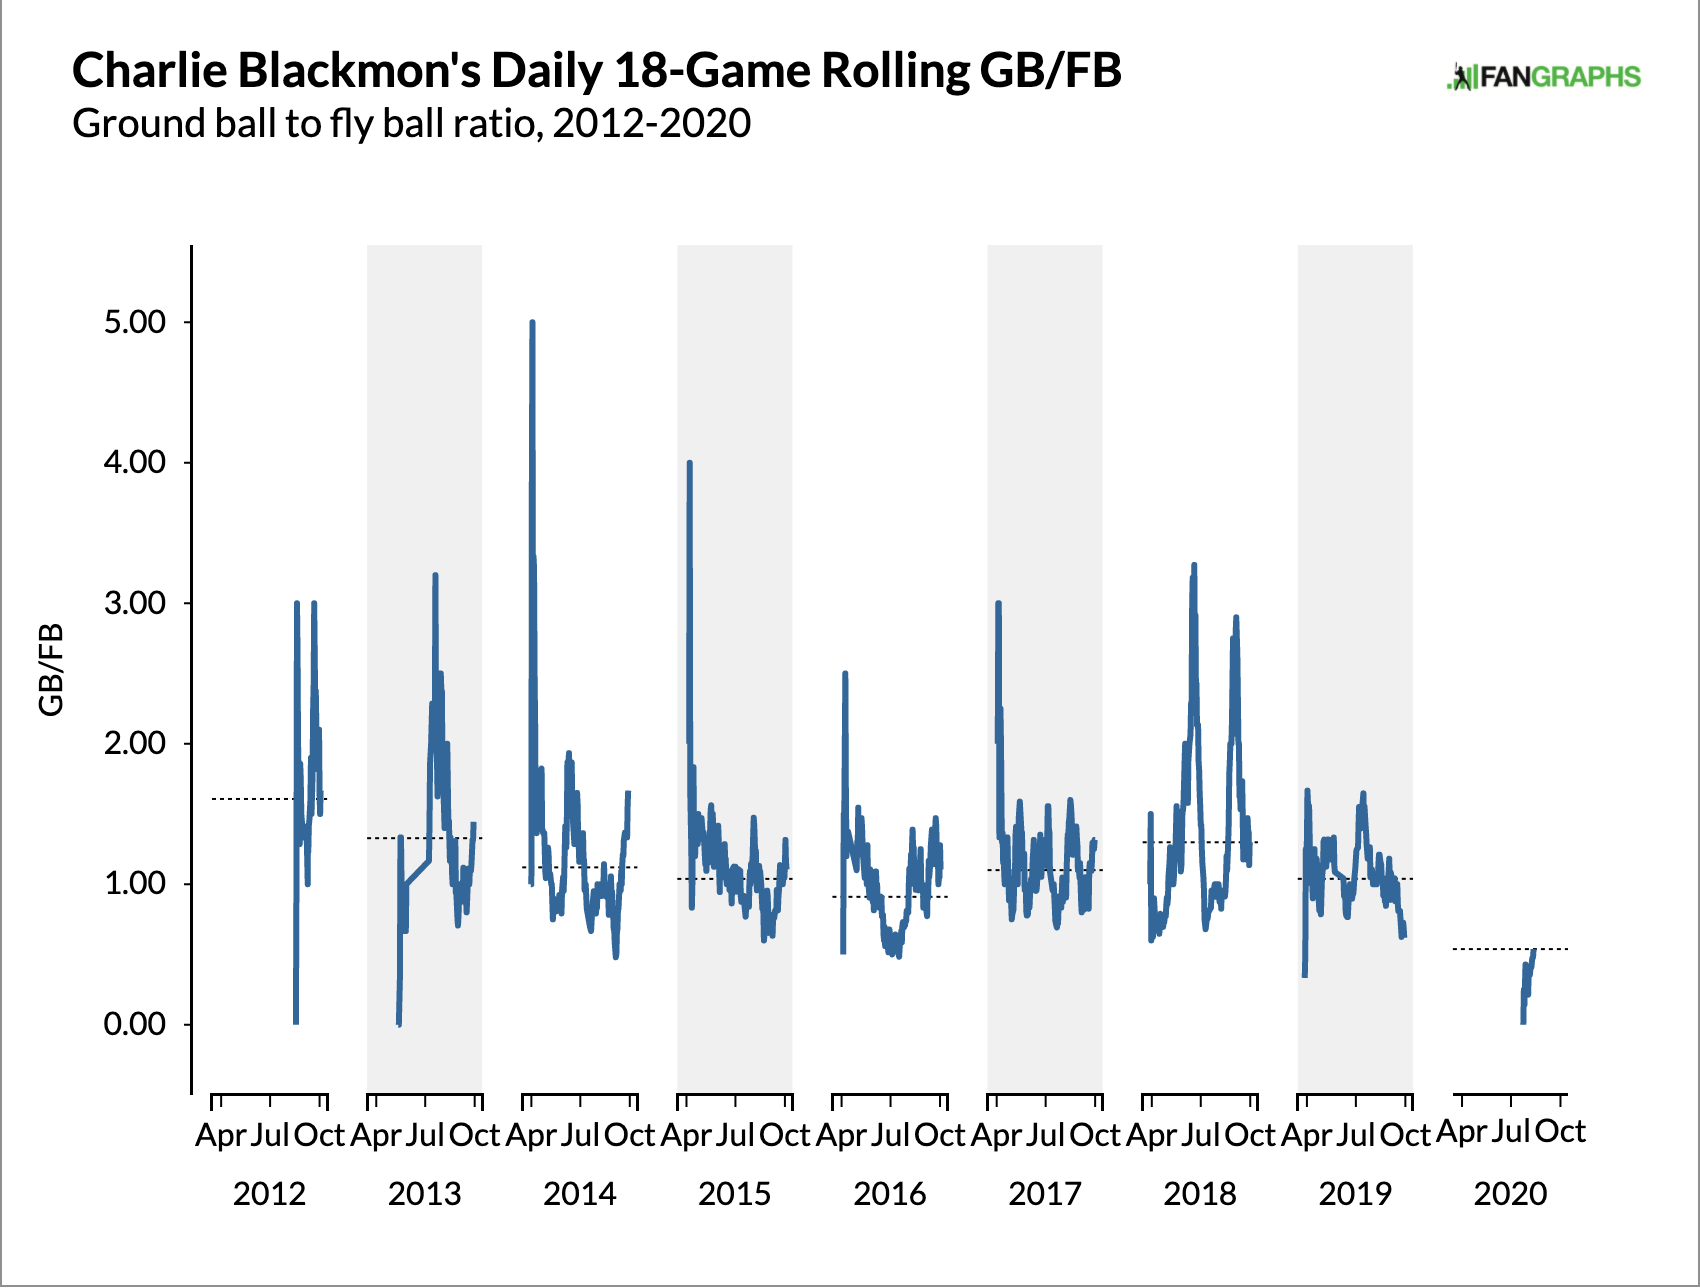
You can ignore those spikes at the start of the 2012 and ’13 seasons, as those simply represent ones that opened with him having a game or two without a grounder; by the time he got to 18 games during the first of those years, for example, he was at 1.38 GB/FB with a 42.5% groundball rate. He’s had midseason troughs with low GB/FB ratios on an almost annual basis, but they’ve never coincided with BABIPs that high — 400+, but not .500+:
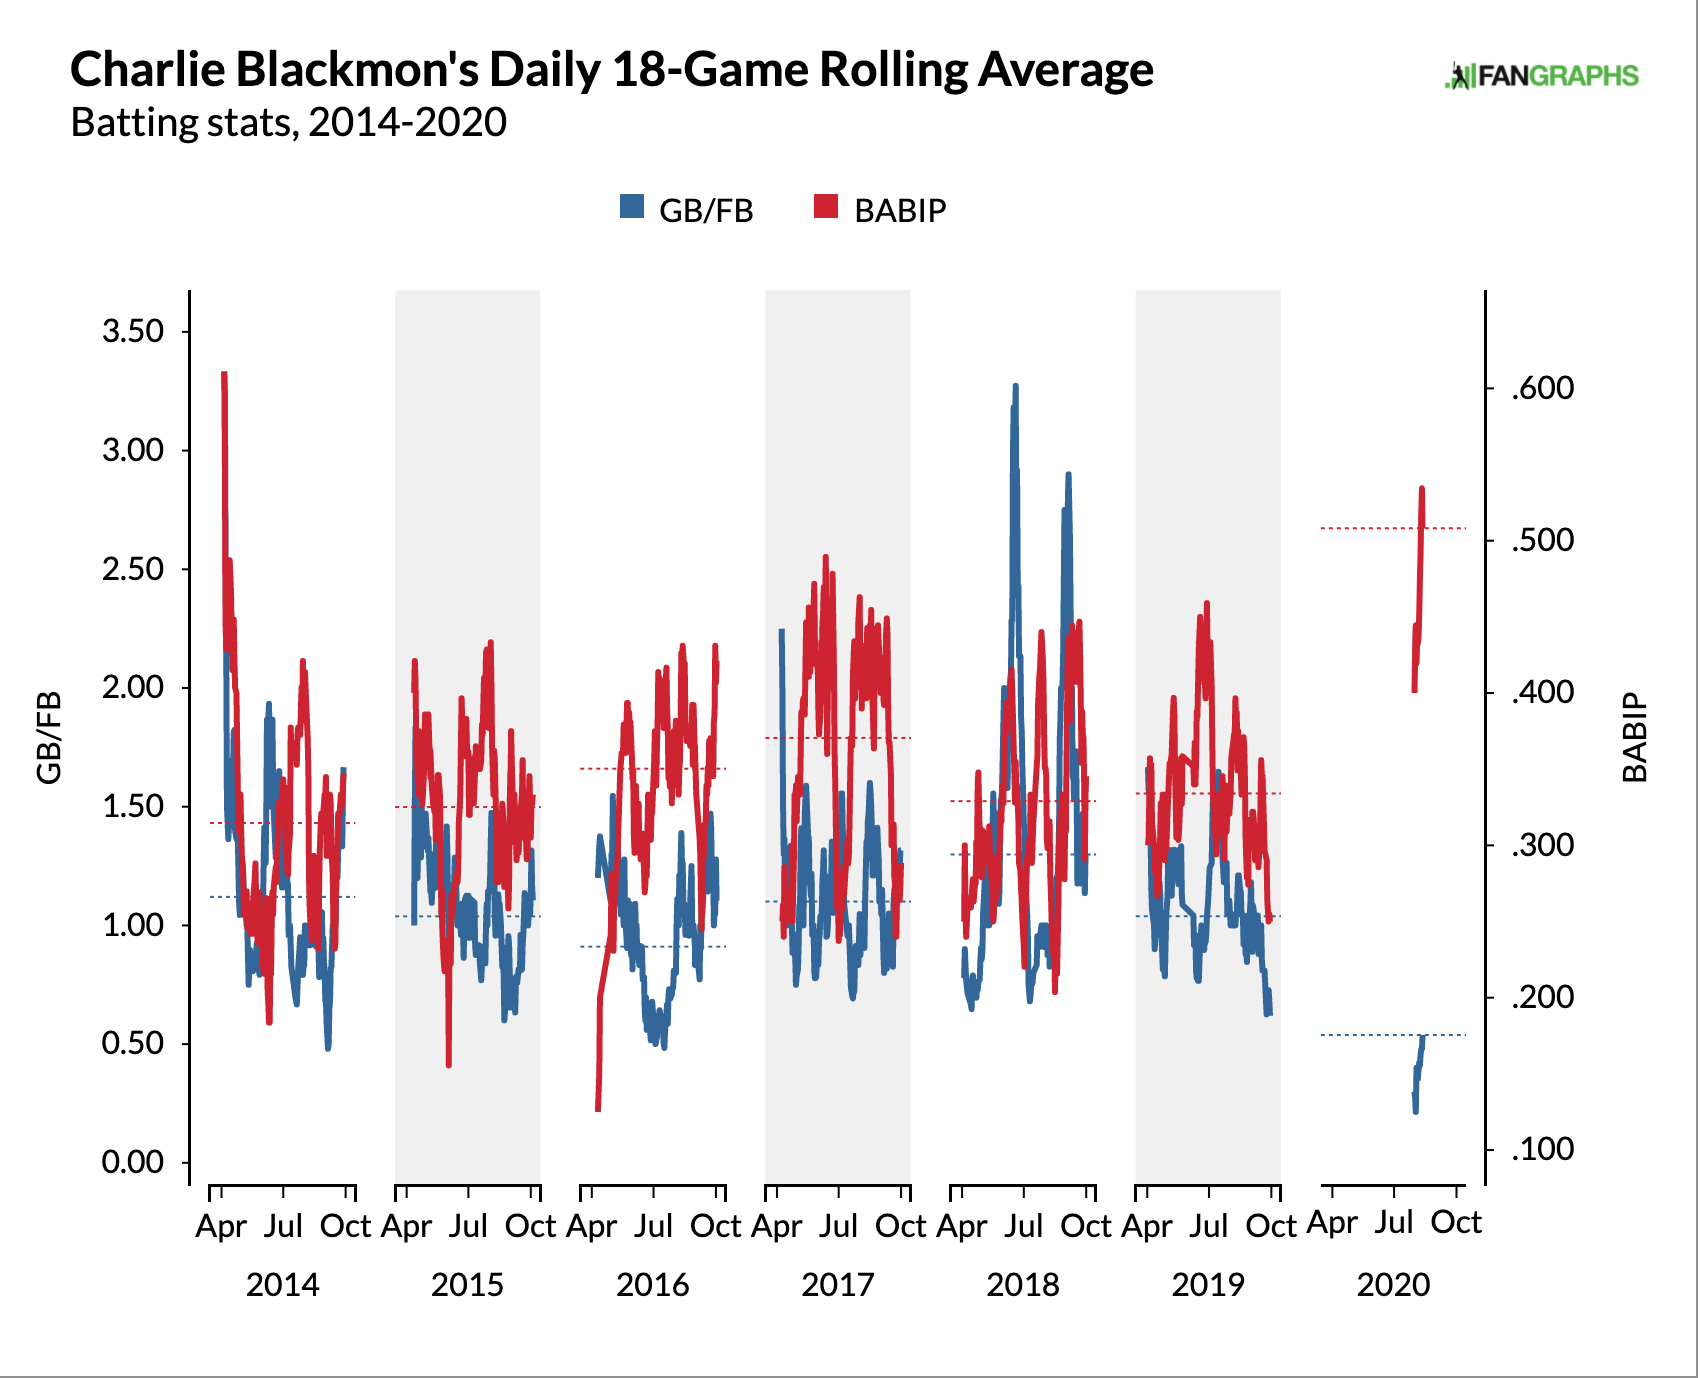
So yes, what Blackmon is doing is in outlier territory, and while we should only get so worked up about it given the sample size, he is up to 64 batted ball events. For hitters, groundball and fly ball rates start to stabilize at 80 events, but average exit velocity does so at 40 such events, and so it makes sense to look at what Blackmon’s doing in the Statcast realm (which, by the way… )
| Year | GB/FB | GB% | FB% | EV | LA | wOBA | xwOBA |
|---|---|---|---|---|---|---|---|
| 2016-19 | 1.08 | 39.5% | 36.5% | 87.8 | 13.8 | .451 | .420 |
| 2020 | 0.54 | 22.2% | 41.3% | 90.0 | 18.7 | .491 | .444 |
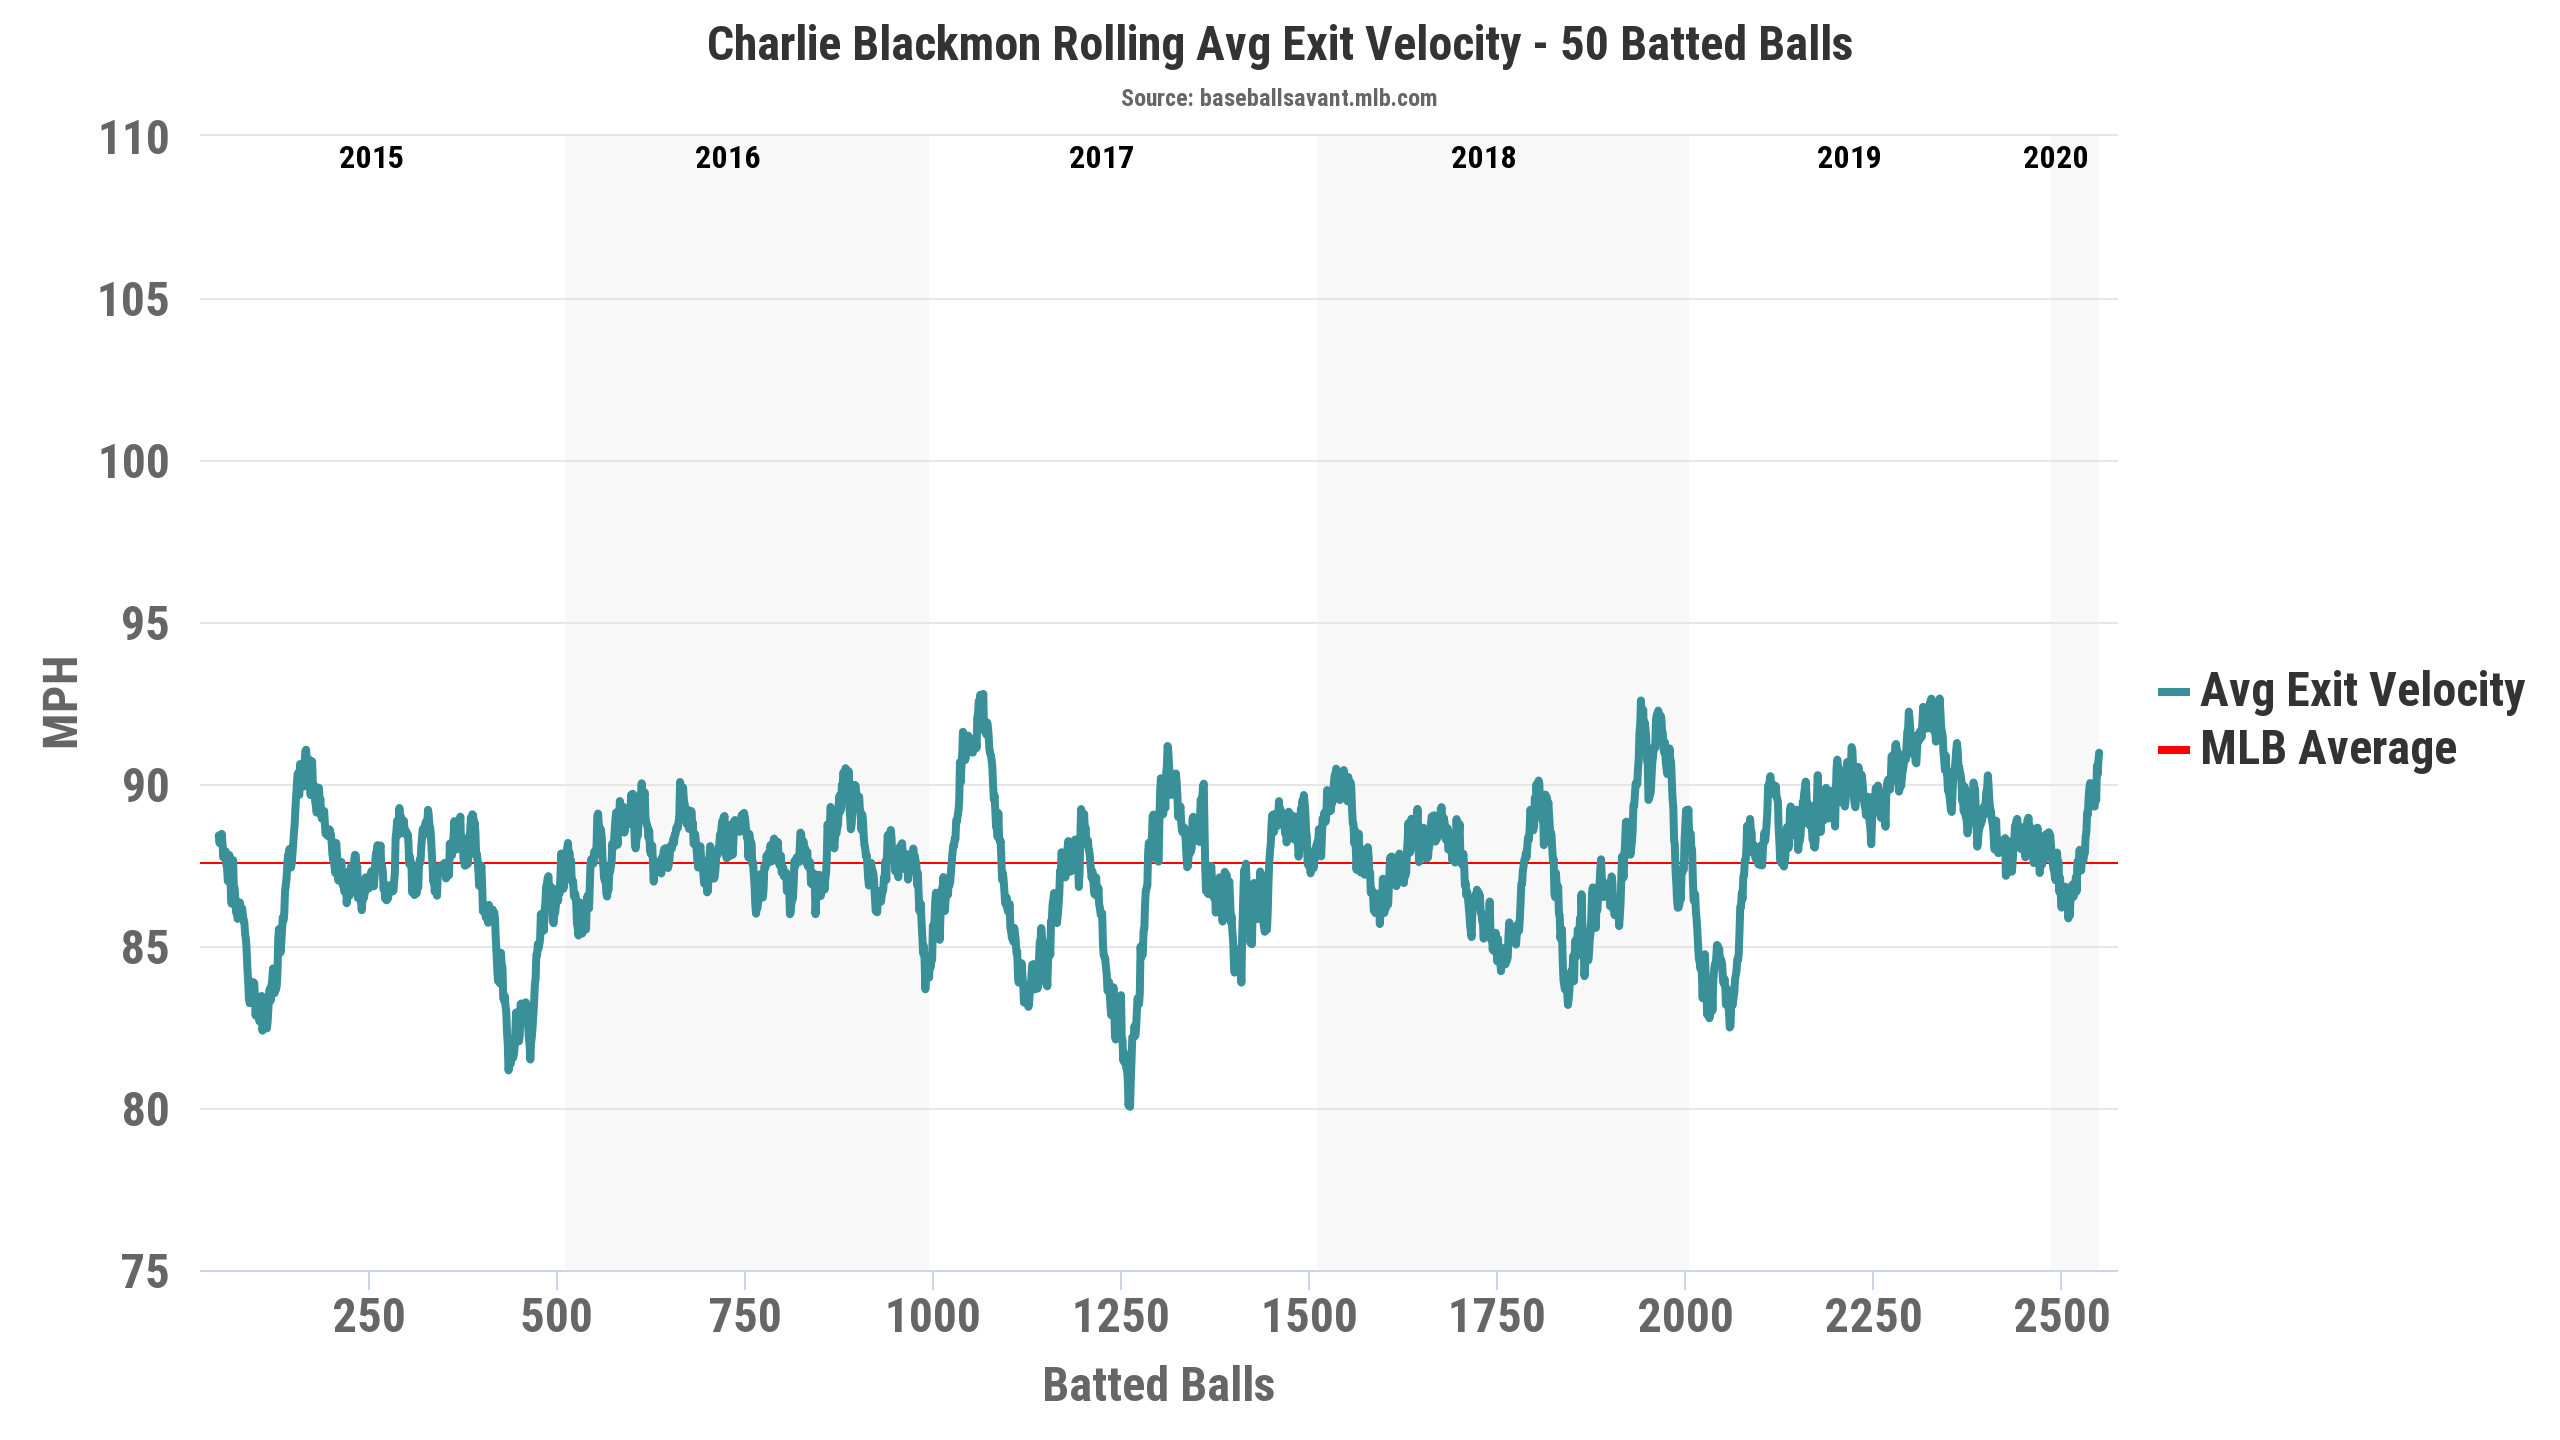
Blackmon’s current GB/FB ratio is exactly half of what he’s done in the previous four years, the span of time during which he’s emerged as a high-average slugger. He hasn’t managed even a 50th percentile average exit velo in that span, ranging between the 26th and 36th percentiles, though this year, he’s in the 68th percentile; in other words, he’s hitting the ball harder than usual, though in terms of rolling averages over 50 batted ball events, he’s had similar stretches during the Statcast era:
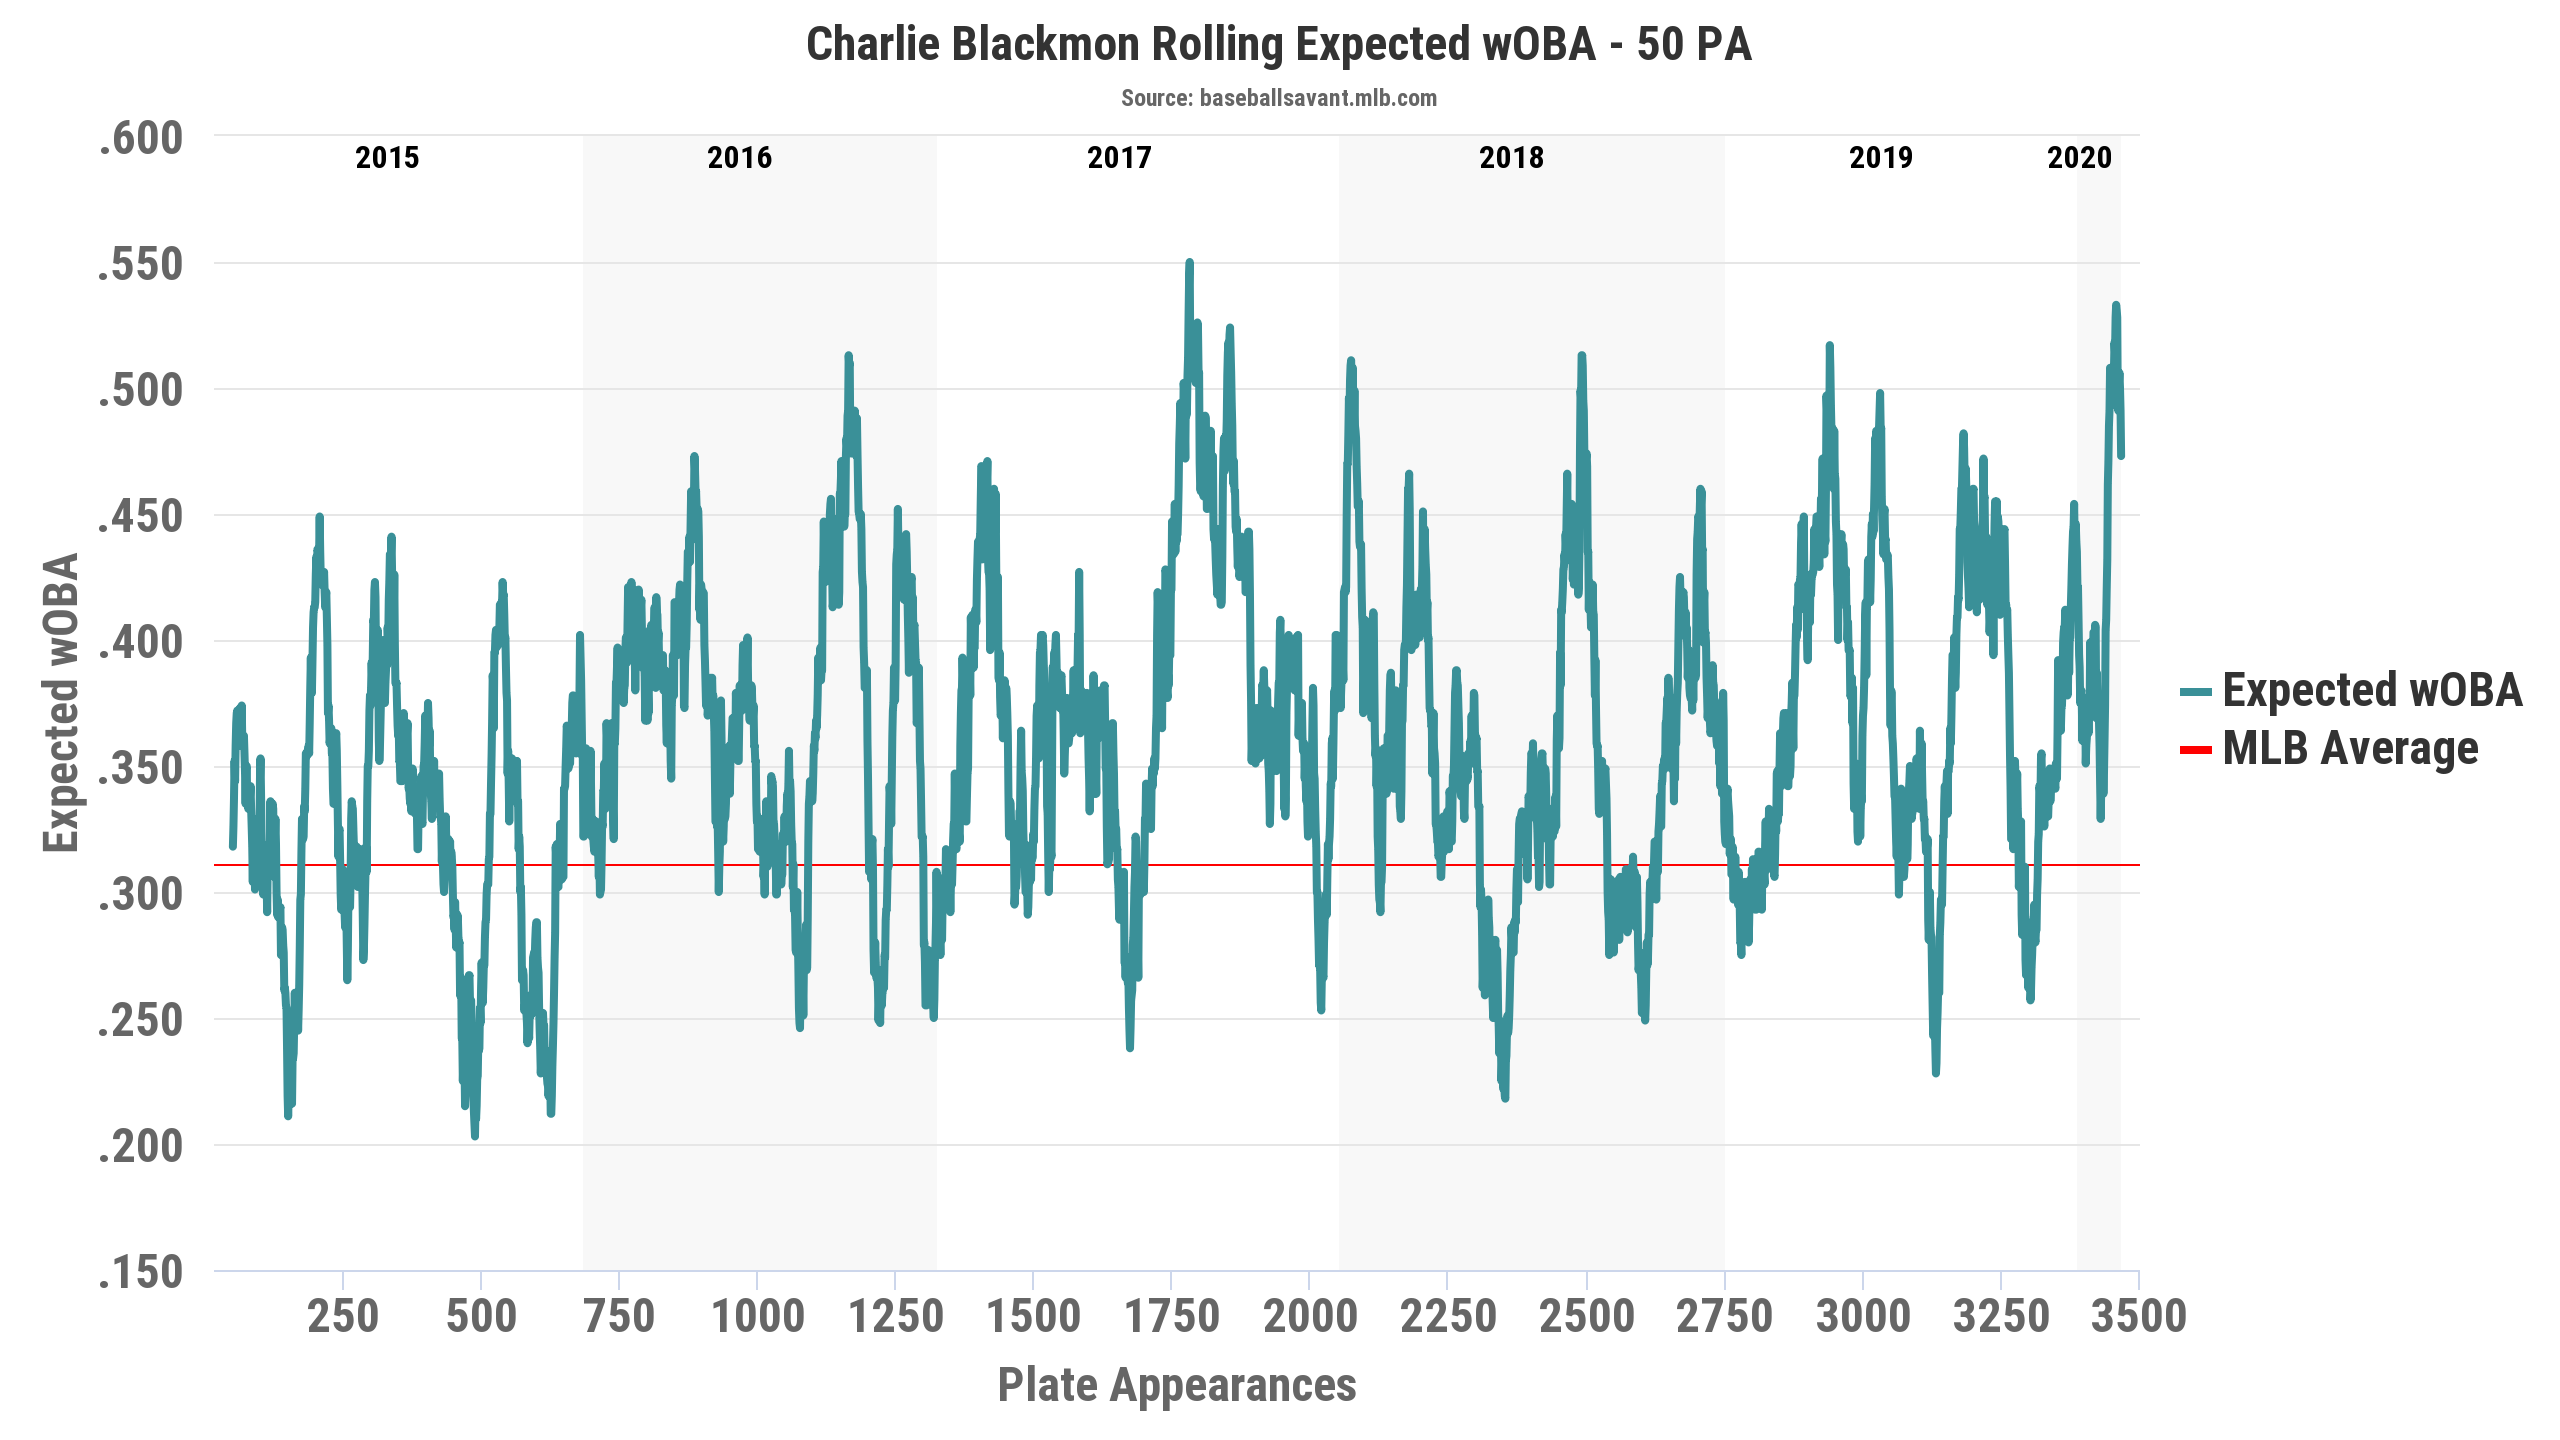
Despite his meager average exit velocities (never higher than last year’s 88.7 mph), Blackmon’s tendency to elevate the ball pays off because he spends half his games at Coors Field, and so his full-season xwOBAs have ranged from the 74th to 89th percentiles; currently, he’s in the 98th percentile. On a rolling basis, only a couple of times has he had stretches like this:
Finally, while Blackmon is obviously exceeding his expected batting average and slugging percentage by a wide margin, he’s actually underperforming when it comes to his power:
| Year | AVG | xAVG | Dif | SLG | xSLG | Dif | ISO | xISO |
|---|---|---|---|---|---|---|---|---|
| 2016-19 | .315 | .293 | .022 | .558 | .501 | .057 | .243 | .208 |
| 2020 | .472 | .392 | .080 | .681 | .632 | .049 | .209 | .240 |
Blackmon’s .209 ISO is on par with his 2017 (.211) and still about 50-60 points ahead of his pre-2016 work. The less lively baseball could be a factor — home run rates are down about 7% from last year’s record high, though that’s about half the gap it was when Baseball Prospectus‘ Rob Arthur wrote about this year’s ball being less aerodynamic than last year’s, albeit still on par with 2018. Beyond that, I wonder, given that Statcast shows that Blackmon’s sprint speed has gradually declined from the 76th percentile (2015) to the 48th (’19) and now the 37th, whether he’s pulling up at first base on a lot of would-be doubles and thus losing some extra base hits. Not enough to actually check it right now, mind you — I’ve flogged this small-sample horse long enough.
The idea that Blackmon could hit .500 is pure poppycock, but going back to the work of my colleagues, it’s worth noting that he was on the leaderboard in terms of his chances at .400, with Edwards estimating Blackmon’s shot at 0.11% (tied with Trout and others for the seventh-highest), and Szymborski placing his chances at 0.36% (10th); teammates Arenado and Murphy are also within hailing distance by both methods. For Blackmon, those odds have increased, but it should be no surprise when he comes back to earth, at least to some degree.
Even so, his hot streak — along with a strong rebound from their young rotation — has helped the Rockies bank key early-season wins and jump out to the NL’s second-best record (12-6) through 30% of their season, and well into the thick of an NL West race with the Dodgers (12-7) and Padres (11-8). In doing so, they’ve improved their Playoff Odds relative to Opening Day by an major league-high 39.1%, from 28.5% (12th in the NL) to 67.5% (fifth). That should keep things interesting in the NL West.
Brooklyn-based Jay Jaffe is a senior writer for FanGraphs, the author of The Cooperstown Casebook (Thomas Dunne Books, 2017) and the creator of the JAWS (Jaffe WAR Score) metric for Hall of Fame analysis. He founded the Futility Infielder website (2001), was a columnist for Baseball Prospectus (2005-2012) and a contributing writer for Sports Illustrated (2012-2018). He has been a recurring guest on MLB Network and a member of the BBWAA since 2011, and a Hall of Fame voter since 2021. Follow him on BlueSky @jayjaffe.bsky.social.
The Rockies and their hot start are complicating things, because they obviously want to keep winning for playoff position, but if there’s a less competitive team that nonetheless has a player sticking with the .400 pace long enough to reach 186 PAs (the point at which they guarantee qualifying for the batting title even if they sit the rest of the season out), any chance we might see them flout the advice of predecessors like Ted Williams or Tony Gwynn, and mysteriously land on one of the ILs?