Investigating the Interaction Between Scoring Environment and NCAA Regional Upsets

Let’s pull back the curtain a little. I’ve been covering baseball full-time for about 10 years now, and in that time I’ve basically written five types of article over and over. Every sportswriter cranks out game stories and interview-based features, and at least two or three times a week, every FanGraphs writer pens a focused topical analysis punctuated by charts and jokes. I’m no different. Category no. 4 involves Political/social/economic commentary, since our sport is governed by the society it exists within, and should be analyzed accordingly.
Which brings up category no. 5: I become fixated on something weird or trivial that nobody else in the world cares about. And rather than throw out a joke tweet and forget about it like a normal person, I spend days and days finding, compiling, and analyzing data in a vain attempt to discover the truth. If a truth as such even exists. Then, indifferent to whether the readers of FanGraphs Dot Com — i.e. all of you fine folks — give a tinker’s damn about the subject, I post the results on this little corner of the internet.
Be warned, this is a category no. 5 post.
It all started last weekend, during the first weekend of the Division I NCAA baseball tournament. For those unfamiliar, college baseball doesn’t use a straight knockout bracket like basketball and hockey do. Instead, the 64 contestants are sorted into four-team regionals, a double-elimination bracket hosted (usually) by the highest-seeded team. It takes either three or four wins to come out of a regional, which comprises either six or seven games. This, incidentally, allows us to preserve the idea of a decisive Game 7, which is a happy accident.
Regionals are the best weekend of baseball on TV all year, comparable to the Olympics or group stage of the World Cup in terms of sports viewing. Can’t recommend it enough.
The winner of each regional moves on to a super regional, a best-of-three series, the following weekend. The remaining eight teams move on to the College World Series in Omaha, which is itself a pair of four-team double-elimination tournaments followed by a best-of-three series to crown the national champion.
To summarize: Four-team double-elimination, best-of-three; four-team double-elimination, best-of-three.
The selection committee seeds the best 16 teams, and in order to ensure relative parity, the remaining 48 are also split into tiers of 16, leaving each regional with its own teams seeded one through four. Think of a regional four seed as the equivalent of between a 13 and 16 seed in March Madness.
If there’s one thing you should know about college baseball in 2023, it’s that offense is way up. (I’ll have a chart to illustrate that point shortly.) Home runs are at an all-time high, and scoring in general is at its highest level in 13 years. And the regionals themselves were quite chaotic; there were numerous upsets and comebacks, and only nine of the 16 hosts survived. The fallen included three of the top six national seeds and half of the top 10. Auburn, the no. 13 overall seed, got bounced without winning a game.
Here, we arrive at the motivating question: Did more offense lead to more upsets? It’s possible that the proliferation of home runs makes it easier for a trailing team to mount a comeback. Alternatively, the great differentiator in postseason college baseball is pitching depth.
The top programs in major conferences run pitching staffs as deep as major league teams’. A mid-major team, by comparison, will not only have fewer top arms to throw, but the compressed schedule of a regional privileges deeper staffs. College teams, which might play four times a week in the regular season, are obliged to play as many as five games in four days in a regional — and against higher-level competition with more on the line than ever. For would-be Cinderellas, the question in a regional is whether they can hang on against higher-seeded teams before they run out of pitchers.
But if every team’s pitchers were getting lit up, perhaps that would level the playing field, or so I thought.
Because it’s possible that this entire theory of mine is bunk. Higher scoring environments tend to make upsets less likely, not more. The more scoring events, the more opportunities for the vagaries of chance to even out. This is why the NBA playoffs (this year notwithstanding) tend to be fairly kind to favorites, while the NHL playoffs are a charnel house of random variance.
It’s also possible that this postseason is not, in fact, that upset-happy after all. Of the three four-over-one upsets on the first day of the tournament, two of the winning no. 4 seeds — Penn and Rider — play less than an hour from my home and generated substantial local interest. So maybe there weren’t that many upsets, and I’m just blinded by regional chauvinism. It wouldn’t be the first time.
After all that preamble, it’s time to get to the data. Which is a problematic issue for college baseball. See, record-keeping at the college level is… well, it’s awful, there’s no other way to put it. Despite the efforts of various independent websites, to say nothing of the underpaid, overworked sports information directors upon whose shoulders the college sports media landscape rests, there is no worthwhile centralized, searchable database for college baseball stats. For someone spoiled by Stathead, and Baseball Savant, and, well, FanGraphs, this presents an enormous problem in terms of data collection.
Back when I was covering college baseball regularly in the mid-2010s, it was a 50/50 proposition whether a team’s box score would include pitch count. If I wanted a pitcher’s strikeout rate or opponent batting line, I had to do the math myself. The state of the art has improved somewhat in the years since, but not by that much:
| Year | AVG | OBP | R/G | HR/G |
|---|---|---|---|---|
| 2010 | .305 | No Data | 6.98 | 0.94 |
| 2011 | .282 | No Data | 5.58 | 0.52 |
| 2012 | .277 | No Data | 5.38 | 0.48 |
| 2013 | .274 | No Data | 5.27 | 0.42 |
| 2014 | .270 | No Data | 5.08 | 0.39 |
| 2015 | .274 | .358 | 5.44 | 0.56 |
| 2016 | .274 | .361 | 5.57 | 0.61 |
| 2017 | .275 | .363 | 5.71 | 0.75 |
| 2018 | .270 | .362 | 5.64 | 0.71 |
| 2019 | .269 | .364 | 5.84 | 0.75 |
| 2021 | .269 | .364 | 5.87 | 0.88 |
| 2022 | .278 | No Data | 6.49 | 1.01 |
| 2023 | .280 | .380 | 6.72 | 1.13 |
For this table of division-wide offensive trends over the past 14 seasons, I had to go to two different sections of the NCAA website, neither of which had OBP data further back than 2015 or slugging percentage for any year. The 2020 season was canceled before any meaningful intra-conference play took place, making it useless for comparison with other seasons. But the tab for conference- and division-level data for 2022 just doesn’t exist on the NCAA website. So I had to go to Baseball Reference, which has conference-level numbers, sort out the DI conferences, and add up the necessary numbers myself.
This is all a roundabout way of saying that I compiled the game-level data from all of the regionals since 2010 myself by entering the results of 13 years’ worth of brackets into a spreadsheet by hand. Now, after some tinkering, said spreadsheet has become unfathomably powerful. You could use this spreadsheet to put a man on the Moon. Or at least put a man in Omaha. Was it worth the effort? No, if I’m being honest. But we press on.
One thing you’ll notice from that table about overall scoring is how wildly the run environment has swung in college baseball in the past 15 years. Over here in MLB, people are complaining about the rocket ball or minute changes to equipment and rule enforcement. Grow up. Over in college baseball, it’s total anarchy. Home runs were nearly three times as common this year as they were in 2014, which is not that long ago! Four of those 2014 Division I home runs came from Pete Alonso, who is not that old! Though perhaps it’s instructive that Pete Alonso, who can lift a battleship, could only hit four home runs in 60 games in that environment.
I went all the way back to 2010 because that year kicked off a decade of radical equipment changes in college baseball. Back in the 1990s, teams were using supercharged aluminum bats to score seven runs a game. Scores in the 20s were not uncommon. In 2011, the NCAA changed equipment standards to use deadened BBCOR bats, and offense went through the floor. At the same time, the College World Series venue was moved from tiny Rosenblatt Stadium to a new, larger park in downtown Omaha that faces into a strong headwind. At the one College World Series I covered in person, 2014, it was unusual to see a fly ball get within 20 feet of the fence.
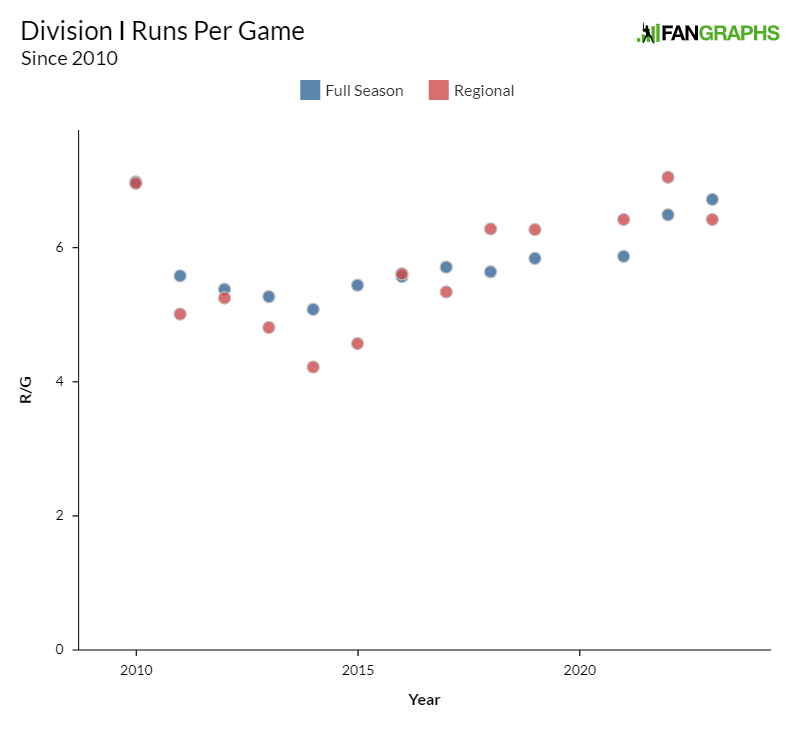
The new bat rules sent the game too far in the other direction. But where MLB (at least until last year) would wring its hands and do nothing for decades, the NCAA acted. In 2015, it changed the baseball, moving to a new ball with lower-profile seams, comparable to the one used in the minors. Offense rebounded with the less draggy baseball, though since the pandemic, it’s exploded again for reasons that aren’t entirely clear:

As you can see — and as you might expect — scoring in the postseason has tracked with scoring in the regular season. But my hypothesis is already falling apart. This was the highest-scoring season of the BBCOR era overall, but scoring in regional play is down slightly from last year.
It’s important to remember that an entire regional round is made up of only about 100 games and somewhere between 1,000 and 1,500 runs. Part of the overall spike in offense in last year’s regional was one Oklahoma State-Missouri State game that ended 29-15 and accounted for 3% of total offense across all regionals.
The higher-seeded teams also dined out this season, as usual, though this number can be a little misleading, as no. 2 and no. 3 seeds perform very similarly across history:
| Year | Record |
|---|---|
| 2010 | 66-35 |
| 2011 | 66-35 |
| 2012 | 68-33 |
| 2013 | 74-29 |
| 2014 | 64-39 |
| 2015 | 70-31 |
| 2016 | 71-30 |
| 2017 | 71-33 |
| 2018 | 68-31 |
| 2019 | 68-34 |
| 2021 | 70-33 |
| 2022 | 73-33 |
| 2023 | 72-29 |
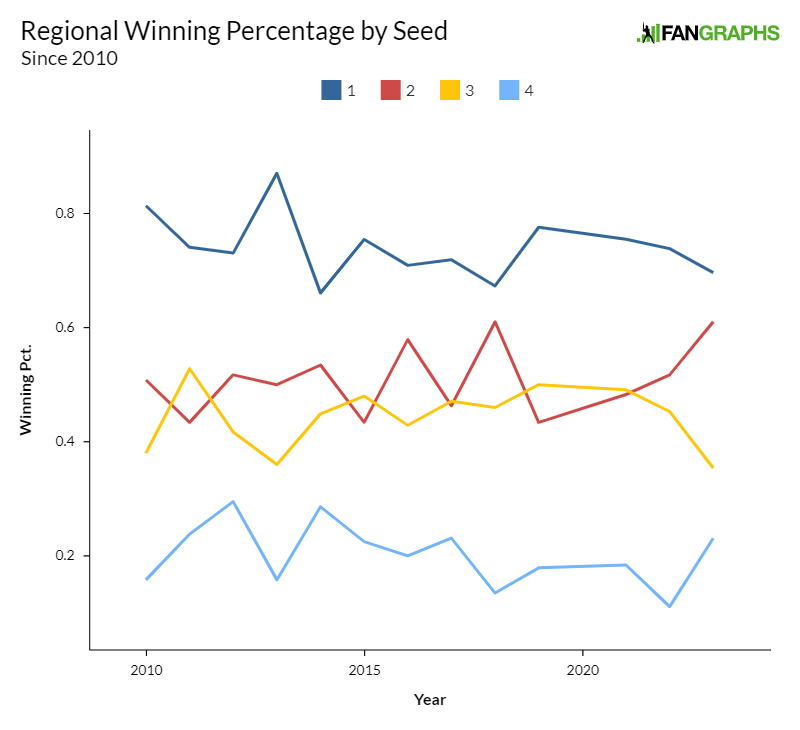
At the margins, the difference in quality from one tier to another can be quite small. So let’s look at winning percentage over time, sorted out by seed:

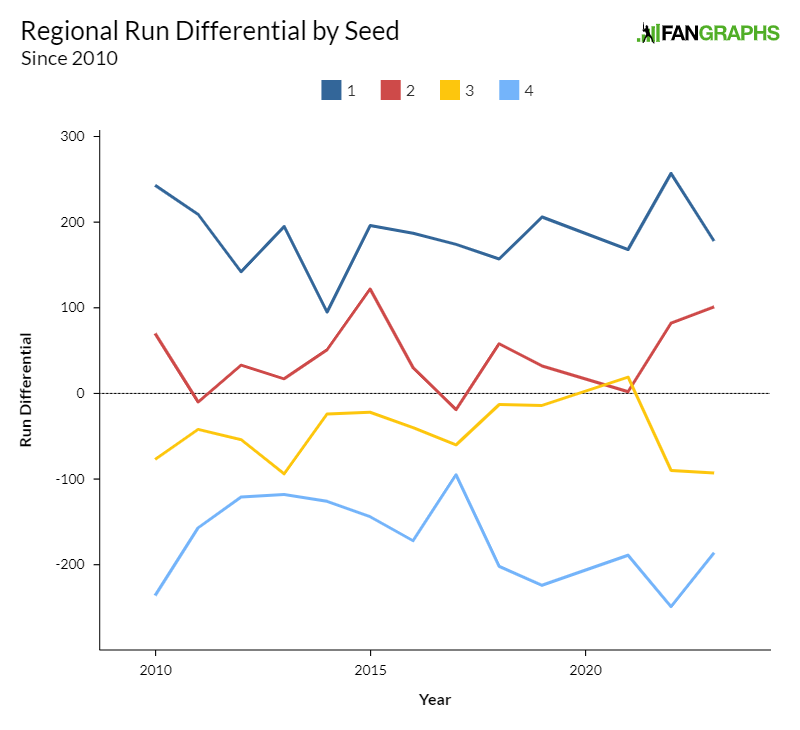
Yes, this was a good year for no. 4 seeds, who had their best winning percentage and run differential since 2017. Top-seeded teams also took a hit, with their worst winning percentage since 2018. This was one of just two instances in the past 13 tournaments in which no. 1 seeds failed to win at least 70% of their regional games. No. 3 seeds had their worst collective performance since 2010, going 17-31. For the first time in the sample, they had a winning percentage closer to no. 4 seeds than no. 2 seeds. Run differential data has similar contours, and as you might expect, the stratification between seeds is more defined:

Upset wins tend to be lower-scoring than chalk. The run differential of top-seeded teams also follows the pattern of overall scoring a little more closely than record does.
So if anything, more scoring leads to fewer upsets in general, as the hot weekend enjoyed by a handful of no. 4 seeds was balanced out by the disastrous performance of no. 3 seeds. And as much attention as Penn and Rider got, the real source of bottom-seed overperformance is Oral Roberts.
ORU is one of several evangelical institutions — along with Liberty and mid-major baseball powerhouse Dallas Baptist — that’s sought publicity through athletic excellence and therefore punches above its weight on the diamond. Oral Roberts plays in the Summit League, which traditionally only gets one bid into the NCAA Tournament. And as a result of their weak regular season schedule, the Mouthbobs usually arrive at Selection Monday with a résumé worthy of a no. 4 seed. This year, ORU went 46-11 in the regular season but ended up with an RPI of 76. (As an aside, RPI has its issues, but that’s a post for another day.) Two thirds of their regular season wins came against teams ranked 200th or lower in the RPI. They played only five games against teams that made the tournament, and lost four.
But once Oral Roberts gets to the tournament, it tends to do well. Since 2010, ORU has made the tournament nine times, and has been a no. 4 seed eight times. In those eight tournament appearances, ORU has won at least one game five times and gone 9-14 overall, for a .391 winning percentage that’s almost double what four seeds have achieved generally since 2010.
And this year, ORU ran the table in the Stillwater Regional, winning all three of its games with a plus-six run differential. The other 15 four-seeds, including Rider and Penn, went a combined 6-30 (.167) with a run differential of minus-192.
Is it the offensive environment, or is it Oral Roberts?
So after all that effort, the data is at best indifferent to my hypothesis, and what I thought was a trend is actually the result of one small religious college from Oklahoma punching way above its weight. Was this an important question to pursue? Not really. And did we learn anything from the exercise? Also no. But now I’ve gotten this fixation out of my system in time for super regionals, and that’s the most important thing.
Michael is a writer at FanGraphs. Previously, he was a staff writer at The Ringer and D1Baseball, and his work has appeared at Grantland, Baseball Prospectus, The Atlantic, ESPN.com, and various ill-remembered Phillies blogs. Follow him on Twitter, if you must, @MichaelBaumann.
Your work is important. Nothing is more foundational then understanding the run environment to gain context. Thanks !