It might not be long before Captain Kirk is the captain of the Starship Blue Jays. Alejandro Kirk made his MLB debut in September 2020. The only players who have been with the team for longer are Vladimir Guerrero Jr. and Bo Bichette, both of whom could leave in free agency next winter. If that were to happen, Kirk would become the longest-tenured Blue Jay just days before his 27th birthday. He could end up holding that title for quite some time, too. On Saturday, Kirk and the Blue Jays reportedly agreed to a five-year, $58 million extension. The deal, which begins in 2026, buys out the backstop’s final arbitration season and his first four free agent years, running through his age-31 campaign.
A 23-year-old Kirk burst onto the scene in the first half of 2022. He hit .315, slugged 11 home runs, and walked more often than he struck out over 83 games. His 155 wRC+ ranked sixth among qualified AL batters, far ahead of the next-best catcher. The fact that he was splitting catching duties, and thus DHing on the regular, cut into his overall defensive value, but still, Kirk ranked among the top-10 AL players in WAR. Fans voted him to be the starting catcher for the AL All-Stars, and the honor was well deserved.
Yet, Kirk has never looked like that middle-of-the-order threat since. He produced a 95 wRC+ in the second half of 2022. He followed that up with a 96 wRC+ in 2023 and a 94 wRC+ in 2024. To save you some strenuous mental math, I can tell you that averages out to a 95 wRC+ since the 2022 All-Star break. That means Kirk has been about 5% less productive at the plate than the average hitter, but, to his credit, still 5% more productive than the average catcher. His 10.3% walk rate is great, while his 12.0% strikeout rate is elite. Only seven batters (min. 1,000 PA) have a lower strikeout rate in that span, and none of them boasts a walk rate in the double digits. Unfortunately, the plus power that made Kirk such a complete hitter in the first half of 2022 has vanished: Read the rest of this entry »
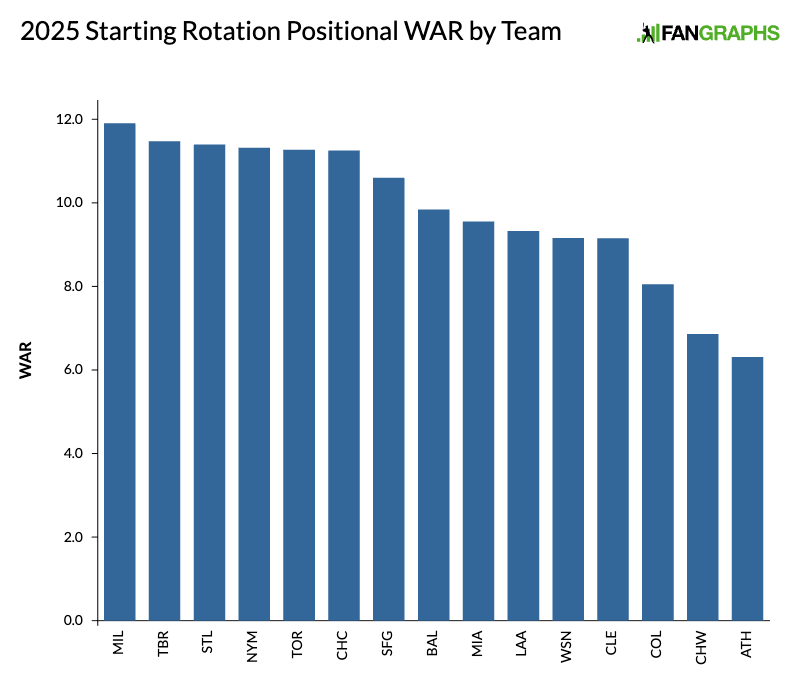
At first glance, this might seem like a list of the best pitchers in baseball rather than a list of the best rotations. That’s the thing I noticed most when writing this article; nine of the top 10 pitchers in the game according to our projections can be found on these 15 teams. It’s not that good pitchers inherently make for good pitching staffs, though that’s certainly part of it. It’s more that the concentration of top pitchers on top teams reflects a strategic optimization of limited resources.
A good pitcher on a bad team is just bad business in today’s game. Pitchers are highly sought after in trade, which makes them worth their weight in prospects, so to speak. They’re also fragile – one sore elbow, and bam, 18 months go down the drain. That gives teams with good pitchers but bad playoff chances a clear incentive: maximize the value of your top pitcher by trading them before they get injured. And rebuilding teams almost never sign top pitchers in free agency; it’s safer to anchor yourself around a hitter. Can you draft and keep one of these top-tier arms? Absolutely, and you’ll see some of those on this list, but the prevailing trend is that of established aces migrating towards contending teams. Read the rest of this entry »
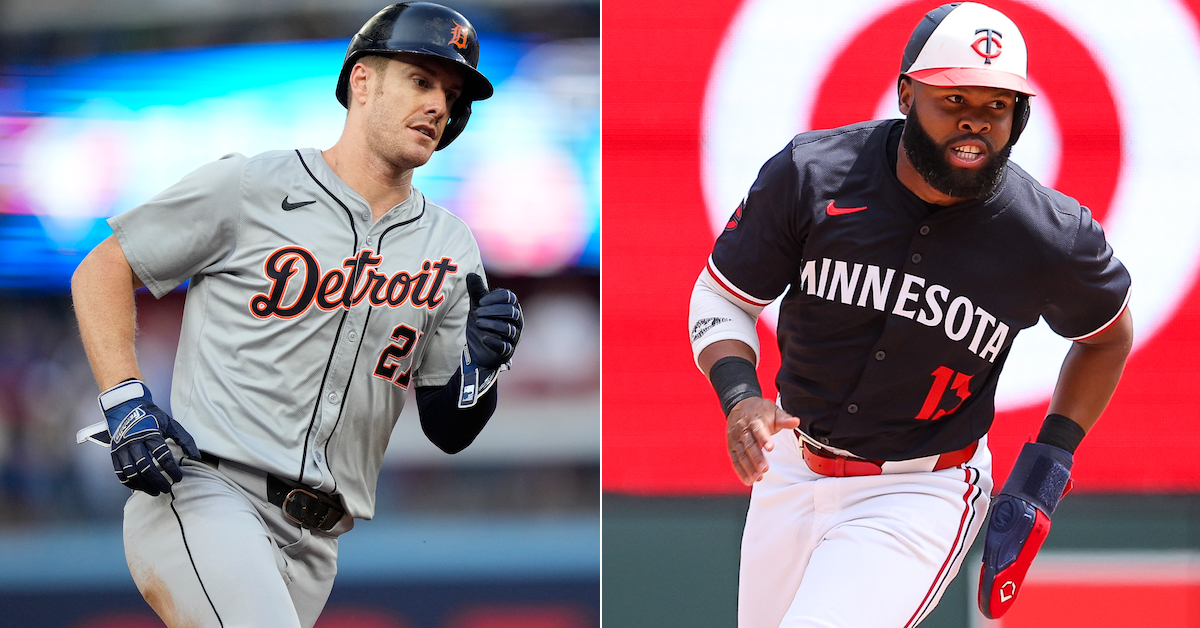
As spring training ends and rosters are finalized, one team’s flotsam and jetsam becomes another team’s reserve outfielder. Such was the case this past weekend as two outfielders who were in camp with the Brewers but deemed superfluous subsequently found homes within the AL Central. The Brewers traded Mark Canha to the Royals and released Manuel Margot, who signed a deal with the Tigers.
When camps opened last month, the 36-year-old Canha and the 30-year-old Margot were both still free agents, but within a two-day span in late February, Brewers president of baseball operations Matt Arnold inked them to minor league deals with non-roster invitations to spring training. Ultimately, the team decided to head into the season with a starting outfield of Jackson Chourio in left, Garrett Mitchell in center, and Sal Frelick in right, with designated hitter Christian Yelich and switch-hitting second baseman/outfielder Isaac Collins also in the mix, and Blake Perkins recovering from a fractured right shin. As free agents who ended last season on major league rosters, signed minor league deals this past offseason, and had at least six years of service time, both Canha and Margot had the first of three opt-out dates looming on March 22.
This was Canha’s second go-round with the Brewers, who acquired him from the Mets on July 31, 2023, and played him regularly down the stretch on a squad that claimed a Wild Card spot. Canha was on a $26.5 million, two-years-plus-option deal at the time; after that season, the Brewers flipped him to the Tigers in exchange for righty prospect Blake Holub, and Detroit picked up his $11.5 million option for 2024. During the first four months of the season, Canha made 30 starts at DH, 29 at first base, 19 in left field, and 11 in right field. He mustered less power than usual, hitting a modest .231/.337/.350 (101 wRC+) with seven homers in 377 plate appearances. Read the rest of this entry »
I always get excited to take my first look at my half of the starting pitcher Positional Power Rankings. I come in with preconceived notions of each rotation, usually with a solid handle on the top eight to 10 options for every team, as I’m no doubt buried in multiple fantasy drafts when Meg sends everything out. And yet I never cease to be amazed. I’m not saying the projections are infallible, but seeing the numbers laid out versus my mental snapshot of each team is sobering. There are always teams I’m surprised to see in my section, and rankings that absolutely shock me at first blush. Read the rest of this entry »
During the last week of spring training, after rosters have been more or less settled, some teams will find they have more pitchers than they can use at the moment. There’s a no. 6 starter who’s pitched well enough to earn a job, but there’s no room for him on the roster and he’s out of options. Good news: Another team needs a pitcher and is willing to trade a minor league depth infielder, say, to jump the waiver line and trade for yours.
I find this process oddly heartwarming, because everyone benefits: Both teams get a more balanced roster, and the pitcher in question gets a spot on a major league roster instead of getting DFA’d. Professional baseball is usually a zero-sum competition, but that doesn’t mean you can’t help your friends out. Read the rest of this entry »
The week leading up to Opening Day is extension season. Players want to put aside money discussions when the games start to matter, teams crave cost certainty, and everyone’s packing up from spring training with hope in their hearts; it’s a perfect setting for agreeing to deals. Amid a flurry of other activity, the Cleveland Guardians got in on the act by signing Tanner Bibee to a five-year, $48.5 million extension, with a club option for another year after that.
Let’s get straight to what you came here for, the ZiPS projections:
ZiPS Projection – Tanner Bibee
Year
W
L
ERA
G
GS
IP
H
ER
HR
BB
SO
ERA+
WAR
$
Status
2025
10
8
3.48
29
29
160.3
141
62
20
45
163
120
3.0
$0.8M
PRE
2026
10
7
3.43
28
28
154.7
137
59
19
42
154
122
2.9
$4.2M
ARB1
2027
10
7
3.50
27
27
151.7
136
59
19
40
148
119
2.8
$7.5M
ARB2
2028
9
8
3.58
27
27
146.0
132
58
18
38
139
117
2.6
$10.7M
ARB3
2029
9
7
3.59
27
27
145.3
133
58
18
38
134
116
2.5
$23.4M
FA
Those are pretty much what I expected. Through two years in the big leagues, Bibee has been a steady contributor whose best skill is good command. ZiPS projects more of the same for the next five years. That slight decline in innings you see over the course of the projection isn’t really a Bibee thing, it’s a pitcher thing. You just never know when one awkward elbow twinge will cost someone a year, and that’s reflected in declining innings totals over time.
Let’s talk about Bibee the pitcher for a moment before getting into the Guardians. He’s a product of the organization in the Shane Bieber mold, a crafty college arm who added velocity in the Cleveland system and went from fifth-round draft pick to runner-up for the 2023 AL Rookie of the Year award. That velocity doesn’t give him an unhittable fastball or anything like that. But where his fastball was a key sticking point in his pre-professional profile, now it’s just another average pitch. It sits 94-95 mph, touches the upper 90s in big spots, and has decent shape — more rise than run, but not a ton of movement overall.
That might not sound intriguing to you; after all, plenty of major leaguers have fastballs like that. But that’s the revelation here. With a boring fastball, Bibee’s other pitches all play up. He has impeccable command of spinning stuff, to the point where his pitches sometimes bleed together in our classification systems. There’s the hard one, either a cutter or sharp slider depending on who you ask, mid-80s and biting hard glove side. That’s his workhorse pitch, the one he favors in key spots and uses to set up strikeouts. There’s the sweepier version, a few miles an hour slower but with much more horizontal movement. He throws that one as a putaway pitch. Then there’s the curveball, slower still and with big north-south movement. He uses that as a change of pace, only when ahead in the count and largely fishing for strikeouts. The three combine to leave batters off balance and lunging.
That blended breaking ball complex looks a lot like Bieber, who followed a similar trajectory to the majors but then rode it even higher, to the 2020 Cy Young. Like Bieber, Bibee has a changeup to complement the bendy stuff. Bibee’s is loopy, 12 mph slower than his fastball, and most useful against lefties. His arm action disguises it enough that he can throw it to righties, too, and he’s willing to use it late in counts after batters have seen mostly fastballs and sliders.
As was the case with Bibee’s fastball, lots of major league pitchers have pitches that vaguely sound like the secondary stuff that I just described. What sets Bibee apart is his placement of those pitches. His fastball lives up in the zone. He attacks the glove-side edge with his hard slider and mixes locations haphazardly with the loopier breaking balls, alternating between placing them for called strikes and trying to pick out a corner or bounce a curveball. His changeup consistently hits the arm-side edge of the plate. He barely walked anyone in the minors, and that has carried over even against major league hitters.
You’ve seen the ZiPS median forecasts. The upside outcomes? Those will come if Bibee takes the next step with his slider by using it proactively and creatively. I keep comparing him to Bieber because we’ve seen that this exact skill set can produce ace-level seasons if everything breaks right. Maybe Bibee will top out as a three-win true-talent pitcher, but the future is unknowable, and he has the tools to break out to an even higher level than he’s already displayed.
For the Guardians, that present talent level is already mighty valuable. They just made the playoffs with Bibee as their no. 1 starter. They’re one of four contenders in the AL Central this year, again with him as their best option in the rotation. It’s a poor starting rotation, if we’re being honest, but that only makes him more important. It’s not Bibee and a bunch of similar options; it’s Bibee and then a bunch of question marks. Despite only two years in the majors, he’s a rock of stability in a sea of uncertainty.
This contract extension buys out either one or two years of free agency, depending on the club option. The value is almost exactly in line with what he’d expect to make in arbitration, plus a reasonable rate for the free agency year(s). This isn’t some outrageous bargain; it’s just two sides agreeing to tamp down volatility.
You can imagine some ways that this deal could end up making Bibee a lot more money than he otherwise would’ve received. Mainly, that’d be because of a future injury: As a fifth-round pick, Bibee never received a huge signing bonus, and he wasn’t due to hit arbitration (and bigger salaries) until 2026. That means he would’ve earned a raise pending health, but “pending health” is a scary phrase for pitchers. By signing this deal, he removed that risk. Now, there are no possible outcomes where Bibee doesn’t end up rich for life.
The Guardians, on the other hand, are getting future cost certainty. Not so much in the arbitration years – the terms of his extension roughly match what ZiPS would expect for those payouts. But let’s put it this way: The Guardians don’t sign big deals in free agency. They haven’t signed a marquee free agent on the open market in 20 years, since they added peak Kevin Millwood before the 2005 season. Those two years of free agency represent something the Guardians have no other way of obtaining – extra team control of very good players.
The Cleveland model has been remarkably successful for a long time now. It’s about constantly remaking the team even while the current version excels, finding new key players to replace the old key players while José Ramírez keeps the tempo. The Guardians deal in two currencies: talent and years. They’re adept at finding talent. Their budget and approach limit them on the years side of things.
In other words, Cleveland is always balancing competing now with competing in the future, and the limiting factor is usually how many years of good players the team has in hand. This extension addresses that directly by adding to the number of years that Bibee will be around, and adding in a way that the franchise can stomach financially. This deal won’t make the Guardians better in 2025, and it won’t even save them money in the immediate future. But now they have one more good player for at least one more year, at a price that makes sense for both sides. They’re in the business of sustainability, and this deal is perfect for their purposes.
In order to bolster their Grayson Rodriguez-less starting rotation, the Baltimore Orioles agreed to a one-year contract worth $5.25 million with free agent starting pitcher Kyle Gibson. The 37-year-old Gibson pitched for the St. Louis Cardinals in 2024, posting a 4.24 ERA and a 4.42 FIP in 30 starts over 169 2/3 innings, good for 1.5 WAR.
In 2023, the Orioles signed Gibson as a veteran arm who could eat innings, a useful purpose for a rebuilding team transitioning to contention and seeking to buttress a patchwork rotation. This was a task that Gibson accomplished successfully that season, scarfing down 192 innings for a 101-win team that lacked any other well-established starting pitchers. After the emergence of Kyle Bradish and Rodriguez’s relatively successful big league debut, the O’s saw less need for a caretaker starter in 2024. So Gibson moved on to St. Louis, a team that was stung in 2023 by the fact that nearly every starting pitcher except Miles Mikolas missed significant time due to injuries. While the 2024 Cardinals didn’t get back to to the playoffs, their failures could hardly be pinned on Gibson, who put up his typical workhorse season, finishing second in innings on the Cardinals, just behind Mikolas.
With the Cardinals in transition and seemingly determined to do nothing of substance during the offseason, they made little attempt to retain Gibson’s services for a second year. As one of the last remaining starting pitchers in free agency with a résumé to command a major league contract, it was likely only a matter of time until Gibson found a suitor to sign him. He joins a familiar club facing a familiar situation, as the Orioles are once again dealing with a thin starting rotation. Corbin Burnes is gone, Rodriguez is out with a triceps injury, and Bradish isn’t expected back for a while after undergoing Tommy John surgery last June. Over the winter, Baltimore added two-time All-Star Charlie Morton and NPB veteran Tomoyuki Sugano to make up for the loss of Burnes, but considering Morton is 41 and Sugano is a 35-year-old control pitcher who hasn’t yet played in the U.S., both of them come with plenty of risk attached.
The hope for the Orioles is that Gibson becomes unimportant to the roster sometime in the summer, as Rodriguez, Trevor Rogers, and prospect Chayce McDermott (no. 71 overall, 50 FV) return from injuries, with Bradish possibly due back in the second half, but this would represent a best-case scenario. Gibson’s contract reflects this uncertainty; based on innings and games started, he can earn just over another $1.5 million in incentives.
Gibson doesn’t have a fastball that flirts with 100 mph or one of those crazy 90-mph changeups that would have seemed like a tall tale 30 years ago. What he does do is make the most out of a six-pitch repertoire, resulting in a better pitcher than one might expect from his middling stuff. Star-level performances get teams to the playoffs, but so too do players with immaculate attendance. It may seem weird, but Gibson’s 112 wins is enough to rank him sixth among active pitchers, and he also ranks seventh in starts and eighth in innings. These three metrics aren’t indications of excellence, but competence, and that also has value.
ZiPS Projection – Kyle Gibson
Year
W
L
ERA
FIP
G
GS
IP
H
ER
HR
BB
SO
ERA+
WAR
$
2025
7
8
4.55
4.53
25
25
138.3
143
70
19
54
117
87
0.8
$4.6M
ZiPS Projection Percentiles – Kyle Gibson
Percentile
ERA+
ERA
WAR
95%
117
3.41
2.7
90%
108
3.69
2.2
80%
100
3.97
1.7
70%
95
4.17
1.4
60%
91
4.39
1.0
50%
87
4.55
0.8
40%
84
4.73
0.5
30%
79
5.02
0.1
20%
75
5.30
-0.2
10%
69
5.78
-0.8
5%
64
6.22
-1.3
Suffice it to say, ZiPS isn’t terribly excited about Gibson’s 2025, but then again, that’s beside the point. The O’s are no longer rebuilding or on the cusp of competing; they’re expected to contend for the AL East title. For a lot of teams, signing Gibson would be a bad idea, as they’d get a lot more out of signing a fourth starter with real upside rather than an innings-eater in his late 30s. But for the O’s, they’re getting the right pitcher at the right time, and basically for the right price. Despite my curmudgeonly inclinations, I can’t find a good reason to complain about that.
There are some positions for which a cleaner, wider gap exists between the top teams and the bottom, where we can more definitively say that some teams are better than others. For instance, the combination of talent and depth that the Dodgers, Phillies, and Braves have in their starting rotations separates their projections from the rest of baseball in a meaningful way. Relief pitching is not one of these positions. As you digest the forecasts and player details below, make sure to note how thin the margins tend to be from one team to the next. Also know that relief inning sample sizes are small enough that this is where WAR is the least good at properly calibrating impact and value, a dynamic heightened in the playoffs when the remaining bullpens are all turbocharged by the way the postseason schedule allows for rest, or for an elite starter to work an inning on his bullpen day. Things like coherent managerial usage, roster management, and good or bad health luck tend to play a huge role in the way bullpens perform throughout a season, and those are factors we can’t totally control for here. Read the rest of this entry »
After an impressive rookie season for the Rockies in 2023, Nolan Jones struggled mightily last year, missing roughly two and a half months due to recurring lower back woes and a left knee injury, and slipping below replacement level when he was able to play. On Saturday, the Rockies traded him back to the Guardians — the team that originally drafted and developed him — in exchange for superutilityman Tyler Freeman. It’s puzzling to see the Rockies punt a player who just a year ago appeared to be a franchise cornerstone, particularly as their acquisition of Freeman is driven by the loss of starting second baseman Thairo Estrada to a broken wrist, a short-term problem considering Colorado is unlikely to contend this season.
The 26-year-old Jones hit just .227/.321/.320 (70 wRC+) with three homers in 297 plate appearances for the Rockies last season while splitting his time between left and right field. His 67-point drop from his 137 wRC+ in 2023 tied for the second largest in the majors:
While Jones has shown that he can be a productive major leaguer, the same can’t yet be said for the 25-year-old Freeman, who hit .209/.305/.321 with seven homers in 383 PA for the Guardians last year while mainly playing center field but spotting at second base, shortstop, and third base. His 84 wRC+ was his highest mark in parts of three major league seasons, which isn’t saying much. Read the rest of this entry »
After wrapping up our position player rankings last week, we turn our attention to the league’s pitchers, starting with the bullpens in the bottom half of the reliever rankings.
It’s impossible to project relievers. The pitchers themselves are random enough, sprouting new pitches or gaining five ticks on their fastball with no prior warning. Pitchers also tend to get injured, especially the ones who go max effort on every pitch. And then there’s the randomness of 60-inning samples, where a fly ball sneaking just past the glove of a leaping outfielder can catapult an ERA from respectable to disastrous. This is all to say that the task of forecasting a bullpen’s performance over the course of a single year is destined to fail.
So I’ll take this introduction as an opportunity to encourage you to not take the order of these rankings too seriously. Less than one-tenth of a win separates some of these teams. There is perhaps just one truly terrible bullpen in the mix; every other team essentially has a mix of proven shutdown guys, solid middle-inning depth, and intriguing wild cards. With that said: To the rankings! Read the rest of this entry »