As Derek Jeter goes, so goes Ichiro Suzuki. For the second time in the history of the National Baseball Hall of Fame, a candidate with an impeccable résumé has missed unanimous selection by a single vote from among nearly 400 ballots, leaving Mariano Rivera as the only player to run the table. Nonetheless — and far more importantly — Suzuki is Cooperstown-bound. In the voting results that were announced on Tuesday evening, Suzuki received 99.7% of the vote, and was joined by two other honorees, namely first-year candidate CC Sabathia (86.8%) and 10th-year candidate Billy Wagner (82.5%), the latter after missing election by just five votes last year.
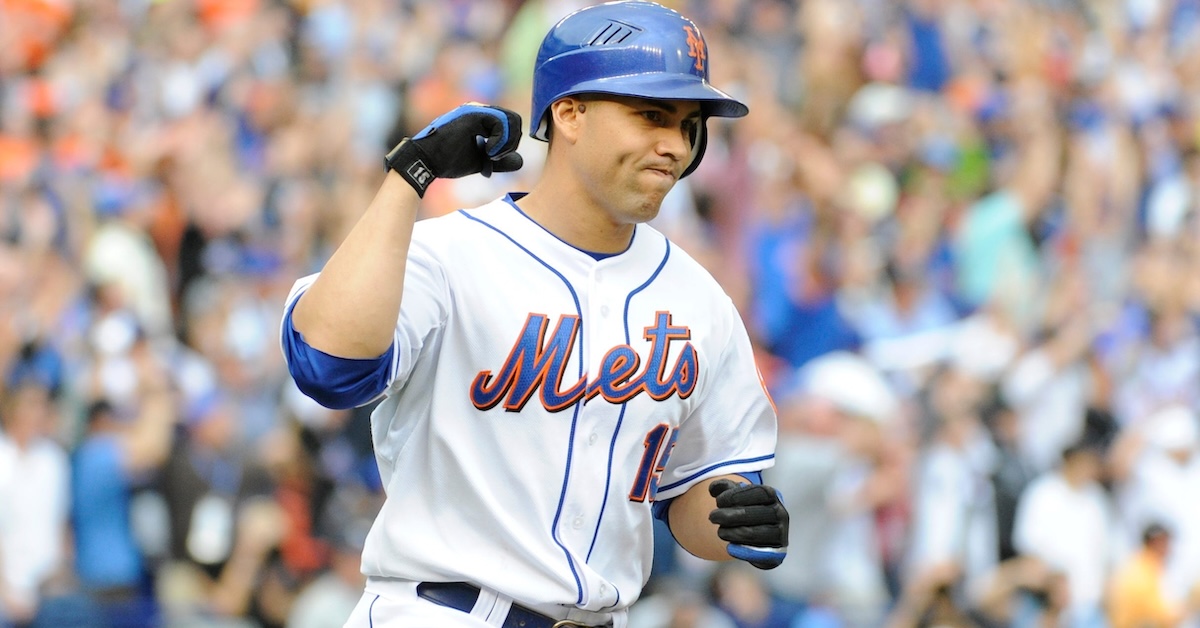
Based upon the 216 ballots published in the Ballot Tracker prior to the announcement of the results, the only questions that carried real suspense were whether Suzuki would be unanimous and whether third-year candidate Carlos Beltrán would clear 75%. Beltran received 81.5% of the vote on published ballots, but finished with 70.3%, still a healthy 13.2-point jump from last year. Eighth-year candidate Andruw Jones, whose Tracker share hovered just below 75% for most of the cycle, finished with 66.2%. No other candidate received more than 40%, with second-year candidate Chase Utley (39.8%) the closest. Beltrán and Jones are well-positioned for election with next year’s slate, which lacks any candidate likely to be honored in his first year; Cole Hamels and Ryan Braun head that class.
This is the second year in a row that the writers have tabbed three candidates, after last year’s trio of Adrian Beltré, Todd Helton, and Joe Mauer, and the seventh time in the past 12 cycles that the writers have elected more than two candidates. Over the 2014–25 span, the writers have elected 30 candidates, that despite one shutout (2021) and two cycles with just a single honoree (’22 and ’23). Read the rest of this entry »
Look, I get it. You’re up in arms about the Roki Sasaki deal. The rich got richer and we’re all tired of the Dodgers signing every free agent (even you, Dodgers fans) — can they at least make it seem like it’s a level playing field? If that’s how you’ve been feeling this week, though, I’ve got some bad news for you, because I think the two moves the Dodgers have made since signing Sasaki might be bigger deals for 2025. Over the weekend, they signed the top reliever on the market, Tanner Scott. Now, they’re reportedlyworking on an agreement with Kirby Yates. As Yates’ signing is still pending a physical and has yet to be finalized, let’s cover Scott first, then ruminate on Yates at the end.
Scott’s deal, for four years and $72 million, befits an elite reliever, and that’s exactly what he is. He’s compiled a 2.04 ERA (2.53 FIP) across 150 innings over the last two years, using a lights-out slider and excellent fastball in roughly equal measure. We’re not talking about smoke and mirrors here; both of our pitch models think his fastball is one of the best handful in the game. His gaudy swinging strike rates provide supporting evidence. He sits 96-98 mph and touches 100. Sure, he walks his fair share of batters, but he’s a reliever – that’s just part of the bargain you accept sometimes.
If you’ll recall, the Dodgers leaned heavily on their bullpen in the 2024 postseason. Some of that was because of injuries to the starting rotation, but plenty of it was by choice. The Dodgers assembled a unit with four late-game options, and they used those options aggressively and opportunistically. Best opposing hitter up in the sixth inning? Send in a closer. Starter in a jam and the game on the line earlier than you expected? Send in a closer. Save situation? Fine, sure, we have a few left over anyway, send in a closer. Read the rest of this entry »
As an aside: I love the tracker, partly because it’s in the best traditions of citizen journalism/archivism, and has been made essential within its niche by the enthusiasm and thoroughness of the people who run it. It reminds me of The Himalayan Database, which is considered the definitive list of all the climbers who have summited the highest mountains in the world. The Database was founded and run not by a sponsor or NGO, but by a single journalist, Elizabeth Hawley, who tracked, verified, and published ascents from the 1960s until her death in 2018. In this age of corporatization, conglomeration, and misinformation, it’s invigorating to see a single trusted list of Things That Happened published online somewhere by people who care about the historical record.
Anyway, last week, I noticed a fresh shipment of ballots from voters representing the Philadelphia BBWAA chapter, which included a swell of support for Jimmy Rollins’ candidacy. By Sunday, as I was looking over Inquirercolumnist Marcus Hayes’ ballot, I found myself experiencing an unexpected combination of emotions. Read the rest of this entry »
It must have been fifth grade or so when I encountered the “compare and contrast” essay prompt for the first time. I remember thinking: What the hell? These two passages were written by different people. Why is it on me to tell you what is similar about them?
Over the years, I got better at these prompts. But it appears I’ve regressed. Two relievers signed eight-figure contracts last week. What’s similar? They both closed out games for World Series-winning teams in the 2020s, will likely handle the eighth inning for their new employers, and were born in the glorious and blessed year of 1993. What’s different? One throws right-handed, one throws left-handed. One signed with a contender; one perhaps got paid a premium so his team can try to avoid an MLBPA grievance.
But there are limits to the illuminating qualities of comparison. These days, individualized analysis is required to assess the effectiveness of a pitcher, so that’s how this post will proceed today. A.J. Minter and José Leclerc will earn life-changing quantities of money to chuck leather a few dozen times. Let’s find out why. Read the rest of this entry »
Based upon the early returns, BBWAA voters appear likely to hit another trifecta on Tuesday when the results of this year’s Hall of Fame election are announced at 6 p.m. Eastern — and there’s even an outside chance that a fourth candidate could crash the party. But if the FanGraphs readers who participated in this year’s crowdsource ballot had their way, only two players would make the cut. In this year’s edition of our annual polling, which for the second year in a row set a new record for turnout, first-year candidates Ichiro Suzuki and CC Sabathia were the only ones who topped 75%. Billy Wagner fell short despite the strong likelihood of his getting the call from the Hall in his 10th and final year on the ballot, and Carlos Beltrán — who has polled above 80% on the ballots released publicly thus far — missed out as well.
I’ll take a closer read of the tea leaves based upon the writers’ ballots that have been revealed, but first, let’s consider the readers’ entries. Registered users who participated in our poll were each allowed to submit one ballot with up to 10 candidates by the end of the day on December 31, just like roughly 400 BBWAA voters did for this year’s actual election — only we ink-stained wretches had to get to a mailbox with a prepaid envelope, where our users voted electronically. After more than tripling our turnout from 2023 (an unusually low year) to ’24 to set a record, we added another 344 votes this time around, a 20.7% increase:
Last week, Michael Rosen wrote about Jack Flaherty’s delayed free agency market. Michael advanced a number of theories about why Flaherty hadn’t yet signed a deal, and what that might mean about his fastball, teams’ perceptions of his fastball, and the trajectory of his career broadly speaking. I found that piece really interesting – and I also started thinking about what Flaherty not having signed yet means in a larger sense.
You don’t have to look any further than last year to get an idea of what could happen to Flaherty. Blake Snell and Jordan Montgomery both waited a long time before settling for short-term deals. The year before that, Carlos Correa’s multiple failed physicals kept him on the market until the very end. In 2022, Correa, Kenley Jansen, and Trevor Story all found themselves looking for employment well into March.
All of those players came into the offseason expecting a major contract, and all of them ended up getting less than anticipated, bringing to mind some classic FanGraphs articles from Travis Sawchik, back in the halcyon daysof2018. Those articles drew on a study by Max Rieper that separated free agents into pre- and post-New Year’s signings and found a large discount for the latter group. Read the rest of this entry »
As soon as we get on the phone, Susan D’Andelet tells me that she was at Camden Yards for Jackson Holliday’s first career home run, a monster grand slam that landed out on Eutaw Street a few days earlier. “I went for work, actually,” she clarifies. “We took some of our clients.” It’s August, and as the Orioles challenge the Yankees for the best record in the American League, all of Maryland is buzzing with excitement. “Oh yeah,” she says. “I know they’re calling up another guy from, what is it, Double-A or whatever?” She lets out a big laugh. “You would think I would know more.”
Sports have surrounded D’Andelet (pronounced dee-ON-duh-LAY) her whole life. When her son was a child, he played alongside Bobby Boyd, a speedy outfielder who batted .331 at West Virginia University and spent four years in the Astros system. Boyd is now a CPA, D’Andelet tells me. Her husband is a sports fanatic who often coached their son’s teams. After they met, the couple discovered that their fathers had played together on the same football team, the Langdon Lions.
“I’m a sixth-generation native Washingtonian,” she says. “My dad grew up in D.C. and played all sorts of sports.” She remembers being dragged to Senators games and watching him play softball well into his 30s, before giving it up in favor of golf and fishing. His most enduring contribution to sports was an idea: He was William H. Williams, inventor of the cleat cleaner.
I wrote about the cleat cleaner last year, looking up the patent history to identify Williams as its inventor. A few months after my piece was published, D’Andelet was at a dinner party. “This baseball game happened to be on,” she recalls, “and I said to my friend, who I’ve known since high school, ‘Do you see that mat on the back of the pitcher’s mound?’ And I told her, ‘My dad invented that.’” The revelation earned her a skeptical look.
D’Andelet continues, “We’ve known each other probably 50 years. She said, ‘You’ve never told me that before.’ And I said, ‘Well, I didn’t think it was important.’ You know what I mean? It’s just not something that would necessarily come up. So anyway, I said, ‘Yeah, my dad invented that.’ She kind of looked at me – which people do – like, ‘Yeah… I don’t know about that.’” D’Andelet Googled it to prove her point, and happened upon my article, replete with images from her father’s patent request. She still has the originals.
Courtesy of Susan D’Andelet
The cleat cleaner is easy to overlook. Our attention is naturally drawn to incongruity, whereas the cleat cleaner is exquisitely logical and its presence on the back of the mound makes so much sense that you take it for granted. You can stare at it night after night without ever really seeing it. It might never come up in conversation, even if you spent your childhood helping your parents build a business around it. “Everybody knows it’s there, but they don’t think much about it,” D’Andelet says. “So I just thought it was interesting that you were interested.” She reached out a few days later, and when I asked whether she’d be interested in sharing her memories, she was enthusiastic about telling her father’s story.
Williams, known since childhood as Bunky, died from COVID pneumonia in February 2022, just shy of his 95th birthday. He came up with the idea for the cleat cleaner when D’Andelet and her two brothers were small children. “We lived in an apartment in D.C. when my parents had us,” D’Andelet says. “So my mother had three children under three years old. And we were in a one-bedroom apartment in Washington D.C., right off New Hampshire Avenue. I remember that. And then we moved out to the house where it was invented, in Silver Spring, Maryland, 701 Hobbs Drive.”
Courtesy of Susan D’Andelet
Williams was a vice president at American President Lines, an international shipping company. “He worked for them his whole business career, 30-some years, and the cleat cleaner was something that he did in the basement,” D’Andelet says. He lobbied on behalf of the company, often on Capitol Hill, though D’Andelet is quick to point out that he wasn’t registered as a lobbyist and never would have assented to being called one. And despite his invention, Williams wasn’t trained in engineering. “No, not at all, but he was very capable of doing a lot of things,” she says. “He was clever, and he was a smart man.” The house on Hobbs Drive had an unfinished basement, so Williams finished it himself, eventually creating a workroom with “a big old wooden workbench.” Aptly, his middle name was Handy.
Williams toiled in the workroom during the evenings, but the cleat cleaner was a family endeavor from the very beginning. “We had a little cottage industry in our home before it was fashionable,” D’Andelet says. Williams made the first prototype out of toys and a spare plank of wood. She remembers being a child and seeing him “drilling out the holes in that piece of wood, and taking my brothers’ plastic toy rockets and cutting them off and putting them in the holes.” The rockets came from sets of those little green army men that many of us had as children. “That’s what he got his patent on,” she says. Did her brothers protest about sacrificing their rockets to the cause? “No, I don’t think so. He might have even broken down and bought extras,” she says with a laugh. “We didn’t have a whole lot at that stage in our lives. He was probably in his 30s and we were all little kids.
Williams tested his prototype the same way anyone would. “I can remember him getting the dirt muddy, squirting it down with the hose in the backyard, getting a big patch of mud,” D’Andelet recalls. “He would have the baseball cleats on himself, and he would get a big old wad of mud on the cleats and then use the cleat cleaner. And so I imagine that he went through a number of these to get it right.” Once he’d perfected the design, Williams applied for and received a patent in 1963. “He found a place in Baltimore that would manufacture them,” she says. “He had a mold created, and had the company in Baltimore make these products. I remember my mother would load us all into the car and drive us to Baltimore, and we’d load them all in the trunk. What I remember in particular was that the rubber that they were made out of stunk. And the whole basement stunk.”
Courtesy of Susan D’Andelet
D’Andelet’s mother, Nettie Williams, now lives with her in Delaware. “She’s a delightful person, always was and still is. Very much a team player.” As the business got going, D’Andelet says, “my mother was really the one who was running it. She was a stay-at-home mom and she had the three of us. And when he started with this, she was right there at his side doing whatever needed to be done.” They initially marketed the cleat cleaner as a football product, sending mailers to NFL teams. “She did all the banking and bookkeeping, and the invoices would come in and she’d fill the orders.” Nettie made regular visits to the bank in Montgomery Country, often being served by the same young teller. “He was trying to figure out at the time why she had all these checks with the logos of the professional football teams on them,” D’Andelet says. One day, the bewildered teller finally asked whether Nettie was a cheerleader. “I guess that was the only thing he could come up with.”
Nettie went to secretarial school, so she was Bunky’s at-home secretary. D’Andelet remembers how he would return home after work, walk through the door, and say, “Nettie, take a letter!” Thinking about the scene now, D’Andelet laughs. “So she’d get her stenographer’s pad out and do shorthand, and be in there typing up letters to all the professional teams — the professional football teams and then eventually the baseball teams. And so she was the jack-of-all-trades. So whatever needed to be done, it was her and us. We were the cheap labor… Whether it was stuffing envelopes with flyers, or putting stamps on the envelopes. We would package up the cleat cleaners, initially it was in boxes, and we would address them and tape them up and take them to the post office. Everything that was done, we did.”
Courtesy of Susan D’Andelet
Although they started with football, cleat cleaners became more associated with baseball because they sat on the back of the mound, in clear view of millions of home viewers. Yet, despite the product’s popularity, Williams “didn’t make a killing from selling the cleat cleaner,” D’Andelet says, “It wasn’t what we lived off of. It was just a little aside for him. He saw that there was a need for this.”
It remained a cottage industry. When she was in her early 20s, D’Andelet’s friend, Chris Williams (no relation), posed for flyers. “He was the shoe model – or the foot model, or whatever you want to call it,” she says. “He played baseball a lot. He was very active. And my dad would have him put the cleats on and get them all muddied up, and try to get the mud out with the cleat cleaner and take pictures.”
Williams also invented a kicking tee. “That never really took off,” D’Andelet says, “and I don’t know why. It was called the Sky Tee and it sat on his rolltop desk.” At some point, the manufacturer in Baltimore was bought by another company. The new owner mistakenly believed that they also owned the mold, and Williams needed a lawyer to help him get it back. He kept the business going into his mid-80s, and you can still find the original cleatcleaner.com website, from 2001, on the Wayback Machine.
After making cleat cleaners for 50 years, Williams sold the business, along with the original mold, about 10 years ago. Before he did so, he asked whether anyone in the family wanted to take over. D’Andelet has spent her entire career in the mortgage, title, and real estate industry, and she just couldn’t see herself continuing the business. “It would have been nice,” she says. “It was kind of hard to say no.” She still has some cleat cleaners, but they’ve been in storage since a move a few years back.
D’Andelet still sees reminders of her father. On the highway, she sometimes finds herself alongside 18-wheelers hauling American President Lines shipping containers. “And you’ll see the ships. I see them sometimes when I’m going over the Chesapeake Bay Bridge. I’ll see the ships going along with the APL.”
The cleat cleaner is more widespread than ever. The patent expired back in 1980, and these days, there’s no shortage of companies manufacturing them. They come in an ever-expanding variety of styles, shapes, and colors, but Williams’ original design, the one that started as a plank of wood and sawed-off toy rockets, is still in production. And despite her best efforts, D’Andelet isn’t going to escape sports anytime soon. “I ended up marrying a man who was as interested in sports,” she says, building up to the punchline. “I said, ‘Look you can play all the sports you want to. Don’t expect me to come sit there and watch it.’”
The Toronto Blue Jays have finally signed a free agent slugger, agreeing to a five-year, $92.5 million deal with outfielder Anthony Santander on Monday afternoon. A former Rule 5 pick out of Cleveland, Santander has spent his whole major league career with the Baltimore Orioles. He’s amassed 9.6 WAR, 155 home runs, and a 113 wRC+ in 2,830 plate appearances since his 2017 debut, but these numbers are also dragged down a bit by the fact it took him a few years to really get going as a hitter. Since the start of 2022, his age-27 season, he’s been worth 8.3 WAR and posted a much sunnier 124 wRC+. This past year was the best full season of his career thus far; he slashed .235/.308/.506 and set career highs with 44 homers, a 129 wRC+, and 3.3 WAR en route to earning his first All-Star selection and Silver Slugger award.
Anthony Santander and Blue Jays are in agreement pending physical, sources say. @MLBNetwork
Santander’s deal includes a club option for 2030 and an opt-out after the 2027 season, according to multiple reports. The club option is a conditional one; if Santander chooses to opt out, Toronto can void his decision so long as it tacks on the sixth year, which would bring the total value of the contract to $110 million. The options here don’t change the calculus of the deal all that much. Considering Santander is already 30 and doesn’t offer much more than his power, he probably won’t risk the security of his contract unless his production with the Jays exceeds what he did with the Orioles — and even then, he might rather stay put. Similarly, the Jays probably won’t exercise their option for the sixth year unless he continues to be a viable middle-of-the-order slugger into this mid-30s. Read the rest of this entry »
The following article is part of Jay Jaffe’s ongoing look at the candidates on the BBWAA 2025 Hall of Fame ballot. For a detailed introduction to this year’s ballot, and other candidates in the series, use the tool above; an introduction to JAWS can be found here. For a tentative schedule, see here. All WAR figures refer to the Baseball Reference version unless otherwise indicated.
2025 BBWAA Candidate: Adam Jones
Player
Pos
Career WAR
Peak WAR
JAWS
H
HR
SB
AVG/OBP/SLG
OPS+
Adam Jones
CF
32.6
25.7
29.2
1939
282
97
.277/.317/.454
106
SOURCE: Baseball-Reference
Adam Jones was Mr. Baltimore. Though he was born in San Diego and began his major league career in Seattle, Jones took to Baltimore upon being traded to the Orioles in 2008. On the field, he set an example for younger teammates during lean years, and his combination of power, speed, and graceful defense eventually helped the team end an epic streak of futility. He served as a starter on the Orioles’ first three playoff teams in this millennium, winning four Gold Gloves and making five All-Star teams. Off the field, Jones invested in the city, annually donating a significant chunk of his salary to the local Boys & Girls Club and other charitable endeavors. He emerged as a civic icon, a Black athlete who could relate to the hardships experienced by the city’s Black population, and one who wasn’t afraid to speak out regarding the injustices he saw both locally and nationally.
Jones’ national prominence reached its zenith in 2017 when he made a memorable, iconic catch to rob Manny Machado of a home run while playing center field during the World Baseball Classic — a key moment in helping Team USA win the tournament for the only time thus far. Read the rest of this entry »
Kristian Campbell shot up the rankings last year, and elevating was a big reason why. Known primarily for his athleticism and bat-to-ball skills when he was drafted 132nd overall by the Red Sox in 2023, the Georgia Tech product transformed his right-handed stroke to the tune of 20 home runs and a 180 wRC+ over 517 plate appearances across three levels. Flying under most radar as recently as a year ago, Campbell is now one of the game’s top prospects. Moreover, he has a legitimate chance to break camp as Boston’s starting second baseman.
I asked the 22-year-old infielder about his swing change when the Red Sox held their annual rookie development camp at Fenway Park earlier this week.
“It’s been all about bat path,” explained Campbell, who had a 90% contact rate but just four home runs in his lone collegiate season (he’d been a freshman redshirt in 2022) . “Instead of being flat, or straight down, I’m trying to hit the ball at a good angle. That’s what I lacked coming into pro baseball, hitting the ball in the air. I never really hit for power before last year.”
The proof is in the numbers, and not just ones that can be found on the back of a baseball card. In 2023, Campbell went deep once in 84 professional plate appearances while logging a 48% ground ball rate with a minus-2 attack angle. This past season, the aforementioned 20 home runs — eight each in High-A and Double-A, and four in Triple-A — were accompanied by a 39% ground ball rate and a plus-9 attack angle. His xwOBAcon jumped from .327 to .422.
According to Campbell, his conversion didn’t require a complete revamping of his mechanics. Read the rest of this entry »