Ben Lindbergh, Meg Rowley, and FanGraphs contributor Kiri Oler wrap up the World Baseball Classic, covering Venezuela’s triumph, Team USA’s slump and vibes, and the overall success of the tournament, plus thoughts on Mark DeRosa’s managing and Team USA’s future, the semifinal matchups, the bad calls against the Dominican Republic, the challenge system and pitches that are “too close to take,” the WBC vs. the World Series, when the next WBC should be, and much more.
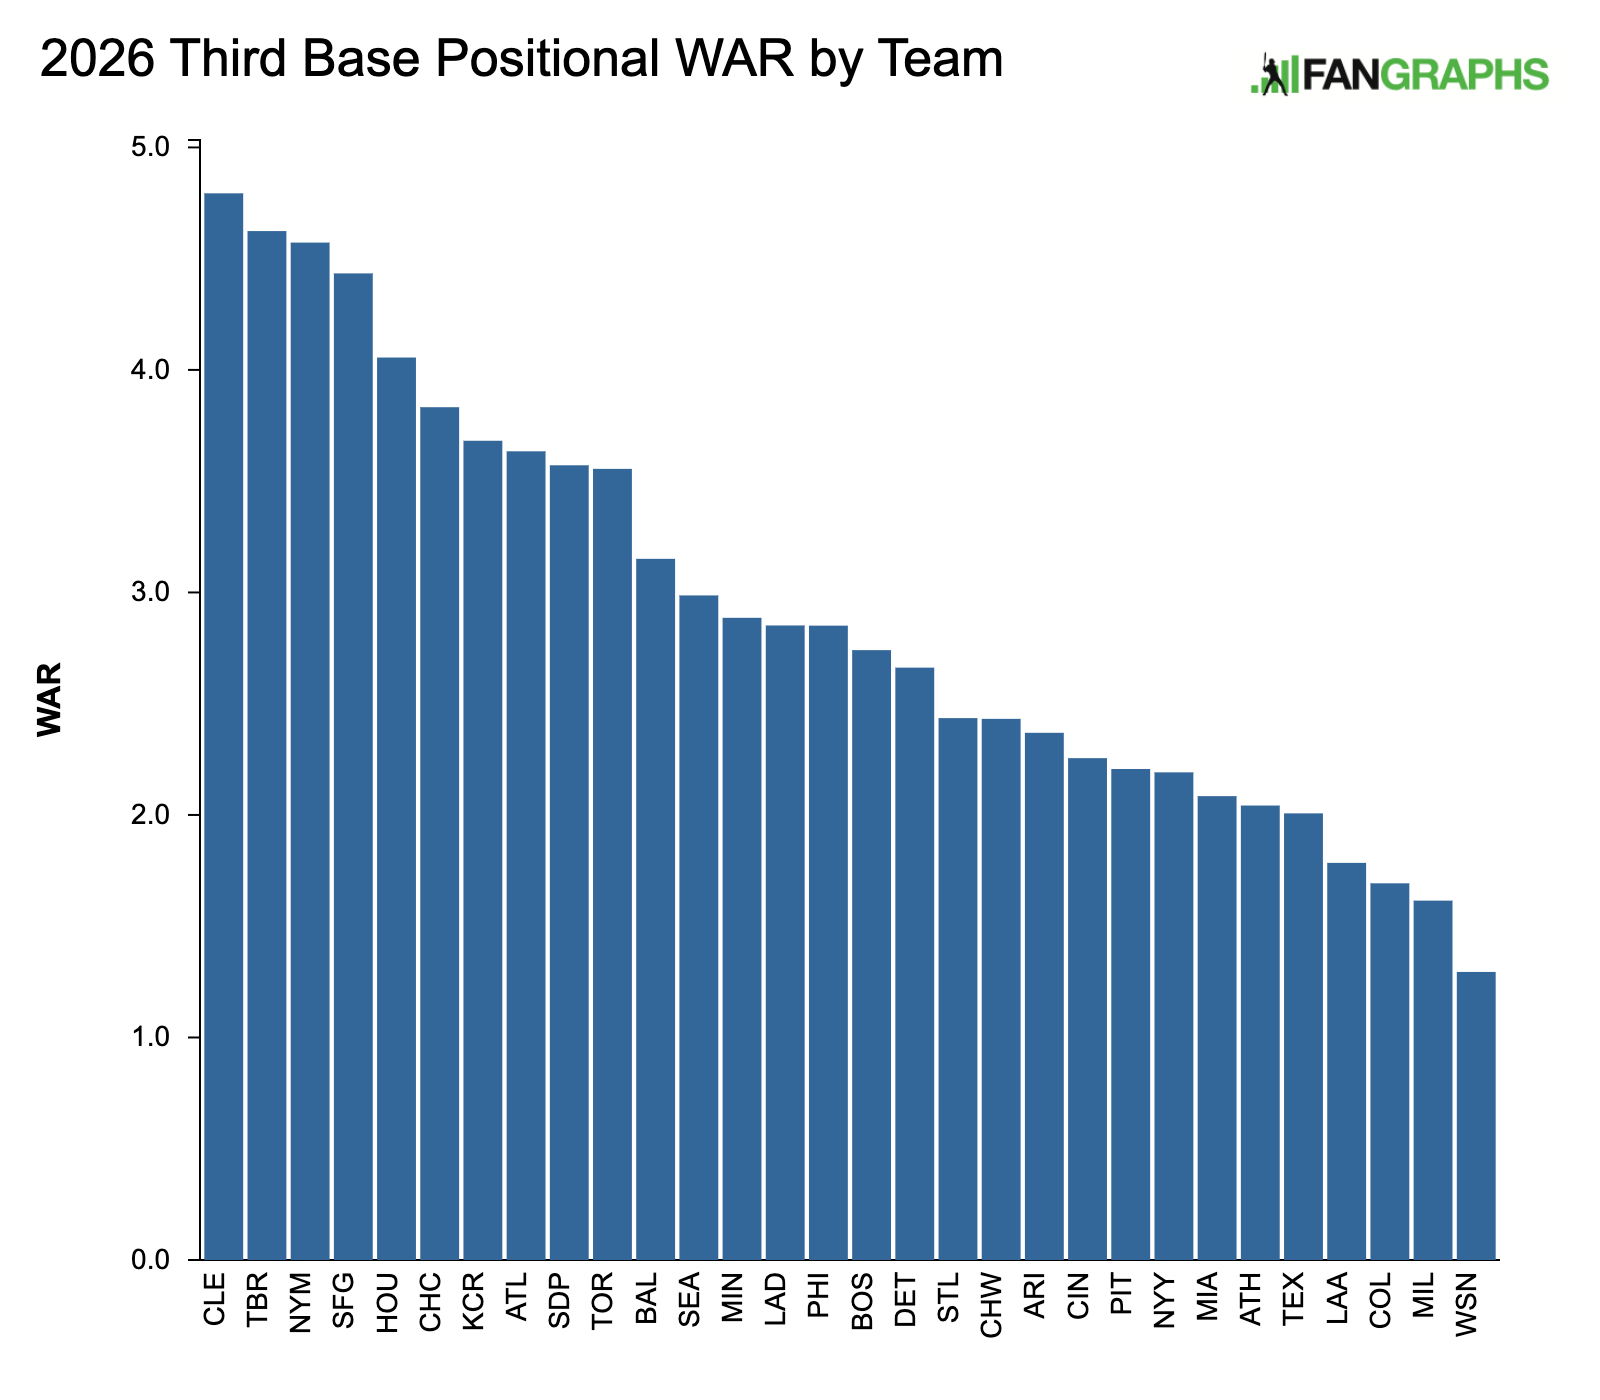
Third base is undergoing a generational change at the moment. The late 2010s and early 2020s were dominated by a group of five superstars: Nolan Arenado, Alex Bregman, Matt Chapman, Manny Machado, and José Ramírez. All five are still in the majors, and you’ll see each of them on today’s ranking. But while Ramírez is still the best third baseman in baseball, and while you’ll also find Bregman and Chapman near the top, there’s a new group of stars breaking in at the hot corner. Junior Caminero is only 22. Maikel Garcia is a threat to embark on a decade-long string of defensive awards, and he turned into a great hitter in 2025 to boot. Bo Bichette and Carlos Correa have joined the party from shortstop. Kazuma Okamoto hit NPB pitching so well that he immediately helps Toronto project in our top 10. The top of this list has changed meaningfully in the last few years, and I expect more of that to come.
That said, there’s a shortage of great third base prospects poised for big league action. Colt Emerson is the best prospect with meaningful playing time projected here, and he’s a shortstop playing out of position. There were only five third basemen listed on our preseason Top 100, and two of them (Kevin McGonigle and Sal Stewart) are starting at different positions in the majors this year. Two of the others have ETAs of 2029, with the third set for 2027. In other words, the veterans will probably have a bit more time in the top half of the rankings even as they decline, because Caminero and Garcia aren’t set to be joined by a broad cohort of young stars. Read the rest of this entry »
Teel is set to begin the season on the injured list. He pulled his hamstring while legging out a double for Team Italy last week at the World Baseball Classic. The diagnosis is a Grade 2 strain, which could keep him out for most of April. It’s an unfortunate start to what was meant to be his first full big league season.
In some ways, this answers a crucial question for the White Sox: Who will start at catcher on Opening Day? Teel, 23, would have been the obvious choice for most rebuilding organizations. He was a top 100 prospect last year before his debut in June, and he then posted a 125 wRC+ in 297 plate appearances. He’s at the forefront of Chicago’s burgeoning prospect pipeline and a key figure as the organization searches for its next core.
But the same can also be said for Edgar Quero, a similarly rated prospect who debuted last year at just 22 years old. Quero is now set for the starting job right out of camp, and he’ll have the first chance to showcase his development in 2026. Read the rest of this entry »
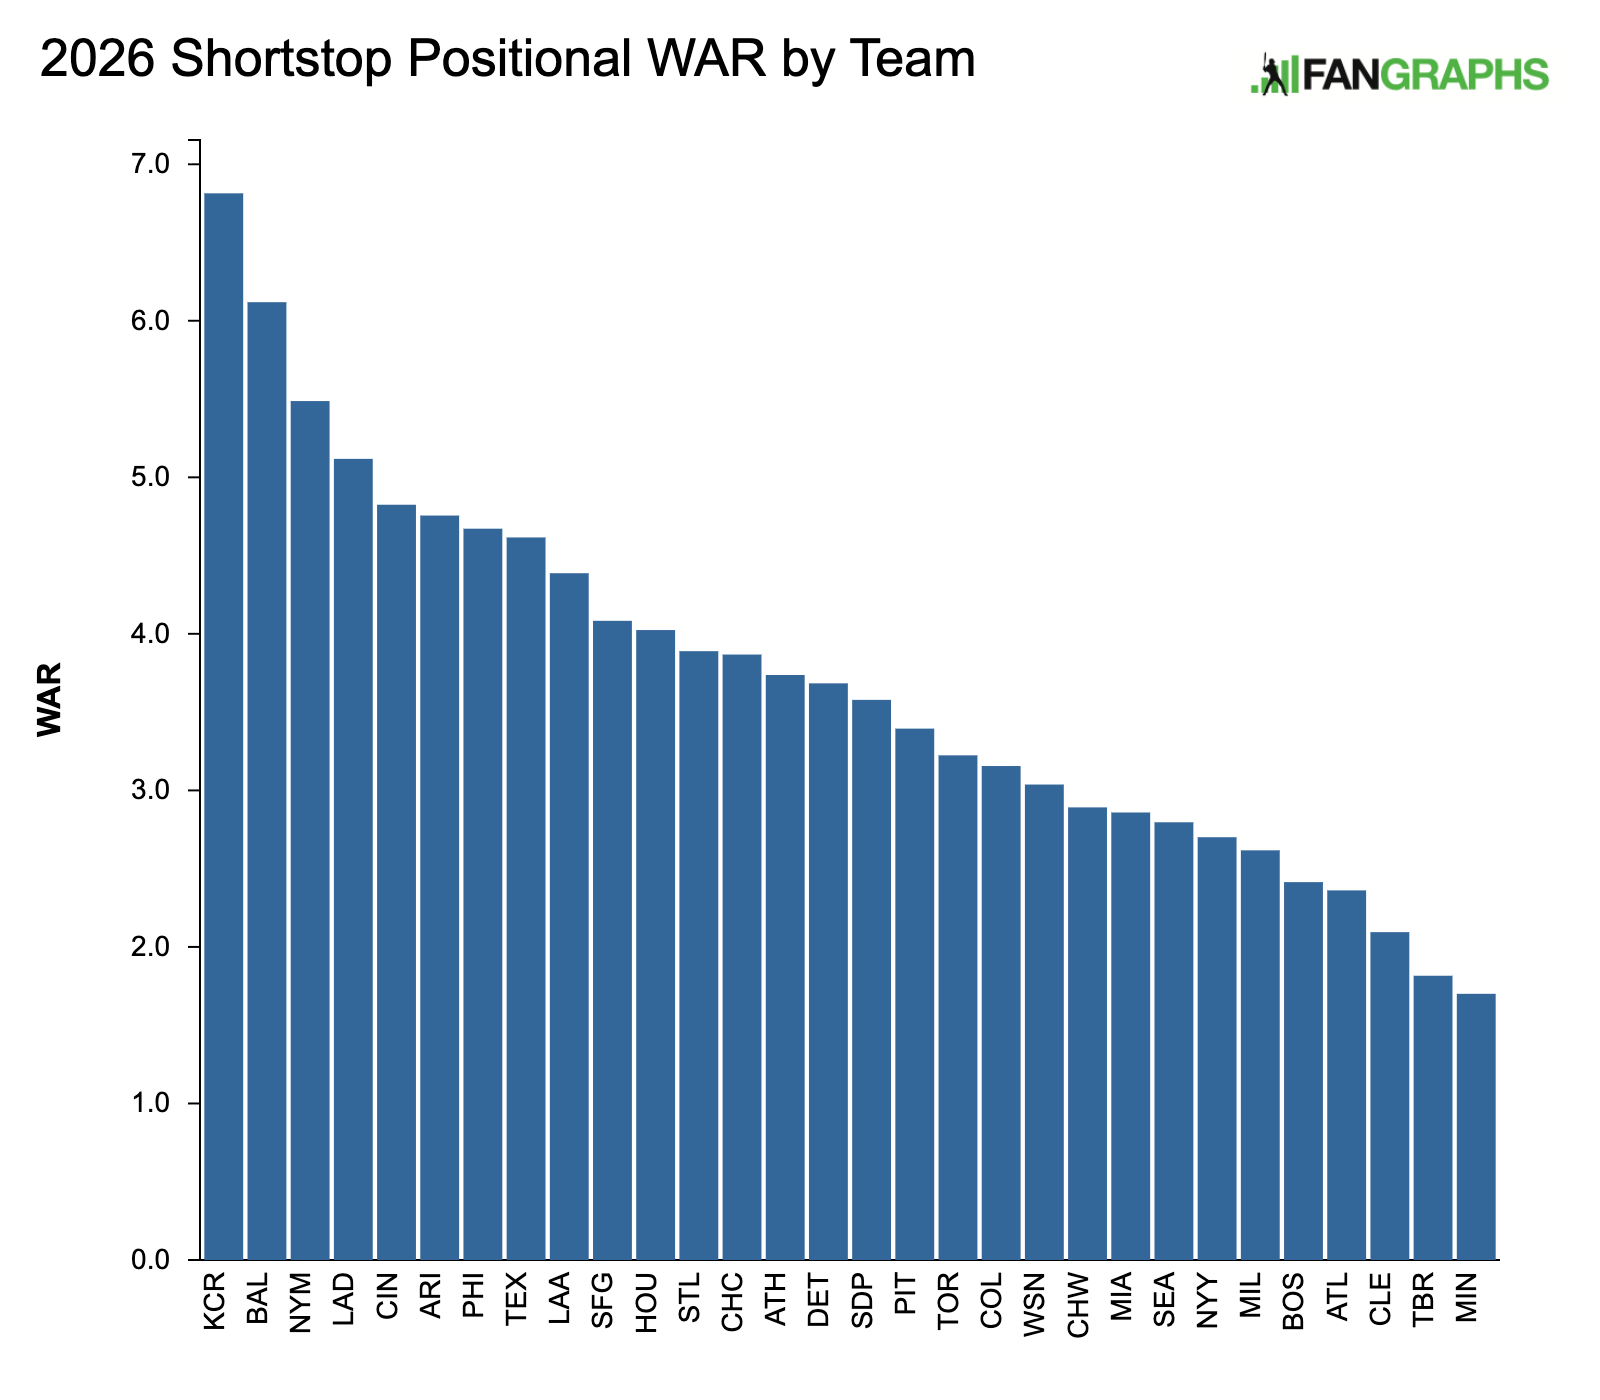
I’m somehow nearing 50 years of age — I’m a little concerned this number seems to be going up by one every 365 days or so — and the position of shortstop has changed a lot since I got into baseball as a small child. Back then, the attitude was defense is what mattered from shortstops, and anything else a team got from the position was gravy. In 1978, the year I was born, only four primary position shortstops with 300 plate appearances had a wRC+ of at least 100: Roy Smalley III, Dave Concepcion, Robin Yount, and the eternally underrated Toby Harrah. Only Smalley and Harrah even hit the double digits in home runs. In 2025, 25 primary position shortstops had double-digit home run totals and 19 finished with a wRC+ in the triple digits. An average player at the position in 1978 slashed .258/.309/.335, a line that would cause teams of today to look for an upgrade unless their shortstop were Ozzie Smith with the glove.
While there were always scattered shortstops who excelled at the plate, they were generally seen as outliers. But that changed as teams became more and more willing in the 1980s and 90s to let their best athletes stay at shortstop until they conclusively proved they shouldn’t be at the position, and larger players like Cal Ripken Jr. and Alex Rodriguez weren’t simply moved to traditional “big dude” positions. Defense remained important, but offense became a really big deal, as many talented hitters demonstrated that previous generations were too quick to move young sluggers down the defensive spectrum. Shortstops are like quarterbacks now; you either have a star shortstop or you’re biding your time until you find one. Read the rest of this entry »
Below is an analysis of the prospects in the farm system of the Houston Astros. Scouting reports were compiled with information provided by industry sources as well as my own observations. This is the sixth year we’re delineating between two anticipated relief roles, the abbreviations for which you’ll see in the “position” column below: MIRP for multi-inning relief pitchers, and SIRP for single-inning relief pitchers. The ETAs listed generally correspond to the year a player has to be added to the 40-man roster to avoid being made eligible for the Rule 5 draft. Manual adjustments are made where they seem appropriate, but we use that as a rule of thumb.
A quick overview of what FV (Future Value) means can be found here. A much deeper overview can be found here.
All of the ranked prospects below also appear on The Board, a resource the site offers featuring sortable scouting information for every organization. It has more details (and updated TrackMan data from various sources) than this article and integrates every team’s list so readers can compare prospects across farm systems. It can be found here. Read the rest of this entry »
Ben Lindbergh and Meg Rowley banter about MLB’s new experimental minor league rules, and the potential downsides of trying to skip straight to a desired on-field result, then complete the 14th annual season preview series by previewing the 2026 Los Angeles Dodgers (35:35) with The Athletic’s Fabian Ardaya, and the 2026 Colorado Rockies (1:30:13) with Rockies Insider’s Patrick Lyons.
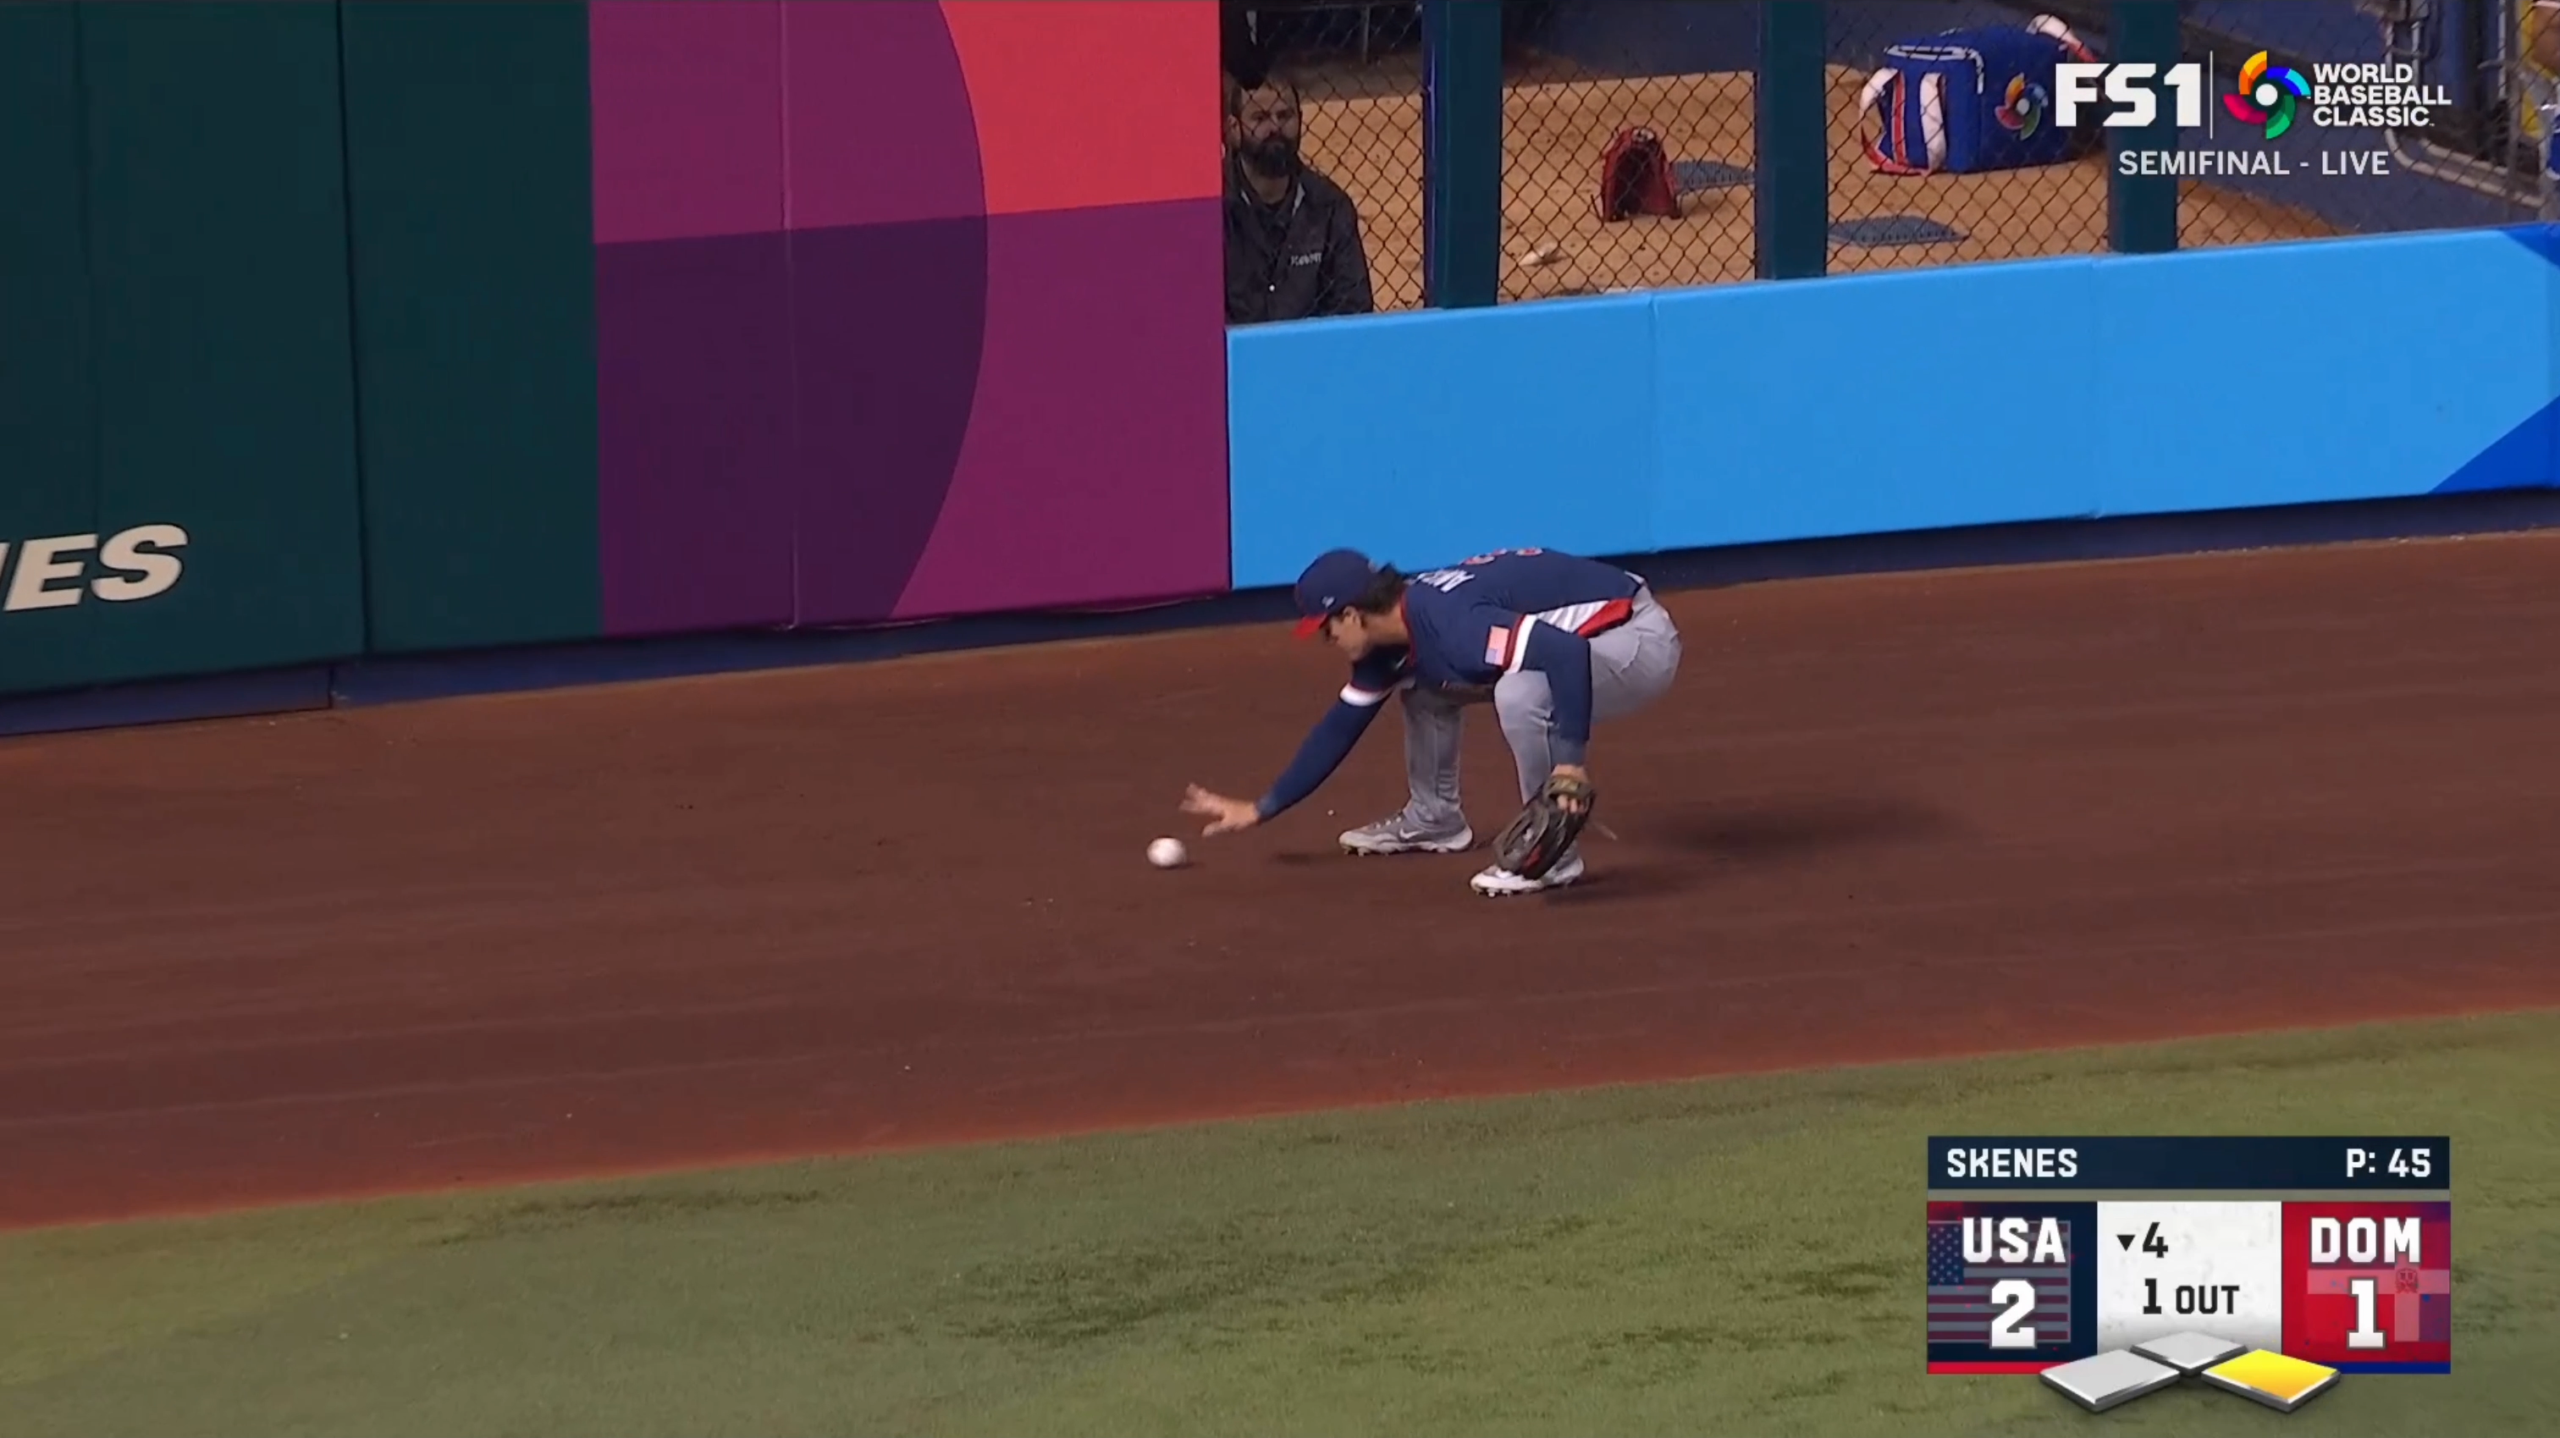
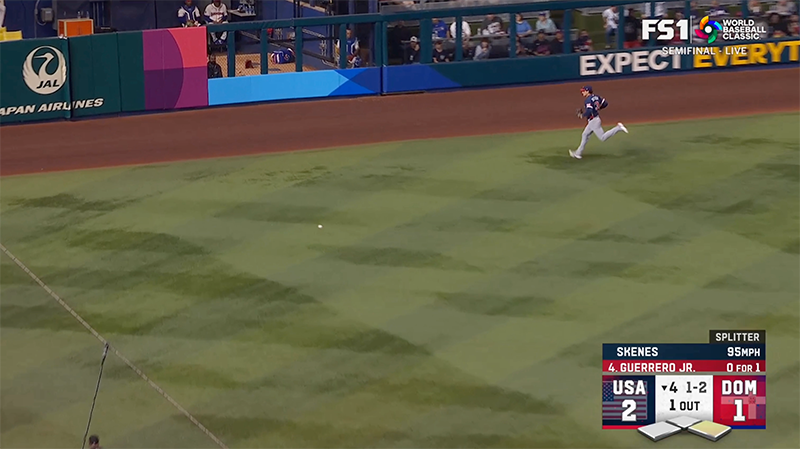
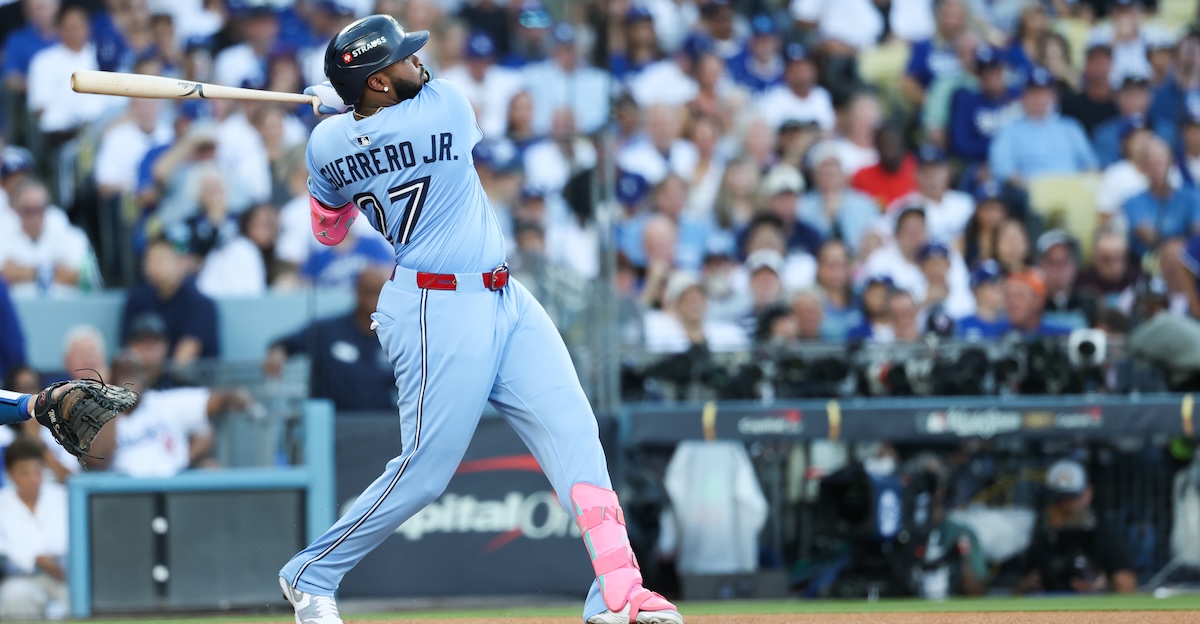
The hardest-hit ball of the World Baseball Classic semifinal between the United States and the Dominican Republic only traveled 191 feet. Vladimir Guerrero Jr.’s fourth-inning double left the bat at 116.1 mph, but it was just the 23rd-longest batted ball of the game, a few feet behind a Ketel Marte popout that was hit more than 40 mph softer. None of this was necessarily shocking. After the play, John Smoltz revealed even he was aware that sabermetric types wish Guerrero would find a way to lift the ball more often and turn some of his scorched groundouts into extra-base hits and extra-base hits into home runs.
This decade, 26% of balls hit 116 mph or harder have gone for home runs, and the lowest launch angle among those home runs was 15 degrees. Guerrero hit his double at just five degrees, and over the past five years, he ranks fourth in baseball with 28 non-homers of at least 116 mph. Five degrees is not the optimal launch angle if your goal is to do damage, but hitting a ball that low and that hard can have other benefits.
One benefit is that the ball can really slow down on its way to the wall. When you hit a screaming line drive or a high fly ball to the wall, it maintains much of its velocity and bounces off hard. When you hit a low liner or a grounder, all that contact with the outfield grass slows it down. Hard as it was hit, this ball didn’t have all that much velocity left, and the padding on the wall absorbed much of the remainder. It rolled back across the warning track and likely would have stopped entirely as soon as it encountered the grass. The outfielder has to wait back, wary of a hard carom bouncing past them, so when the ball dies like that, they need extra time to go get it, giving you more time to coast into second or stretch for third.
A weak carom also carries aesthetic benefits. When a ball is moving that slowly, you can’t field it normally. Below a certain velocity threshold, gloves are more hindrance than help. If you’re picking up a stationary baseball, or one moving at anything below a brisk walk, say 5 mph, it’s harder to pick the ball up off the ground with a glove than it is with your bare hand. Stiff leather fingers aren’t as sensitive or as flexible as real fingers, and the ball doesn’t have enough momentum to roll up into the pocket. Since you have to get the ball to your throwing hand anyway, you’re better off cutting out the middle man and barehanding the ball. It happens every day, but usually it happens for infielders who are dealing with bunts or squibbers. They charge hard, then scoop up the ball and throw it in one motion. It’s a thing of beauty, but it works quite differently in the outfield.
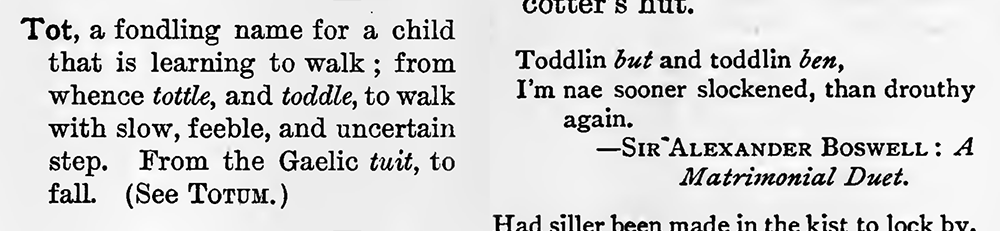
How much have you thought about the word toddler? As you can deduce, it means one who toddles, walking “with short tottering steps in the manner of a young child,” according to Merriam-Webster. The word first appeared in the early 16th century. There were tots, and the way they got around became tottering and tottling, which then became toddling. Finally, a good 300 years later, those tots who toddled became known as toddlers. (Who knows, they may have even enjoyed the occasional hot toddy. It was a different time.)
A Dictionary of Lowland Scotch, Charles Mackay, LL.D., 1888
Of course, toddling isn’t the only hallmark of a toddler. Our balance, motor skills, and proprioception evolve (and then devolve) over time, so we end up moving very differently at each stage of life. For example, when adults bend over to pick something up off the ground, they bend at the waist, but they also tend to put one foot in front of the other and go into a slight lunge to bring their torso closer to ground level. Toddlers have a different approach, getting into a deep crouch and reaching for the item while it’s still way out in front of them. They tuck their chests against their knees and they have to stick their elbows out to make room. Because they’re not yet champions of spatial awareness, they don’t often nail the location of their squat, which is the reason they often end up reaching way out or way across their bodies.
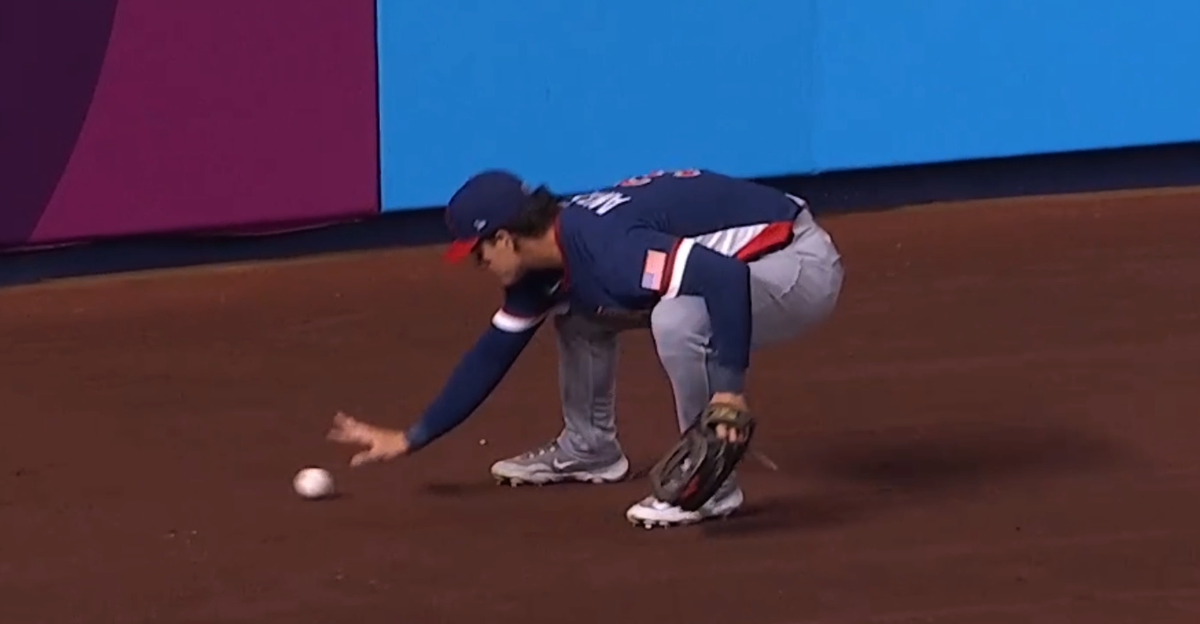
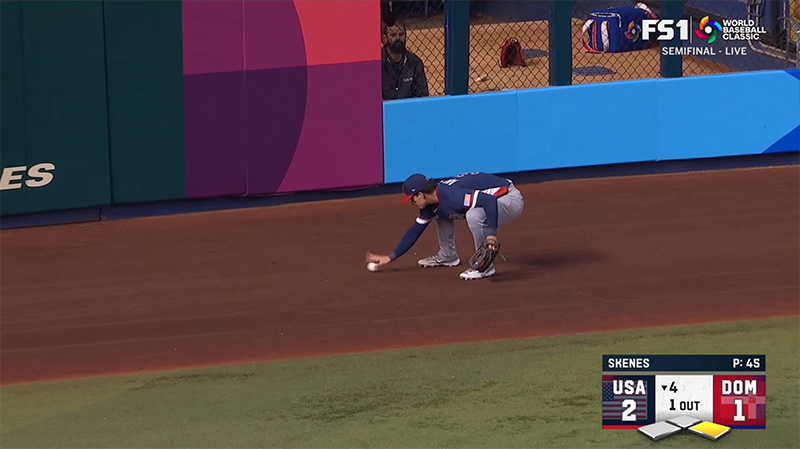
I bring all this up because when Roman Anthony, playing left field for the United States at the time of Guerrero’s blistering low-launch-angle double, loped out to the warning track to field the ball, I couldn’t help but notice that he didn’t exactly look like the Greek god, top-prospect-in-baseball, uber-athlete we’ve come to expect. He looked, uh, different.
Anthony looked either like a toddler playing with a toy dump truck or a grown man doing a pretty convincing impression of an anteater. I’m going to be honest with you. I went through a bunch of pictures of my nieces and nephews, and it didn’t take long to find a photo of a niece in the exact same pose. She’s two years old, and she’s not wearing a shirt or pants because she was just playing in the sprinklers. She’s crouched down to pick up a worm from the garden. She looks exactly like Anthony in the picture above, and I wish I could show you the two side-by-side in the Miami outfield, which I absolutely mocked up in Photoshop. Alas, I cannot do that to my niece, who is no longer two years old.
How did Anthony get into this position? For starters, in the outfield, you’re no longer scooping the ball up gracefully and firing it on the move. The weak carom is the only situation where you have to barehand the ball, and you’re always moving away from the infield to get it, which means you’re running, stopping to pick up the ball, then reversing your momentum to throw it into the infield. It’s a halting, graceless maneuver at the best of times. But other outfielders seem to manage it. Here are Anthony’s Red Sox teammates, Nick Sogard and Wilyer Abreu, making similar plays.
They chop their steps and time things so that the ball arrives between their feet rather than way out in front of them. They get low to field the ball, but their chests aren’t tucked tightly against their knees. They still look like athletes. To be fair, they’re also benefitting from a more flattering angle, but let’s break down the video of Anthony on Guerrero’s double frame by frame just to make sure we understand the progression.
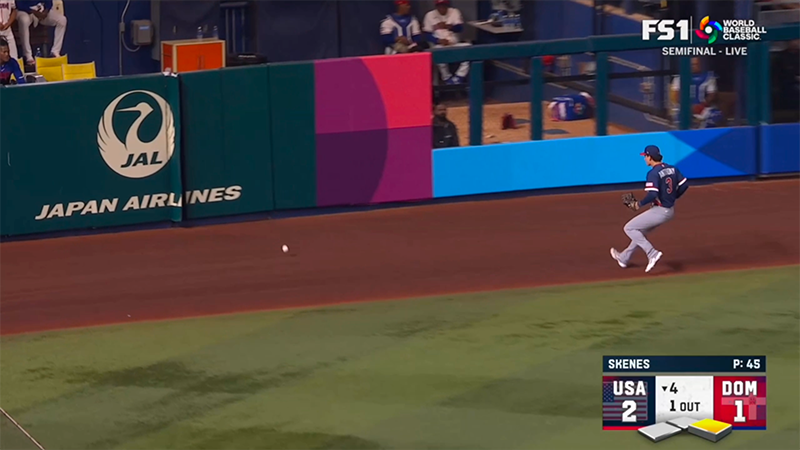
Here’s Anthony running after the ball with his trademark long, graceful strides. He’s a 6-foot-3 miracle with a 55 current value on his run tool.
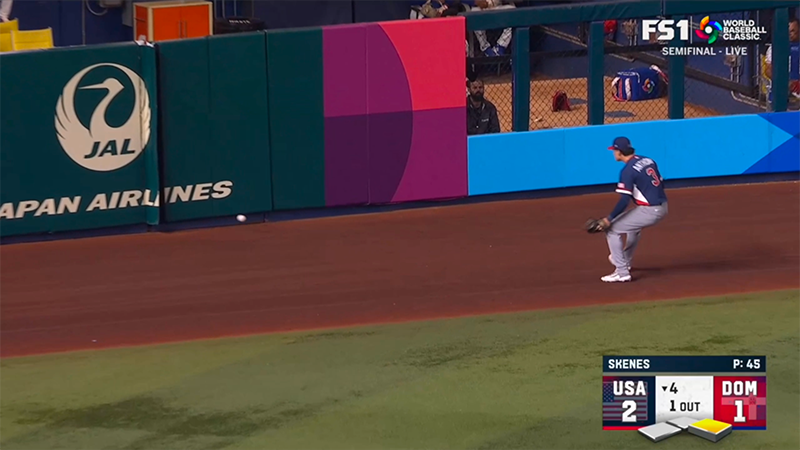
Next, here he is putting on the brakes. He may be slowing down, but the picture is still alive with movement as he powers down into a hover.
And here Anthony is, settling into a defensive crouch as he awaits the carom off the wall. He’s low, he’s alert, he’s ready for anything. Wherever this ball decides to bounce, he’s about pounce.
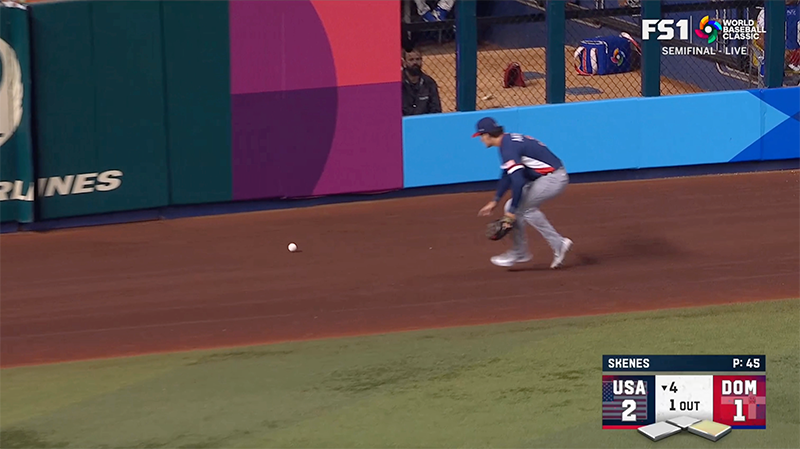
Um, so this is Anthony scuttling like a crab. He’s scuttling like a crab now. The ball didn’t so much bounce off the wall as it did die on the wall, and Anthony just kind of stayed in the crouch and started – sorry, scuttling is really the only word I can think of that applies here – toward it.
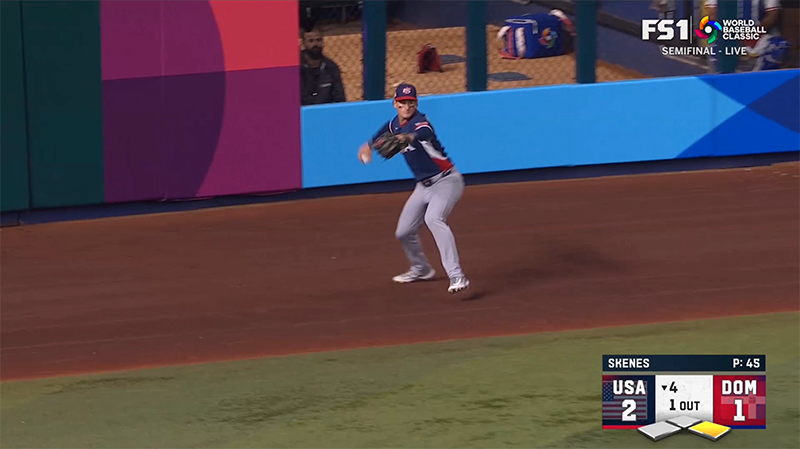
So this is the difference between a professional athlete and a toddler. When the right leg is still extended, planted in the ground for maximum leverage, the foot digging into the dirt at an angle, Anthony is a force to be reckoned with. Once the right leg is bent, he’s completely flat-footed, knees to his chest, left elbow stuck way out to the side so he can wrap his arm around his leg; he’s everyone’s nephew, powerless to stop himself from befriending a worm.
This is the frame that really takes it over the toddler top. For some reason, Anthony doesn’t grab the slow-moving ball with his fingers. He reaches out with his hand angled back. It looks like he doesn’t know what to do, so he’s just going to slap the baseball. He lets it get deep into his palm and grabs it with his whole hand. Professional baseball players do not grip the baseball that way. They have enormous hands and get a four-seam grip, holding the ball with their fingertips. There’s air between the ball and their palm. When Anthony finally picks up the ball, he holds it the way you might cradle a melon.
After that, sadly, Anthony returned to his usual status as a fearsome baseball warrior blessed with grace and agility.
Anthony has a long career ahead of him, and he will awe us with many astounding feats of power and dexterity. For now, though, let’s make sure we treasure this memory of him as an adorable toddler before he hits the terrible twos.
Brendan Gawlowski: Hello everybody, sorry for the delay.
2:26
Brendan Gawlowski: I’m out in AZ and running between a meetup with a scout and getting out to the backfields. My apologies, let’s get going.
2:26
Mariner Fan: Hey Brandon! Have you been to a game yet down there? Who impressed you at the most recent game you were AT?
2:27
Brendan Gawlowski: I like the capital ‘AT’ at the end. I saw Josuar yesterday, so I’ll say him. 0-3, a couple groundouts, looked like he tweaked his leg sliding but obvious speed and athleticism.
2:27
Punk in drublic: Who are some prospects outside the top 100 you think could make significant impact in the majors this year?
2:28
Brendan Gawlowski: Tons of relievers fall into this bucket.
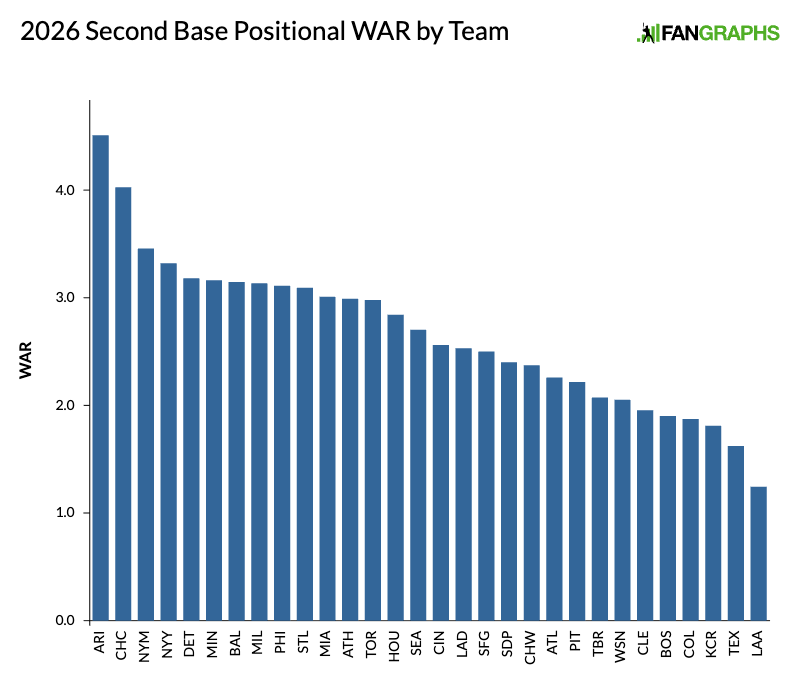
Second base can be a bit of an unglamorous position; what is a second baseman, after all, but a failed shortstop? Indeed, the keystone is light on true superstars but heavy on solid regulars. The difference between third place and 13th, in our projections, is just half a win. A few teams in the bottom half of the ranking are bringing in exciting young players, too, so a low ordinal ranking does not necessarily indicate that the team’s second base situation is a lost cause.
It might please you to learn that second base in 2026 is also a position for interesting players: guys with extreme tool sets, speedsters, glove-only wizards, high-contact/no power dudes. It’s like they put the Statue of Liberty at second to exhort the sport’s most unorthodox hitters to congregate at this position. There’s something for everyone here. Read on, you’ll see. Read the rest of this entry »
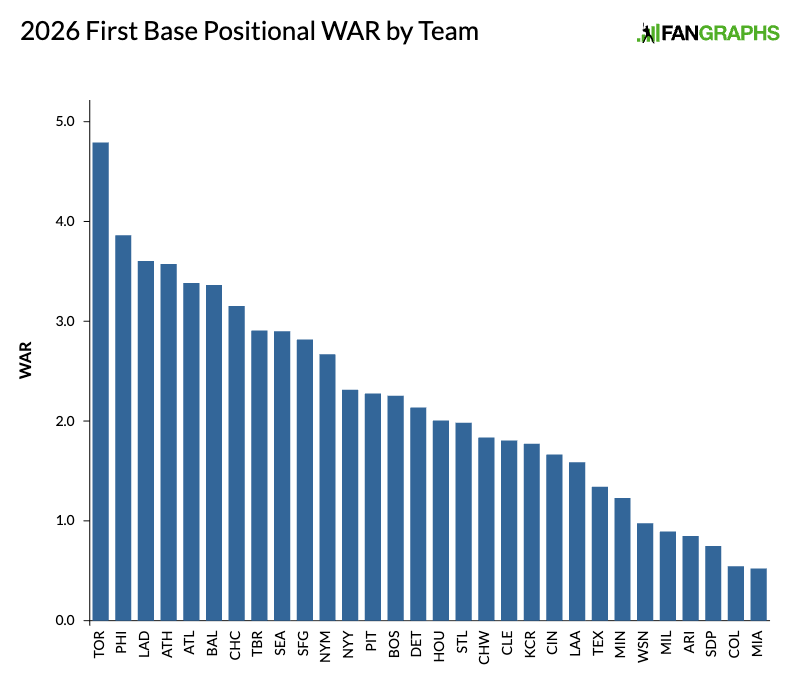
Vladimir Guerrero Jr., Bryce Harper, and Freddie Freeman walk into a bar — the same bar, in fact, as the one they walked into last year, and in the same order; the trio and their assorted backups topped these rankings in 2025, just as they do in ’26. But where they towered over the rest of the field last year, with a full win gap between the third-ranked Dodgers and the fourth-ranked Rays, this time it’s only Guerrero who’s separated from the pack. The 0.9-WAR gap between the Blue Jays and Phillies is just 0.1 WAR less than the gap between those Phillies and ninth-ranked Mariners.
It’s not hard to understand what’s happening. Guerrero is 27 years old, and if he didn’t have his best season by the numbers in 2025 — though a half-billion dollar extension and a near-miss of a championship is still a pretty great year — our projections suggest he’ll rebound. Harper, on the other hand, is 33 and Freeman 36, and while they remain championship-caliber players, both are increasingly prone to the aches and pains that can leave a mark on their performances, as explained below.
It’s not just that those older guys are past their peaks — likely future Hall of Famers, but trending down just the same — it’s that an influx of younger talent is pushing the middle of the pack upward. The 23-year-old Nick Kurtz, 27-year-olds Ben Rice and Jonathan Aranda, and 28-year-olds Michael Busch and Josh Naylor all rank among this year’s top dozen; none was the primary first baseman on a team ranked above no. 14 last year. Read the rest of this entry »