Welcome to PhamGraphs
“It’s not being quantified like it should.” That’s what Tommy Pham told Will Sammon and Eno Sarris of The Athletic. Pham isn’t your stereotypical ballplayer who hates advanced stats. He’s a visionary who wants them to be even more advanced, to factor in even more context, to do an even better job of turning every tiny thing that transpires on the field into cold, hard numbers that can be credited to or debited from a ballplayer’s account. On Monday, Sammon and Sarris published an article that described Pham’s dream of a brighter sabermetric future. “I want to create a system that is going to change all that,” he said. Tommy Pham, the old school grit-and-grinder with 12 years in the majors under his belt, wants us nerds to get even nerdier, and he’s here to help. He even has a name in mind: PhamGraphs. “It’s pretty self-explanatory,” he said.
First and foremost, we here at FanGraphs want to let Tommy Pham know that we are going to sue your ass back to the stone age for trademark infringement so incredibly flattered by this charming homage. Moreover, we are here to help. We are up for the challenge. We want in. Welcome to PhamGraphs.
![]()
I can relate to Pham’s plight personally, because once upon a time, I, too, created my own FanGraphs knockoff. Specifically, I experienced a burgeoning enthusiasm for apples in the summer of 2016, so I started a spreadsheet where I’d list all the apples I ate, rate them on a scale of one to five, and write a review. The spreadsheet was titled AppleGraphs, and I figured it that if I really liked tracking my apples, I’d eventually turn it into a blog. Instead, I kept it up for a couple months and then forgot about it. I never showed it to anybody. Here’s an excerpt.
A Taste of AppleGraphs
| Date | Cultivar | Source | Grown | Rating | Descriptors |
|---|---|---|---|---|---|
| 8/2/2016 | Fuji | Trader Joe’s | Chile | 4 | Gorgeous |
Notes: I took a digital art class in college. There was little in the way of instruction about improving as an artist. It seemed like the main goal was to learn how to discuss art as pretentiously as possible. When a classmate called my friend’s work cool, the professor cringed and explained that she should instead say the piece was “visually interesting.” I enjoy euphemisms as much as anybody, but that never struck me as a great bargain: surrendering immediacy and directness for the chance to sound more impressive. This is all by way of saying that the apple I ate today looked cool as hell. It was all stripy, with vertical ribbons of greens and reds like some kind of marble offering to the god of picturesque produce. It tasted pretty cool, too. It was light and refreshing, and the first slice was surprisingly sweet. For some reason I didn’t really taste that sweetness in the remainder, but big deal. The pleasure of the first bite was more than enough. Can you really ask more from an apple than one nice moment?
I wrote a total of 13 entries before it petered out (though if some venture capitalist is reading this and wants to throw a million dollars my way, I will gladly resurrect AppleGraphs as a blog or a newsletter or a zine or whatever unwieldy medium you and you blood money would prefer). You can read the whole thing here, but only if you really, really don’t have anything better to do, because, once again, it was just a spreadsheet where I described apples as a way of killing time at my desk until FanGraphs published a new article for me to read.
My extraordinarily roundabout point here is that, as someone with experience ripping off David Appelman (with apples, no less), I am determined to take Pham very seriously and answer his points as best I can, one by one. However, I want to note first that Pham’s comments revealed two overarching concerns. First, he wants the numbers to feature more context, to get into deserved performance rather than actual performance. Weighted Runs Created Plus, our flagship hitting metric, is park-adjusted and league-adjusted. The numbers are measured against the league average, which is always 100, and they’re adjusted based on the hitting environment of the park a hitter plays in. But they’re not designed to show deserved performance. They’re designed to show how well you performed relative to the league average. They don’t factor in strength of opponent or batted ball luck or a host of other factors. However, those numbers are available to Pham if he wants them. DRC+, or Deserved Runs Created Plus, is the flagship offensive metric of Baseball Prospectus. Deserved performance is what they do at BP. That may just be the site for Pham, and he may want to rethink his branding.
![]()
Actually, now that I mention it, I should probably note that Baseball Reference WAR also takes the strength of your opponent into account. The point is, Pham can keep his options open. The sabermetric community is a big tent. We’re all Pham.
![]()
That said, you have to stop somewhere. It’s impossible to factor everything in. There’s no shortage of examples. If you’re Randy Johnson and you detonate a mourning dove that divebombs into the path of your fastball, and the umpire calls the pitch a ball (which would have been the right call), should that ball really count against you? If you’re Rafael Ortega and a double falls in over your head because a territorial goose has colonized deep center field and forced you to play too shallow, should you really have your defensive metrics docked? If you’re Cody Bellinger and some room service chicken wings give you such horrendous food poisoning that you have to miss a game and bat .143 with a 24 wRC+ over the next two weeks, is that really all your fault? Shouldn’t some of the -0.2 WAR you put up over that timeframe be doled out to the chef at the hotel, to Perdue AgriBusiness, and to the chickens themselves? I could keep going all day. I’m not even done with the bird examples yet. You could keep going forever because everything’s connected. At some point, you just have to draw the line and look at what happened on the field.
Pham’s second overarching concern was, obviously, to burnish his numbers. He’s a 37-year-old free agent who is looking for a deal. He has played for nine different teams over the last five seasons and put up a combined 0.1 WAR across the last two, and he’s been on something of a media campaign recently (and not so recently). In November, Pham revealed that he’s been playing through plantar fasciitis since the second half of 2023, but, conveniently, he’s all better now. These new comments no doubt express his true beliefs, but they also seem designed to put a positive spin on his performance in order to get himself a good deal – or as Zach Crizer put it over at The Bandwagon, “Tommy Pham has some ideas about stats that would make Tommy Pham look better.”
Now let’s get to Pham’s issues. He made two particular points. The first was that playing for a losing team, especially one that loses a lot of close games like the Pirates, means that you tend to face better pitching, because all the opponents who end up beating you have to use their high-leverage arms in order to close out their victories. The close-game qualification is an important one, and it takes some of the sting out of Pham’s argument, because bad teams end up in just as many blowouts as good teams, and the leverage is low for both teams at that point. If the Phillies are blowing your doors off, they’re not going to waste Jhoan Duran in a non-save situation. Now, the back of a good team’s bullpen is sure to be better than the back of a bad team’s, but the difference isn’t going to be quite as big.
Still, Pham is right that he’s been facing tougher arms than usual. In addition to noting all the close games the Pirates played last year, he mentioned that he switched teams twice during the 2024 season, and that those moves came at inopportune times. A series of scheduling quirks caused him to catch three straight prolonged stretches where his current team was facing off against particularly stiff competition. As a result, he believed that he faced much better pitching than most batters. (He also mentioned that he discussed this with his agent, who confirmed his hunch, and I have to admit that I’m a sucker for this line of reasoning. Anyone who has ever had an argument with a significant other has heard some version of the line, “I asked my friends, and they all think I’m right and you’re wrong.” No matter how bad the fight, it’s always at least a little bit amusing.)
We checked this out, and when I say we, I mean David Appelman. David calculated the average ERA and FIP of the pitchers that every batter faced in both 2024 and 2025. In 2024, the pitchers Pham faced had a combined ERA of 4.02, the 19th-lowest among all batters with at least 400 plate appearances. That put him in the 90th percentile. In 2025, his opponents had a 4.17 ERA, which put him in the 75th percentile. He really has faced tough pitching over the last two years. It’s not unprecedented – somebody’s got to be in the 99th percentile every year (sorry Royce Lewis) – but it is real.
Toughest and Easiest Pitchers Faced in 2025
| Rank | Name | ERA | Rank | Name | ERA | |
|---|---|---|---|---|---|---|
| 1 | Royce Lewis | 3.84 | 206 | Cedric Mullins | 4.47 | |
| 2 | Chandler Simpson | 3.97 | 207 | Matt McLain | 4.49 | |
| 3 | Jonathan Aranda | 3.98 | 208 | Jeff McNeil | 4.50 | |
| 4 | Junior Caminero | 3.98 | 209 | Nathan Lukes | 4.50 | |
| 5 | Yandy Díaz | 4.01 | 210 | Pete Alonso | 4.50 | |
| 6 | Jake Mangum | 4.01 | 211 | Alec Bohm | 4.52 | |
| 7 | Gabriel Arias | 4.02 | 212 | Gavin Lux | 4.57 | |
| 8 | Iván Herrera | 4.03 | 213 | Brett Baty | 4.58 | |
| 9 | Ryan Jeffers | 4.05 | 214 | Austin Hays | 4.58 | |
| 10 | Josh Lowe | 4.05 | 215 | Carlos Narváez | 4.66 |
Source: PhamGraphs
Minimum 400 plate appearances.
Unfortunately, Pham’s argument falls a little bit flat at this point. If you try to give him credit by regressing his performance to account for this greater degree of difficulty, you learn that the effect is much smaller than you’d expect. In 2025, Pham faced pitchers whose combined ERA was 0.08 points lower than the league average, so let’s give him credit for those extra points. There are several ways to run the numbers, but Ben Clemens showed me a quick and dirty way to do it using constants from The Book. Skip the rest of this paragraph if you don’t like math. One point of wOBA works out to roughly half a run per 600 plate appearances, and 600 plate appearances works out to roughly 141 innings. Half a run over 141 innings works out to 0.032 points of ERA. Now we have a conversion rate: one point of wOBA equals 0.032 points of ERA.
That means if we give Pham 0.08 extra points of ERA to bring him up to the league average, it only adds 2.5 points to his wOBA. That’s it. He goes from .308 to .311. Among the 215 players with at least 400 plate appearances in 2025, that takes him from the 150th-highest wOBA to the 145th.
If we use FIP rather than ERA, which Pham would presumably prefer because it’s a better indication of a pitcher’s true talent level, we’d add only 1.3 points of wOBA. (We can go even further: If we use the pitchers’ projected ERA or FIP at the time of each plate appearance according to Steamer – effectively showing how good everybody thought the pitchers were at the time – then Pham actually faced an easier slate of pitchers than the average batter!) As I mentioned earlier, DRC+ takes the strength of opponent into account, and that’s likely why it graded Pham higher than wRC+ over the last two seasons, but that bonus was just three points in 2024 (a 92 wRC+ and 95 DRC+) and four points in 2025 (a 94 wRC+ and 98 DRC+). None of this turns him into even a league-average bat. So yes, Pham faced tough pitching, but no, it doesn’t make all that much difference.
That said, I don’t want to let all these numbers get in the way of a good story. While we’re talking about all the high-leverage arms Pham has faced, we need to note that he was great in high-leverage situations. In 2025, he ran a 168 wRC+ across 40 high-leverage plate appearances, batting .355. Over the past two seasons, his 136 wRC+ in high-leverage situations puts him in the 80th percentile of all hitters (minimum 80 high-leverage plate appearances). If I were Tommy Pham, I’d be making sure that high-leverage situations were part of the conversation, too.
Pham’s second point was about how wind can play havoc with outfield defense, and here I’ll rely on an excerpt:
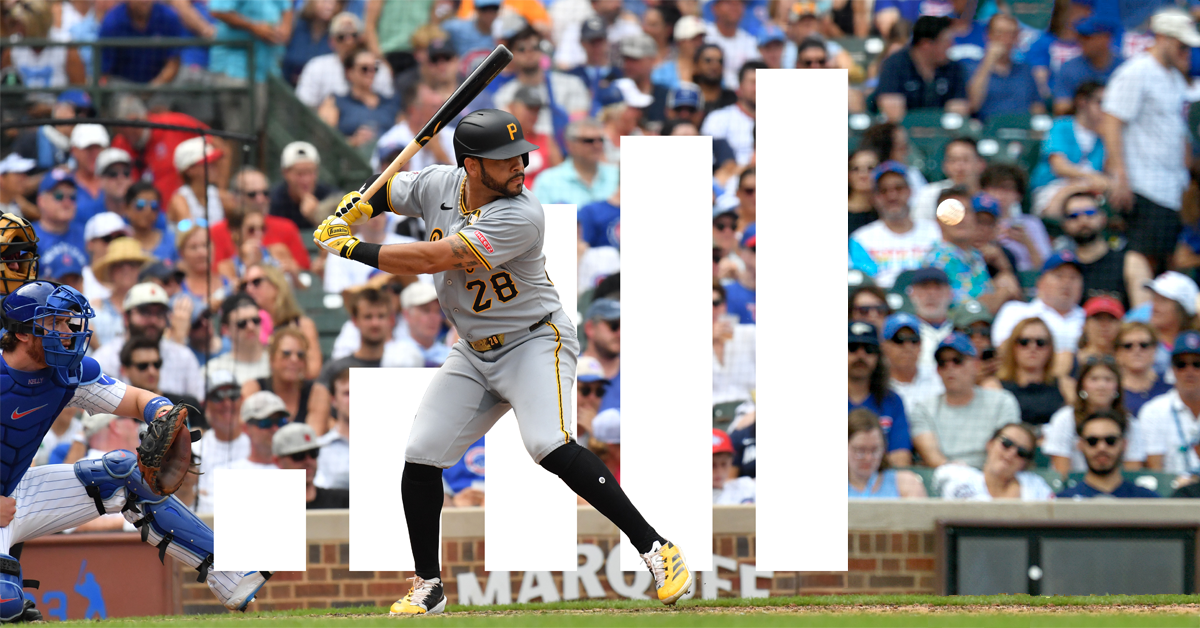
Pham remembers a particular play from last season that frustrated him as it related to how defensive metrics are used to value players. In a game against the Milwaukee Brewers, he was playing left field. A ball hit approximately 360 feet with a 90-mph exit velocity short-hopped the outfield wall. The wind carried it. Pham was playing in, so he couldn’t get to the ball. The play reflected poorly in his defensive numbers.
“I got docked on the ball because Statcast doesn’t factor the wind part,” Pham said. “When I learned that, I’m like, OK, if the wind’s blowing out, I need to play a little bit deeper.
“It’s a really flawed system. But it’s getting factored into our value.”
Before we get into the play in question, let’s start with the part where Pham says that he didn’t learn until age 37 that he should probably play a bit deeper when the wind is blowing out really hard. That seems – how do I put this respectfully? – unlikely to be true. Surely, this sabermetric visionary had, you know, thought about what the wind does before the year 2025. Pham makes a valid point about how defensive metrics have so far been unable to account for wind, but the example he uses to illustrate it is, by his own account, just a story about how he was positioned poorly.
Some of the details are off, but I was able to find the play in question. I understand why Pham has it stuck in his mind. It cost the Pirates a game. It was a line drive double from Caleb Durbin on May 25. It left the bat at 97.1 mph, traveled 371 feet, got over Pham’s head, and short-hopped the wall. The Pirates were leading 5-3 in the top of the eighth, and because the tying run was on second base, Pham was playing a bit shallower than usual. In 2025, the average left fielder at PNC Park played 301 feet deep, and Pham averaged 295. On this play, he was at 293 feet. He was making sure that he’d be able to hold the runner at third if Durbin singled. For that reason, I’m not so sure that he would’ve been playing deeper even if he had factored in the wind. The double scored two runs, tying the game at five, and Durbin scored the game’s deciding run when the next batter also doubled to Pham in left field.
Pham was right that the wind aided the ball a bit. Over the course of the 2025 season, 12 balls were pulled at the same launch angle and exit velocity off the same pitch type, and they traveled an average of 353 feet. This ball went an extra 17 feet. Still, his argument has several problems. The first is that Statcast only gave this ball a catch probability of 30% to begin with, thanks to the wall penalty. It graded out as a four-star play, which means that it was so difficult that it barely hurt Pham’s numbers. Second, at this stage of his career, Pham doesn’t make four-star catches anyway. His numbers going back on the ball have been bad for years now. He’s 37 and not that guy anymore (unless his plantar fasciitis really is gone forever). In fact, less than a week earlier, Elly De La Cruz hit a nearly identical ball to Pham in left field. Durbin’s ball required Pham to travel 79 feet over 4.7 seconds. De La Cruz hit his harder, but it required Pham to travel 78 feet over 4.7 seconds, and it landed in pretty much the exact same spot. On both balls, Pham had a chance to make the catch but decided to slow down — especially on De La Cruz’s — rather than risk injury by crashing into the wall.
Third, it’s also important to note that the Statcast numbers here, at least to some extent, factored in the wind already. Those catch probability numbers aren’t perfect, but this is exactly the kind of batted ball where they work well. Pham isn’t getting graded based on the launch angle and exit velocity; he’s getting graded on the hang time and the distance he had to travel. Statcast is accounting for those extra 17 feet in its grading system, and then it is knocking off some of the difficulty because the ball landed near the wall. It’s not taking off a couple extra percentage points because the wind made the ball move unexpectedly, and Pham is right that in a perfect world he would get credit for that. However, this is pretty tame in terms of wind effects. The ball didn’t change direction because of a sudden gust, and it didn’t move unpredictably due to swirling conditions. It just had a tailwind that allowed it to get on top of him. Maybe we’ll get there one day, but right now, it’s hard to imagine any system detailed enough that it could put a specific number of catch probability percentage points on just how much harder the tailwind made this play, let alone do so accurately enough to be worthwhile.
To return to the most important point, why wasn’t Pham taking the wind into account already? He got docked because he didn’t catch the ball, but he did not get docked (at least not by Statcast) for his positioning. In fact, because he started out so far from where the ball landed, Statcast gave him more leeway, reducing the catch probability, and thus the hit to his OAA. Other systems like DRP and DRS factor in positioning, and they may well have docked him for playing too shallow here. Or, maybe the opposite is true; maybe they would’ve recognized that he was playing shallow in order to hold the runner at third on a base hit, and would’ve considered his positioning to be correct even though it didn’t work out. If that were the case, perhaps they wouldn’t have held it against him either. There’s always more context to take into account, even when there are no birds in sight.
I should also note that Pham once again came close to touching on something that would have made him look great. Did you know that our splits tools allow you to check how a player performs based on the wind conditions? We can’t split out outfield defense, but it turns out that Pham is actually a great hitter when it’s windy. Over the course of his career, we have him credited with making 164 plate appearances when the wind is blowing at least 18 mph. In those plate appearances, he’s batted .354 with a 197 wRC+. Our database shows 513 players who have at least 60 plate appearances in those conditions. Pham’s 197 wRC+ ranks eighth, just a couple of spots behind Aaron Judge and Juan Soto. Yet again, Pham is doing the right thing by bringing wind into the conversation.
Before I leave you, I want to mention that, although I’ve made plenty of jokes and taken a critical eye to the issues he raised, I think Pham has the exact right attitude here. Like every player, he’s run into some bad luck at times. And, like every player, he’s also faced some good luck. Here’s a popup that turned into a double only because Pham had the good fortune to hit it to Teoscar Hernández:
Pham doesn’t sitting around thinking about all the times he got lucky, and for good reason. He plays the game at the highest level, where failure lurks around every corner. Nine years ago, right around the time I started the now-legendary AppleGraphs, I was playing in a pickup baseball league in Queens and saved this quote from Grégor Blanco. Coincidentally, it too appeared in an article by Eno Sarris:
“These things are going to happen. You go up and you go down. When you go down, you need to realize that it happens. Don’t let frustration get you. Try to simplify the game. Take some pitches, start seeing the ball again. Build that confidence again. You need to start seeing it inside yourself. ‘I got a walk! That’s good. I hit the ball hard.’ Sometimes in a streak, you hit the ball hard right at someone, and you think, ‘What do I have to do?’ Instead, say, ‘Yeah, that’s what I want. I hit the ball hard.’”
I saved it because, even in this silly adult league, I found it useful to trick myself into staying positive. When I hit a bloop single or reached on an error, I’d tell myself, ‘Great job, you got on base.’ When I lined out, I’d tell myself, ‘Great job, you hit the ball hard.’ In other words, I found a way to take something positive out of nearly every at-bat.
Pham has a tattoo that reads “Believe in Yourself” on his left arm, just below the spot where his sleeve ends. I’d be remiss if I didn’t point out that it was a huge missed opportunity for him not to spell it ‘Yourselph,’ but I’m sure the location was no accident. I’m sure the tattoo is right there so that Pham can look down to remind himself of that whenever he feels the slightest bit of doubt creep in. If he wants to create his own statistics in order to help him follow the instructions on his arm, then we here at FanGraphs and PhamGraphs are happy to do our part.
Dan Szymborski FanGraphs Chat – 1/8/26
January 8, 2026
| 12:02 |
|
| 12:02 |
: What are your personal expectations for Alonso in Baltimore?
|
| 12:04 |
|
| 12:04 |
: Hi Dan, I giggled about the ‘refrigerate’ pills tweet yesterday. I’ve done many similar things. Among Misiorowski, Mclean, Yesavage, Bubba and the rest of the young arms emerging now, is there one or two who shine beyond the rest for Zips?
|
| 12:05 |
|
| 12:05 |
: I don’t mean to be insensitive, as this is a genuine question, but what makes ZIPS projections worthy of an article per team in a way that Steamer or The Bat is not?
|
Michael Lorenzen and the Rockies Get What They Want From Each Other
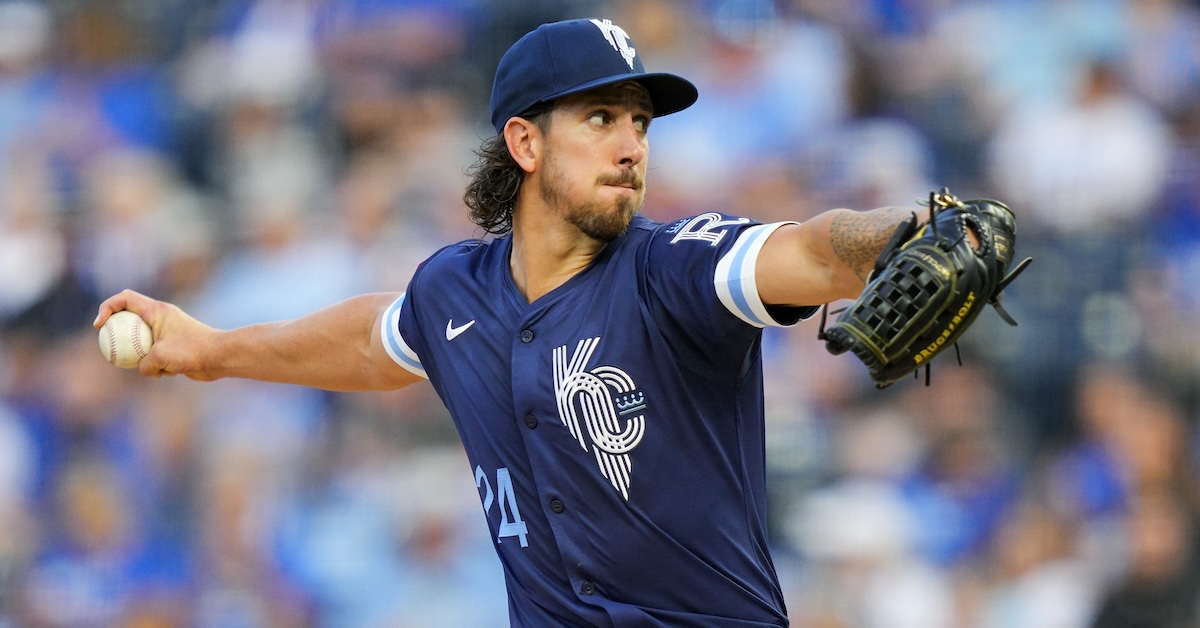
Every free agent signing is a trade. For that matter, every job everywhere is a transaction. The employer agrees to give you money and maybe even health insurance. You agree to give them your work. You’re trading something they want in exchange for something you want (or at least something you need in order to not die). But we don’t tend to think about things this way. Everybody has to work, so everybody just gets the best job they can. For ballplayers who have reached free agency, that generally means maximizing earnings. That’s what Michael Lorenzen did on Wednesday, when ESPN’s Jeff Passan reported that the muscular right-hander agreed to a one-year, $8 million deal with the Rockies (with a $9 million club option for 2027). Still, this deal is notable for the starkness of the wants on either side and the concessions they made to get them. Lorenzen wants to be a starting pitcher. That’s all he’s ever wanted. The Rockies want a starting pitcher who is willing to ply his trade under two adverse circumstances: in Colorado and for the Rockies.
In 2015, toward the end of a rookie season in which he put up a 5.45 ERA and 5.48 FIP, the Reds relegated Lorenzen to the bullpen. During six subsequent seasons in Cincinnati, Lorenzen wasn’t shy about the fact that he wanted to go back to starting and often appeared in line to get that chance, but underperformance and injuries – a UCL sprain, a teres major strain, a shoulder strain, even a bout of mono – pushed him into relief roles (and the occasional appearance as an outfielder). He started just five more games in his final six seasons with the Reds. Although he ended on a down note, he ran a 3.65 ERA and 3.92 FIP over those six seasons. He’d earned the chance to pitch where he wanted on his own terms, and he did just that. Lorenzen signed with the Angels, then the Tigers, then the Rangers, then the Royals, and now with the Rockies, all on one-year deals (usually incentive-laden ones), and all with the publicly-acknowledged understanding that he would be given the chance to start.
Making that part clear up front was important because no matter how well he pitched, it was all too easy for people to put together a table that showed his splits as a starter and a reliever. You’d rather have the second guy, right? The one whose strikeout rate is within shouting distance of the league average and who possesses some ability to keep the ball in the yard?
The Splits Michael Lorenzen Can’t Escape
| Role | K% | HR/9 | ERA | FIP | wOBA |
|---|---|---|---|---|---|
| Starter | 18.8 | 1.26 | 4.27 | 4.71 | .325 |
| Reliever | 21.1 | 0.86 | 3.75 | 3.93 | .295 |
But Lorenzen persisted. He’s 34 now, and he made the most of his seven-pitch starter’s arsenal. Over the past four years, he made 93 starts for six different teams. And he pitched fine! He ran a combined ERA- of 99 and FIP- of 110. He was an average pitcher, a desirable enough arm that playoff-bound teams traded for him at the deadline in two of the past three seasons. In 2023, he threw a no-hitter. In 2024, thanks to good fortune in the form of a low BABIP and high strand rate, he ran a 3.31 ERA. In 2025, he wasn’t so fortunate, running a 4.64 ERA that matched his 4.59 FIP. Over the past three years, he’s been right around the top 50 in terms of games started and innings pitched. Nevertheless, when things got real, when the season wound down, when Lorenzen found himself in the playoffs, he also found himself back in the bullpen. He won’t have to worry about that in Colorado.
Lorenzen has found the toughest pitching environment in baseball, but he’s also found a situation where league-average numbers would put him in rarefied air. In 2025, Colorado’s starting pitchers ran a 6.65 ERA. That’s the worst mark ever. And when I say ever, I mean ever. It’s the highest starting pitching ERA in AL/NL history. Fourth place belongs to the 1899 Spiders. (Although the 2025 bullpen didn’t set a record, Colorado does own the highest combined bullpen ERA of any franchise at 4.81.) RosterResource pegs Lorenzen as the Rockies’ no. 2 starter, behind lefty Kyle Freeland and ahead of Chase Dollander, Tanner Gordon, and Ryan Feltner. Freeland was the only one of the four incumbents with an ERA below 6.00 or a FIP below 5.00.
But this is a new era. Lorenzen will be the first major leaguer to sign with the Rockies in the Paul DePodesta era. He will also be the team’s first investment in starting pitching of any substance at all since 2015, when they signed Kyle Kendrick for $5.5 million. Somehow, Lorenzen is only the fifth starting pitcher to sign a deal with the Rockies in the past seven years. I went through Colorado’s RosterResource free agent tracker to check. The tracker goes back to 2020, and the four starters I found put up a combined -0.1 WAR with the Rockies. They won a combined 11 games. Chad Kuhl ran the best ERA. It was 5.72.
Rockies Starting Pitcher Free Agent Signings
| Year | Player | Salary | ERA | FIP | WAR |
|---|---|---|---|---|---|
| 2021 | Chi Chi González | $1.1M | 6.46 | 5.37 | 0.3 |
| 2022 | Chad Kuhl | $3M | 5.72 | 5.27 | 0.4 |
| 2023 | José Ureña | $3.5M | 9.82 | 10.95 | -0.8 |
| 2024 | Dakota Hudson | $1.5M | 6.17 | 5.53 | 0.0 |
It’s scary to think about how many homers Lorenzen could give up in the thin Denver air, but he’d have to crash spectacularly hard in order be anything less than a significant upgrade for this rotation. Everybody gets what they want here, and all it took to get it was a couple extra millions on one side and a willingness to pitch on a mountain on the other. The Rockies get to take their first step on the long road to reputability, and they get to sign their first decent starting pitcher in years. Lorenzen gets his money – almost certainly more money than he would have gotten anywhere else – and he gets what must have been his last chance to remain a starting pitcher. If he defies the odds and pitches well, maybe he can keep the streak going and sign a similar deal next year.
2026 ZiPS Projections: Los Angeles Angels
January 8, 2026
For the 22nd consecutive season, the ZiPS projection system is unleashing a full set of prognostications. For more information on the ZiPS projections, please consult this year’s introduction, as well as MLB’s glossary entry. The team order is selected by lot, and the next team up is the Los Angeles Angels.
Batters
Zach Neto is really good. That is all. Let’s just move on with our lives.
[…]
[…]
OK, before I get the “Dan.” message in our company Slack, I’ll regretfully talk more about the Angels. They weren’t the worst team in baseball in 2025, nor will they be in 2026, but I think they’ve become the least interesting team in baseball. At this point, they’re a bit like when you hear for the first time about some TV show on the Hallmark or Roku Channel starring someone you vaguely recall from 1998 and find out that not only the TV show exists, but that it’s been on for a decade and there are like 110 episodes. The White Sox and Rockies have won a lot fewer games than the Angels in recent years, but being terrible is, on some level, interesting. The Angels were a mediocre team with peak Mike Trout and peak Shohei Ohtani, so it’s perhaps not surprising that with Trout in steep decline, and Ohtani gone, they’re having trouble getting into contention.
ZiPS is as optimistic about Neto as Steamer is, and he’s likely the best player on the team now. Trout did finally have a full, healthy-adjacent season in 2025, but he did so mostly as a designated hitter, with the lowest wRC+ of his career (120). He turns 35 in August, and I am increasingly pessimistic about whether there are any vintage Trout seasons left in the tank
Elsewhere, ZiPS struggles to see upside. Catcher would be among the most plausible places to see some improved performance, but the Apostrophe Boyz, Logan O’Hoppe and Travis d’Arnaud, were both absolutely dreadful last year, and this projection already represents a pretty sizable bounce back. Nolan Schanuel makes good contact, but a first baseman that doesn’t hit for much power or maintain high batting averages is going to struggle to have much value.
The Angels have designated hitters playing both corners. One, Jorge Soler, looks very much like he’s approaching the end. The other, Jo Adell, erupted for 37 home runs, which was nice, but it was one of the lowest impact near-40-homer seasons in history because he didn’t do much else all that well. Vaughn Grissom and Christian Moore rank very highly in the projected WAR rankings for the Angels, but that is more a reflection of the quality of their teammates rather than an indication that they’re due for a breakout performance.
One player who does violate this theme is Nelson Rada. A lot will come down to just how well his defense plays in center field long term, and he has little power, but he did perform quite well in the high minors for a player still in his teens. ZiPS actually thinks he may very well be the team’s best option in center right now.
The Angels will be a below-average offense, but probably not the worst in the league.
Pitchers
The rotation is, at least according to ZiPS, a step up from the lineup, with the important caveat if healthy. Yusei Kikuchi, José Soriano, and Reid Detmers — who is the returning to the rotation in 2026 — are all acceptable starters, even if none remotely screams “ace.” Grayson Rodriguez was just the kind of pickup the Angels should be making, and still has all sorts of upside remaining. Some combination of Alek Manoah, Caden Dana, and Sam Aldegheri is likely fine for the last spot in the rotation. The problem is what happens if (read: when) injuries hit. George Klassen throws really hard, and his control might just be just good enough to allow him to have a career, but once you get past Klassen, you quickly get to a recent retiree (Kyle Hendricks), a guy with an ERA near seven in more than 100 innings (Jack Kochanowicz), and a pitcher I forgot still played baseball (Dakota Hudson). The starting five could be adequate, but there’s a massive amount of downside behind them.
The bullpen looks very ordinary, but there are some sources of upside: Robert Stephenson and Ben Joyce can both be quite effective, but they come with serious injury concerns. Drew Pomeranz was highly effective for the Cubs last season, but he also has a significant injury history that cannot be ignored. Kirby Yates is nearing 40 and wasn’t particularly good last year, but ZiPS legitimately likes Brock Burke. This all averages out to, well, an average bullpen, but with some good dice rolls, there’s a pretty decent ceiling here, more than anywhere else on the team. Alas, the bullpen rocking will be most relevant in the last week of July.
Right now, the Angels look like a 70- to 75-win team with a rather unimpressive ceiling. I’ve done enough projections to be well aware of the pitfalls of projecting the future, so the team spiking an 86-win season and sneaking a wild card spot isn’t out of the realm of possibility. It does seem out of the realm of likely, though I don’t think that’s an actual expression.
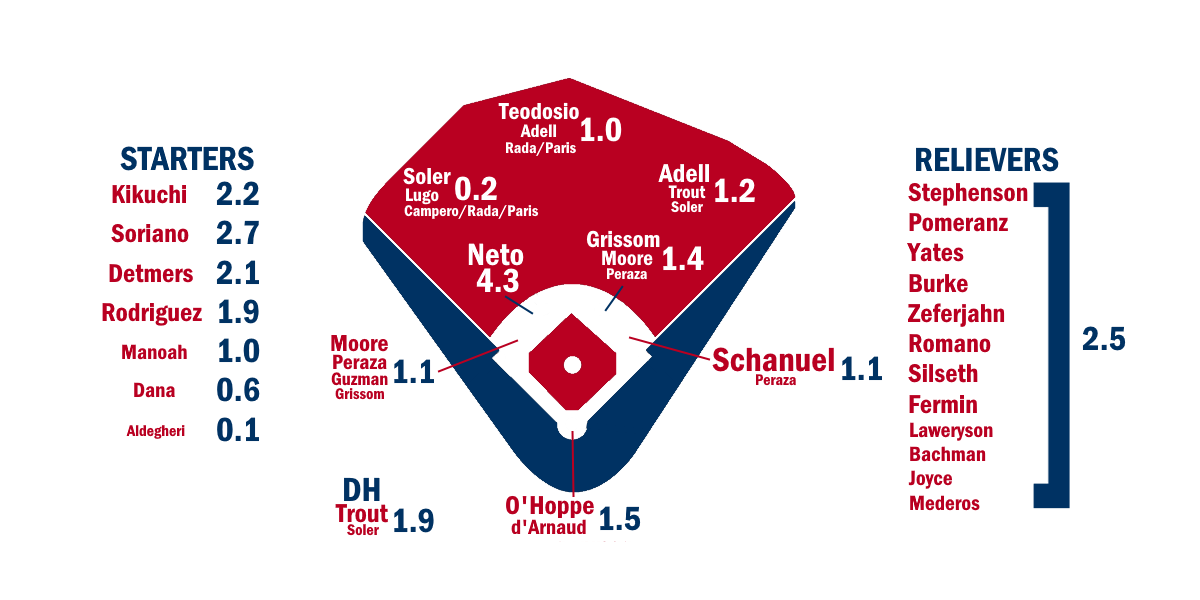
Ballpark graphic courtesy Eephus League. Depth charts constructed by way of those listed here. Size of player names is very roughly proportional to Depth Chart playing time. The final team projections may differ considerably from our Depth Chart playing time.
Batters – Standard
| Player | B | Age | PO | PA | AB | R | H | 2B | 3B | HR | RBI | BB | SO | SB | CS |
|---|---|---|---|---|---|---|---|---|---|---|---|---|---|---|---|
| Zach Neto | R | 25 | SS | 592 | 528 | 85 | 136 | 31 | 1 | 25 | 82 | 41 | 142 | 23 | 8 |
| Mike Trout | R | 34 | DH | 464 | 388 | 62 | 91 | 15 | 1 | 21 | 60 | 67 | 142 | 2 | 0 |
| Vaughn Grissom | R | 25 | 2B | 468 | 423 | 61 | 106 | 20 | 1 | 10 | 48 | 34 | 87 | 8 | 2 |
| Nelson Rada | L | 20 | CF | 596 | 519 | 66 | 128 | 17 | 2 | 3 | 52 | 53 | 139 | 30 | 12 |
| Yoán Moncada | B | 31 | 3B | 339 | 301 | 40 | 72 | 16 | 1 | 12 | 42 | 33 | 91 | 1 | 0 |
| Christian Moore | R | 23 | 2B | 476 | 426 | 54 | 97 | 15 | 5 | 11 | 52 | 43 | 150 | 8 | 3 |
| Logan O’Hoppe | R | 26 | C | 443 | 405 | 45 | 95 | 12 | 1 | 19 | 53 | 31 | 123 | 2 | 2 |
| Nolan Schanuel | L | 24 | 1B | 572 | 495 | 67 | 129 | 23 | 1 | 12 | 58 | 61 | 79 | 5 | 1 |
| Donovan Walton | L | 32 | 2B | 427 | 383 | 49 | 91 | 16 | 1 | 7 | 42 | 32 | 67 | 3 | 3 |
| Jo Adell | R | 27 | CF | 518 | 472 | 60 | 110 | 21 | 1 | 27 | 84 | 35 | 139 | 7 | 4 |
| Kyren Paris | R | 24 | CF | 402 | 355 | 52 | 73 | 14 | 3 | 11 | 45 | 37 | 138 | 19 | 4 |
| Travis d’Arnaud | R | 37 | C | 259 | 237 | 25 | 51 | 13 | 1 | 8 | 29 | 16 | 73 | 0 | 0 |
| Bryce Teodosio | R | 27 | CF | 379 | 346 | 40 | 76 | 13 | 4 | 4 | 35 | 20 | 122 | 18 | 4 |
| Gustavo Campero | B | 28 | RF | 345 | 305 | 44 | 76 | 16 | 3 | 8 | 45 | 24 | 62 | 15 | 3 |
| Oswald Peraza | R | 26 | 3B | 400 | 366 | 45 | 78 | 12 | 0 | 10 | 37 | 27 | 103 | 14 | 3 |
| Denzer Guzman | R | 22 | SS | 569 | 514 | 56 | 113 | 24 | 2 | 13 | 62 | 44 | 171 | 8 | 3 |
| J.D. Davis | R | 33 | 3B | 336 | 302 | 35 | 68 | 13 | 1 | 10 | 35 | 28 | 109 | 3 | 1 |
| Jorge Soler | R | 34 | RF | 422 | 370 | 50 | 83 | 18 | 0 | 18 | 52 | 44 | 117 | 0 | 0 |
| Luis Rengifo | B | 29 | 2B | 481 | 444 | 49 | 111 | 17 | 3 | 9 | 48 | 30 | 85 | 10 | 5 |
| Niko Kavadas | L | 27 | 1B | 510 | 438 | 53 | 88 | 18 | 1 | 18 | 63 | 58 | 191 | 1 | 1 |
| Ben Gobbel | R | 26 | 3B | 455 | 422 | 50 | 98 | 20 | 1 | 12 | 56 | 21 | 117 | 6 | 3 |
| Josh Crouch | R | 27 | C | 291 | 268 | 27 | 56 | 12 | 0 | 7 | 33 | 17 | 92 | 0 | 1 |
| LaMonte Wade Jr. | L | 32 | 1B | 356 | 298 | 40 | 66 | 11 | 1 | 9 | 32 | 48 | 82 | 1 | 0 |
| Anthony Rendon | R | 36 | 3B | 195 | 168 | 19 | 39 | 8 | 0 | 2 | 15 | 20 | 30 | 3 | 0 |
| Cavan Biggio | L | 31 | 2B | 349 | 298 | 44 | 63 | 13 | 1 | 6 | 31 | 38 | 98 | 3 | 2 |
| Adrian Placencia | B | 23 | 2B | 519 | 456 | 55 | 88 | 14 | 3 | 13 | 53 | 49 | 186 | 5 | 5 |
| Carter Kieboom | R | 28 | DH | 380 | 348 | 40 | 87 | 13 | 1 | 7 | 40 | 27 | 88 | 5 | 1 |
| Chad Wallach | R | 34 | C | 267 | 242 | 24 | 49 | 9 | 1 | 7 | 29 | 19 | 84 | 0 | 1 |
| Yolmer Sánchez | B | 34 | 2B | 428 | 372 | 40 | 74 | 13 | 2 | 4 | 31 | 45 | 119 | 5 | 2 |
| Zach Humphreys | R | 28 | C | 265 | 235 | 26 | 48 | 11 | 0 | 3 | 22 | 23 | 66 | 6 | 1 |
| Myles Emmerson | R | 28 | C | 278 | 254 | 24 | 51 | 11 | 1 | 3 | 22 | 19 | 83 | 1 | 1 |
| Tim Anderson | R | 33 | 2B | 343 | 324 | 33 | 79 | 10 | 1 | 2 | 22 | 14 | 85 | 7 | 2 |
| Travis Blankenhorn | L | 29 | LF | 389 | 353 | 38 | 71 | 16 | 1 | 13 | 48 | 28 | 115 | 1 | 1 |
| Chris Taylor | R | 35 | LF | 302 | 267 | 34 | 57 | 13 | 1 | 6 | 27 | 26 | 101 | 6 | 2 |
| Peter Burns | L | 26 | C | 118 | 104 | 10 | 19 | 2 | 0 | 1 | 12 | 11 | 26 | 1 | 1 |
| Rio Foster | R | 23 | LF | 375 | 332 | 39 | 71 | 17 | 2 | 7 | 43 | 33 | 118 | 5 | 2 |
| Caleb Pendleton | R | 24 | 1B | 94 | 91 | 7 | 16 | 2 | 0 | 2 | 8 | 3 | 42 | 1 | 0 |
| Juan Flores | R | 20 | C | 385 | 353 | 37 | 69 | 13 | 0 | 7 | 40 | 14 | 118 | 1 | 1 |
| Omar Martinez | L | 24 | C | 432 | 386 | 44 | 75 | 11 | 1 | 12 | 45 | 41 | 143 | 1 | 1 |
| Brandon Drury | R | 33 | DH | 368 | 333 | 38 | 73 | 17 | 1 | 9 | 40 | 27 | 87 | 1 | 1 |
| Tucker Flint | L | 25 | RF | 494 | 435 | 55 | 88 | 19 | 2 | 12 | 54 | 47 | 186 | 10 | 3 |
| Joe Redfield | L | 24 | LF | 210 | 186 | 17 | 38 | 8 | 2 | 1 | 17 | 11 | 60 | 4 | 3 |
| Matthew Lugo | R | 25 | CF | 480 | 450 | 54 | 101 | 23 | 4 | 12 | 55 | 23 | 149 | 8 | 5 |
| Oscar Colás | L | 27 | RF | 458 | 423 | 45 | 93 | 16 | 2 | 12 | 50 | 29 | 127 | 4 | 3 |
| Matt Coutney | L | 26 | 1B | 469 | 424 | 43 | 92 | 19 | 2 | 11 | 52 | 33 | 152 | 2 | 1 |
| Capri Ortiz | B | 21 | SS | 440 | 401 | 47 | 85 | 12 | 3 | 4 | 39 | 25 | 119 | 16 | 6 |
| David Calabrese | L | 23 | LF | 441 | 399 | 41 | 76 | 13 | 1 | 9 | 42 | 32 | 125 | 8 | 5 |
| Ryan Nicholson | L | 25 | 1B | 508 | 452 | 49 | 95 | 19 | 1 | 13 | 55 | 44 | 148 | 1 | 1 |
| Evan Edwards | L | 29 | DH | 282 | 251 | 19 | 48 | 6 | 2 | 6 | 27 | 23 | 105 | 4 | 0 |
| Kevin Maitan | R | 26 | 1B | 260 | 241 | 22 | 50 | 10 | 1 | 3 | 25 | 14 | 103 | 0 | 1 |
| Sebastián Rivero | R | 27 | C | 283 | 262 | 22 | 52 | 12 | 1 | 4 | 27 | 12 | 65 | 1 | 1 |
| Sonny DiChiara | R | 26 | DH | 308 | 272 | 23 | 51 | 10 | 0 | 7 | 32 | 28 | 116 | 0 | 0 |
| Mitchell Daly | R | 25 | 3B | 305 | 275 | 25 | 47 | 7 | 1 | 3 | 19 | 21 | 113 | 2 | 1 |
| Arol Vera | B | 23 | 2B | 425 | 390 | 36 | 78 | 14 | 1 | 5 | 35 | 22 | 120 | 3 | 2 |
| Cole Fontenelle | B | 24 | 3B | 395 | 356 | 37 | 64 | 9 | 3 | 7 | 39 | 25 | 174 | 9 | 6 |
| David Mershon | B | 23 | SS | 351 | 308 | 29 | 55 | 12 | 2 | 1 | 22 | 37 | 103 | 13 | 3 |
| Anthony Scull | L | 22 | CF | 515 | 475 | 54 | 103 | 17 | 1 | 10 | 57 | 22 | 136 | 6 | 6 |
| Korey Holland | R | 26 | LF | 335 | 314 | 27 | 64 | 15 | 2 | 6 | 30 | 17 | 135 | 7 | 2 |
| Alexander Ramirez | R | 23 | LF | 308 | 288 | 36 | 53 | 9 | 1 | 8 | 33 | 15 | 157 | 6 | 4 |
| Caleb Ketchup | R | 24 | LF | 412 | 373 | 52 | 68 | 10 | 3 | 6 | 33 | 33 | 148 | 18 | 4 |
| Alberto Rios | R | 24 | C | 214 | 191 | 16 | 30 | 4 | 1 | 2 | 15 | 13 | 65 | 2 | 1 |
| Mac McCroskey | R | 26 | 2B | 293 | 263 | 24 | 45 | 6 | 2 | 1 | 17 | 19 | 101 | 5 | 4 |
| Dario Laverde | L | 21 | DH | 411 | 383 | 31 | 77 | 12 | 2 | 4 | 35 | 20 | 112 | 1 | 0 |
| Randy De Jesus | R | 21 | RF | 492 | 453 | 42 | 85 | 15 | 1 | 14 | 55 | 29 | 191 | 2 | 3 |
Batters – Advanced
| Player | PA | BA | OBP | SLG | OPS+ | ISO | BABIP | Def | WAR | wOBA | 3YOPS+ | RC |
|---|---|---|---|---|---|---|---|---|---|---|---|---|
| Zach Neto | 592 | .258 | .331 | .462 | 118 | .204 | .307 | -1 | 3.8 | .341 | 119 | 89 |
| Mike Trout | 464 | .235 | .353 | .441 | 120 | .206 | .311 | 0 | 1.8 | .343 | 111 | 61 |
| Vaughn Grissom | 468 | .251 | .316 | .374 | 91 | .123 | .294 | -2 | 1.2 | .304 | 92 | 52 |
| Nelson Rada | 596 | .247 | .326 | .304 | 78 | .057 | .332 | 3 | 1.1 | .287 | 80 | 62 |
| Yoán Moncada | 339 | .239 | .322 | .419 | 104 | .180 | .303 | -3 | 1.1 | .322 | 99 | 41 |
| Christian Moore | 476 | .228 | .301 | .364 | 84 | .136 | .325 | 2 | 1.0 | .292 | 89 | 50 |
| Logan O’Hoppe | 443 | .235 | .296 | .410 | 94 | .175 | .289 | -7 | 1.0 | .307 | 96 | 50 |
| Nolan Schanuel | 572 | .261 | .350 | .384 | 105 | .123 | .290 | -3 | 1.0 | .325 | 105 | 68 |
| Donovan Walton | 427 | .238 | .304 | .339 | 79 | .102 | .272 | 4 | 0.8 | .285 | 76 | 41 |
| Jo Adell | 518 | .233 | .297 | .453 | 105 | .220 | .271 | -13 | 0.7 | .322 | 105 | 67 |
| Kyren Paris | 402 | .206 | .290 | .355 | 79 | .149 | .301 | 0 | 0.7 | .286 | 84 | 42 |
| Travis d’Arnaud | 259 | .215 | .278 | .380 | 81 | .165 | .276 | 1 | 0.7 | .287 | 74 | 25 |
| Bryce Teodosio | 379 | .220 | .274 | .315 | 64 | .095 | .327 | 8 | 0.6 | .261 | 68 | 35 |
| Gustavo Campero | 345 | .249 | .327 | .400 | 101 | .151 | .289 | -3 | 0.6 | .319 | 100 | 44 |
| Oswald Peraza | 400 | .213 | .278 | .328 | 68 | .115 | .269 | 6 | 0.6 | .269 | 71 | 37 |
| Denzer Guzman | 569 | .220 | .288 | .350 | 77 | .130 | .303 | -4 | 0.5 | .282 | 83 | 55 |
| J.D. Davis | 336 | .225 | .298 | .374 | 86 | .149 | .317 | -1 | 0.5 | .295 | 82 | 35 |
| Jorge Soler | 422 | .224 | .313 | .419 | 101 | .195 | .277 | -6 | 0.3 | .318 | 93 | 49 |
| Luis Rengifo | 481 | .250 | .302 | .363 | 84 | .113 | .291 | -5 | 0.3 | .292 | 84 | 53 |
| Niko Kavadas | 510 | .201 | .308 | .370 | 88 | .169 | .306 | 2 | 0.3 | .301 | 89 | 51 |
| Ben Gobbel | 455 | .232 | .283 | .370 | 80 | .138 | .294 | -2 | 0.2 | .286 | 82 | 47 |
| Josh Crouch | 291 | .209 | .268 | .332 | 66 | .123 | .290 | 1 | 0.2 | .266 | 66 | 24 |
| LaMonte Wade Jr. | 356 | .221 | .336 | .356 | 93 | .135 | .275 | -2 | 0.2 | .309 | 89 | 36 |
| Anthony Rendon | 195 | .232 | .323 | .315 | 79 | .083 | .272 | -2 | 0.1 | .289 | 78 | 18 |
| Cavan Biggio | 349 | .211 | .317 | .322 | 79 | .111 | .294 | -4 | 0.1 | .290 | 75 | 32 |
| Adrian Placencia | 519 | .193 | .278 | .322 | 67 | .129 | .292 | 3 | 0.0 | .268 | 72 | 44 |
| Carter Kieboom | 380 | .250 | .308 | .353 | 84 | .103 | .316 | 0 | -0.1 | .291 | 83 | 39 |
| Chad Wallach | 267 | .202 | .267 | .335 | 66 | .133 | .278 | -2 | -0.1 | .266 | 63 | 22 |
| Yolmer Sánchez | 428 | .199 | .292 | .277 | 60 | .078 | .281 | 3 | -0.1 | .260 | 54 | 32 |
| Zach Humphreys | 265 | .204 | .279 | .289 | 59 | .085 | .271 | -1 | -0.1 | .257 | 59 | 21 |
| Myles Emmerson | 278 | .201 | .261 | .287 | 53 | .086 | .286 | 2 | -0.2 | .246 | 54 | 20 |
| Tim Anderson | 343 | .244 | .281 | .299 | 62 | .055 | .325 | 2 | -0.2 | .258 | 59 | 29 |
| Travis Blankenhorn | 389 | .201 | .271 | .363 | 74 | .162 | .258 | 3 | -0.2 | .277 | 75 | 35 |
| Chris Taylor | 302 | .213 | .296 | .337 | 76 | .124 | .319 | 0 | -0.3 | .281 | 73 | 29 |
| Peter Burns | 118 | .183 | .280 | .231 | 45 | .048 | .234 | -1 | -0.3 | .241 | 47 | 7 |
| Rio Foster | 375 | .214 | .301 | .340 | 79 | .127 | .309 | -2 | -0.4 | .287 | 83 | 36 |
| Caleb Pendleton | 94 | .176 | .202 | .264 | 28 | .088 | .298 | 3 | -0.4 | .205 | 31 | 5 |
| Juan Flores | 385 | .195 | .245 | .292 | 49 | .097 | .272 | 3 | -0.4 | .239 | 57 | 26 |
| Omar Martinez | 432 | .194 | .275 | .321 | 67 | .127 | .273 | -8 | -0.4 | .266 | 72 | 35 |
| Brandon Drury | 368 | .219 | .285 | .357 | 78 | .138 | .270 | 0 | -0.5 | .283 | 75 | 35 |
| Tucker Flint | 494 | .202 | .291 | .338 | 75 | .136 | .321 | -1 | -0.5 | .281 | 79 | 46 |
| Joe Redfield | 210 | .204 | .266 | .285 | 54 | .081 | .296 | 2 | -0.6 | .248 | 54 | 16 |
| Matthew Lugo | 480 | .224 | .269 | .373 | 77 | .149 | .308 | -8 | -0.6 | .279 | 81 | 49 |
| Oscar Colás | 458 | .220 | .273 | .352 | 72 | .132 | .285 | 2 | -0.6 | .273 | 73 | 43 |
| Matt Coutney | 469 | .217 | .283 | .349 | 75 | .132 | .310 | 1 | -0.7 | .278 | 77 | 43 |
| Capri Ortiz | 440 | .212 | .268 | .287 | 55 | .075 | .291 | -3 | -0.8 | .248 | 62 | 37 |
| David Calabrese | 441 | .190 | .256 | .296 | 53 | .106 | .253 | 9 | -0.8 | .247 | 61 | 34 |
| Ryan Nicholson | 508 | .210 | .287 | .343 | 75 | .133 | .282 | 0 | -0.8 | .279 | 78 | 45 |
| Evan Edwards | 282 | .191 | .270 | .303 | 59 | .112 | .300 | 0 | -0.9 | .257 | 57 | 21 |
| Kevin Maitan | 260 | .207 | .258 | .295 | 54 | .088 | .348 | 3 | -0.9 | .245 | 57 | 19 |
| Sebastián Rivero | 283 | .198 | .240 | .298 | 49 | .100 | .249 | -3 | -0.9 | .237 | 53 | 19 |
| Sonny DiChiara | 308 | .188 | .276 | .301 | 61 | .113 | .295 | 0 | -0.9 | .261 | 62 | 23 |
| Mitchell Daly | 305 | .171 | .237 | .236 | 33 | .065 | .277 | 4 | -1.0 | .216 | 36 | 16 |
| Arol Vera | 425 | .200 | .248 | .279 | 47 | .079 | .275 | 3 | -1.0 | .234 | 52 | 28 |
| Cole Fontenelle | 395 | .180 | .253 | .281 | 49 | .101 | .326 | 1 | -1.1 | .240 | 55 | 30 |
| David Mershon | 351 | .179 | .268 | .240 | 44 | .061 | .265 | -5 | -1.2 | .236 | 49 | 24 |
| Anthony Scull | 515 | .217 | .267 | .320 | 63 | .103 | .283 | -5 | -1.2 | .260 | 69 | 44 |
| Korey Holland | 335 | .204 | .246 | .322 | 56 | .118 | .335 | -1 | -1.3 | .248 | 57 | 27 |
| Alexander Ramirez | 308 | .184 | .231 | .306 | 48 | .122 | .366 | 2 | -1.3 | .236 | 60 | 23 |
| Caleb Ketchup | 412 | .182 | .253 | .273 | 47 | .091 | .283 | 3 | -1.4 | .238 | 52 | 31 |
| Alberto Rios | 214 | .157 | .221 | .220 | 24 | .063 | .226 | -5 | -1.5 | .202 | 29 | 10 |
| Mac McCroskey | 293 | .171 | .232 | .221 | 27 | .050 | .273 | -3 | -1.9 | .207 | 29 | 16 |
| Dario Laverde | 411 | .201 | .251 | .274 | 47 | .073 | .273 | 0 | -2.1 | .235 | 54 | 27 |
| Randy De Jesus | 492 | .188 | .246 | .318 | 56 | .130 | .286 | -3 | -2.2 | .249 | 66 | 37 |
Batters – Top Near-Age Offensive Comps
| Player | Hit Comp 1 | Hit Comp 2 | Hit Comp 3 |
|---|---|---|---|
| Zach Neto | Travis Jackson | Trevor Story | Ken Boyer |
| Mike Trout | George Selkirk | Bob Allison | Jason Bay |
| Vaughn Grissom | Maurice Lerner | Don Mason | Scott Fletcher |
| Nelson Rada | Mallex Smith | Thad Bosley | Tommie Martz |
| Yoán Moncada | Jim Fregosi | Wilson Betemit | Bobby Prescott |
| Christian Moore | Neil McPhee | Billy Consolo | Jorge Orta |
| Logan O’Hoppe | Bill Nahorodny | Johnny Blanchard | Dan Graham |
| Nolan Schanuel | Craig Cacek | Adam Casillas | Gail Hopkins |
| Donovan Walton | Ted Sizemore | Loren Babe | Casey Candaele |
| Jo Adell | Ron Gant | Bill Schlesinger | Matt Carson |
| Kyren Paris | Estevan Florial | Al Smith | Tanner English |
| Travis d’Arnaud | Mike Macfarlane | Brian Dorsett | Todd Greene |
| Bryce Teodosio | Casio Grider | Manny Jose | Ramon Gomez |
| Gustavo Campero | Jordany Valdespin | Óscar Mercado | Albert Hall |
| Oswald Peraza | Pokey Reese | Pat Creech | Bill Barrett |
| Denzer Guzman | Kelly Johnson | Dick Schofield | Jack Damaska |
| J.D. Davis | Ray Jablonski | Cory Snyder | Dale Sveum |
| Jorge Soler | Luke Scott | Jim Hickman | Adam LaRoche |
| Luis Rengifo | Marty Malloy | Jimmy Brown | Carlos Garcia |
| Niko Kavadas | Ryan Noda | Karl Pagel | Rob Nelson |
| Ben Gobbel | Fausto Cruz | Dick Windle | David Thompson |
| Josh Crouch | Jacob Stallings | Cael Brockmeyer | Dave Plumb |
| LaMonte Wade Jr. | Ed Bouchee | Ron Roenicke | Norm Siebern |
| Anthony Rendon | Ramon Santiago | Ken Oberkfell | Don Kelly |
| Cavan Biggio | Woody English | Danny Muno | Eddy Alvarez |
| Adrian Placencia | Karexon Sanchez | Rich Puig | Drew Robinson |
| Carter Kieboom | Marv Galliher | Bob Seeds | Ron Gardenhire |
| Chad Wallach | Frank Snyder | Kelly Stinnett | Steve Patchin |
| Yolmer Sánchez | Snuffy Stirnweiss | Whitey Wietelmann | Steve Hine |
| Zach Humphreys | Joe Pignatano | Charlie White | Jeff Farnham |
| Myles Emmerson | Greg Almond | Dan Conway | Patrick Arlis |
| Tim Anderson | Ed Rogers | Luis Ordaz | Bobby Wilson |
| Travis Blankenhorn | Jeff Kipila | Chris Cassels | Jim Bennett |
| Chris Taylor | James Mouton | Reggie Williams | Fred Lewis |
| Peter Burns | Joe Oliveira | Jesse Baez | Scott Stricklin |
| Rio Foster | Alex Call | KD Kang | Jeff Hermann |
| Caleb Pendleton | Kim Flowers | Ronarsy Ledesma | Del Bender |
| Juan Flores | Phil Roof | Alex Sirota | Kurt Brown |
| Omar Martinez | Marc Sullivan | Don Werner | Leonard Merullo |
| Brandon Drury | Pat Putnam | Pidge Browne | Jackie Brandt |
| Tucker Flint | Marv Blaylock | Skip Kiil | Marcus Wilson |
| Joe Redfield | Carlos Duran | Victor Fernandez | Malique Ziegler |
| Matthew Lugo | Scott Cousins | Alejandro Sanchez | Todd Dunwoody |
| Oscar Colás | Doug DeVore | Steve Hazlett | Paul Hertzler |
| Matt Coutney | Kevin Burns | Leo Smith | Scott Cepicky |
| Capri Ortiz | Masyn Winn | Anderson Hernandez | Marten Gasparini |
| David Calabrese | Paul Nelson | Jose Camilo | Craig Curtis |
| Ryan Nicholson | Kevin Barker | Justin Bloxom | Barry Miller |
| Evan Edwards | T.J. Staton | Gib Seibert | Tommy Bost |
| Kevin Maitan | Jeremy Todd | Devin Thomas | Lydell Moseby |
| Sebastián Rivero | Joe Cipolloni | John Purdom | Darren Loy |
| Sonny DiChiara | Phil Strom | Jim Bishop | Sean Bischofberger |
| Mitchell Daly | Bobby Filotei | Nick Frank | Pete Piskol |
| Arol Vera | Lance Downing | Crucito Lara | Luis Suarez |
| Cole Fontenelle | Ike Brown | U L Washington | Sean Berry |
| David Mershon | Jeff Venghaus | Troy Haugen | Garrett Hampson |
| Anthony Scull | Steve Harvey | Kenneth Berger | Miguel Negron |
| Korey Holland | Sandy Vasquez | Mike Moore | Brent Krause |
| Alexander Ramirez | Virgil Hill | Michael Bernal | Tyler Johnson |
| Caleb Ketchup | Adam White | Cam Gibson | Brian Seever |
| Alberto Rios | Travis Chapman | Mike Morland | Blake Ochoa |
| Mac McCroskey | Scott Madsen | Chase Tucker | Billy Malone |
| Dario Laverde | Dave Callahan | Edgar Avila | Jon Waltenbury |
| Randy De Jesus | Brian Morrison | Bennie Sandlin | Tonus Thomas |
Batters – 80th/20th Percentiles
| Player | 80th BA | 80th OBP | 80th SLG | 80th OPS+ | 80th WAR | 20th BA | 20th OBP | 20th SLG | 20th OPS+ | 20th WAR |
|---|---|---|---|---|---|---|---|---|---|---|
| Zach Neto | .281 | .353 | .513 | 136 | 5.1 | .234 | .307 | .410 | 98 | 2.3 |
| Mike Trout | .260 | .380 | .502 | 140 | 2.9 | .209 | .329 | .389 | 101 | 0.7 |
| Vaughn Grissom | .277 | .343 | .419 | 110 | 2.2 | .222 | .290 | .329 | 74 | 0.1 |
| Nelson Rada | .273 | .354 | .338 | 93 | 2.3 | .216 | .298 | .267 | 60 | -0.2 |
| Yoán Moncada | .266 | .348 | .479 | 127 | 2.0 | .213 | .290 | .371 | 85 | 0.3 |
| Christian Moore | .254 | .328 | .419 | 105 | 2.2 | .200 | .276 | .311 | 65 | -0.1 |
| Logan O’Hoppe | .269 | .325 | .471 | 118 | 2.3 | .205 | .266 | .354 | 72 | -0.3 |
| Nolan Schanuel | .287 | .379 | .431 | 123 | 2.3 | .234 | .322 | .348 | 86 | -0.3 |
| Donovan Walton | .265 | .332 | .379 | 96 | 1.7 | .211 | .277 | .297 | 61 | -0.1 |
| Jo Adell | .261 | .322 | .517 | 127 | 2.2 | .206 | .271 | .396 | 84 | -0.6 |
| Kyren Paris | .231 | .316 | .401 | 96 | 1.6 | .177 | .263 | .308 | 60 | -0.3 |
| Travis d’Arnaud | .244 | .306 | .445 | 103 | 1.4 | .186 | .251 | .321 | 59 | 0.0 |
| Bryce Teodosio | .245 | .297 | .357 | 81 | 1.5 | .190 | .246 | .274 | 46 | -0.2 |
| Gustavo Campero | .277 | .352 | .450 | 120 | 1.3 | .225 | .299 | .356 | 82 | -0.3 |
| Oswald Peraza | .241 | .306 | .372 | 87 | 1.5 | .189 | .255 | .282 | 52 | -0.2 |
| Denzer Guzman | .247 | .317 | .408 | 97 | 1.8 | .199 | .268 | .310 | 61 | -0.6 |
| J.D. Davis | .255 | .328 | .424 | 106 | 1.3 | .197 | .271 | .321 | 67 | -0.3 |
| Jorge Soler | .247 | .337 | .473 | 118 | 1.2 | .201 | .289 | .364 | 81 | -0.7 |
| Luis Rengifo | .278 | .329 | .404 | 102 | 1.4 | .223 | .275 | .317 | 66 | -0.8 |
| Niko Kavadas | .228 | .334 | .424 | 107 | 1.5 | .171 | .280 | .320 | 67 | -1.0 |
| Ben Gobbel | .256 | .303 | .413 | 97 | 1.2 | .206 | .255 | .322 | 60 | -0.9 |
| Josh Crouch | .237 | .303 | .380 | 84 | 0.9 | .181 | .238 | .282 | 44 | -0.6 |
| LaMonte Wade Jr. | .249 | .368 | .400 | 114 | 1.0 | .194 | .310 | .304 | 73 | -0.7 |
| Anthony Rendon | .264 | .356 | .357 | 98 | 0.6 | .203 | .293 | .274 | 61 | -0.4 |
| Cavan Biggio | .238 | .341 | .367 | 97 | 0.9 | .186 | .291 | .283 | 62 | -0.6 |
| Adrian Placencia | .221 | .307 | .375 | 88 | 1.3 | .167 | .255 | .277 | 50 | -1.0 |
| Carter Kieboom | .280 | .334 | .399 | 104 | 0.8 | .220 | .276 | .309 | 62 | -1.2 |
| Chad Wallach | .233 | .295 | .396 | 85 | 0.6 | .176 | .240 | .281 | 45 | -0.8 |
| Yolmer Sánchez | .224 | .319 | .317 | 76 | 0.8 | .173 | .269 | .240 | 44 | -0.8 |
| Zach Humphreys | .235 | .312 | .336 | 77 | 0.6 | .174 | .248 | .250 | 39 | -0.8 |
| Myles Emmerson | .232 | .294 | .336 | 77 | 0.7 | .172 | .231 | .246 | 36 | -0.9 |
| Tim Anderson | .280 | .316 | .340 | 82 | 0.7 | .211 | .251 | .265 | 45 | -0.9 |
| Travis Blankenhorn | .225 | .300 | .421 | 95 | 0.8 | .175 | .249 | .314 | 57 | -1.0 |
| Chris Taylor | .248 | .327 | .391 | 98 | 0.5 | .186 | .268 | .287 | 56 | -1.0 |
| Peter Burns | .217 | .312 | .273 | 64 | 0.0 | .151 | .254 | .193 | 27 | -0.5 |
| Rio Foster | .238 | .329 | .387 | 97 | 0.5 | .188 | .276 | .295 | 61 | -1.2 |
| Caleb Pendleton | .200 | .229 | .314 | 48 | -0.2 | .148 | .173 | .224 | 10 | -0.6 |
| Juan Flores | .227 | .279 | .345 | 71 | 0.7 | .167 | .219 | .253 | 31 | -1.2 |
| Omar Martinez | .225 | .306 | .380 | 91 | 0.9 | .168 | .248 | .275 | 49 | -1.3 |
| Brandon Drury | .249 | .315 | .421 | 102 | 0.6 | .189 | .256 | .301 | 56 | -1.4 |
| Tucker Flint | .231 | .316 | .389 | 94 | 0.7 | .176 | .264 | .292 | 55 | -1.7 |
| Joe Redfield | .234 | .296 | .329 | 73 | -0.2 | .175 | .237 | .245 | 37 | -1.1 |
| Matthew Lugo | .252 | .295 | .422 | 98 | 0.7 | .199 | .242 | .332 | 60 | -1.6 |
| Oscar Colás | .248 | .299 | .401 | 93 | 0.6 | .197 | .249 | .312 | 57 | -1.4 |
| Matt Coutney | .244 | .306 | .392 | 92 | 0.3 | .190 | .258 | .303 | 56 | -1.7 |
| Capri Ortiz | .241 | .294 | .331 | 74 | 0.3 | .189 | .244 | .252 | 41 | -1.6 |
| David Calabrese | .217 | .281 | .342 | 69 | 0.0 | .167 | .232 | .260 | 37 | -1.8 |
| Ryan Nicholson | .236 | .312 | .386 | 91 | 0.3 | .185 | .262 | .301 | 56 | -1.9 |
| Evan Edwards | .224 | .302 | .360 | 82 | -0.1 | .166 | .246 | .259 | 41 | -1.5 |
| Kevin Maitan | .237 | .289 | .343 | 73 | -0.3 | .176 | .227 | .246 | 32 | -1.6 |
| Sebastián Rivero | .225 | .268 | .341 | 67 | -0.2 | .168 | .212 | .253 | 30 | -1.6 |
| Sonny DiChiara | .215 | .304 | .352 | 80 | -0.2 | .162 | .246 | .261 | 42 | -1.6 |
| Mitchell Daly | .199 | .266 | .275 | 49 | -0.3 | .146 | .210 | .196 | 15 | -1.7 |
| Arol Vera | .229 | .275 | .330 | 67 | 0.0 | .174 | .219 | .245 | 29 | -2.0 |
| Cole Fontenelle | .209 | .283 | .338 | 71 | 0.0 | .154 | .228 | .236 | 29 | -2.0 |
| David Mershon | .209 | .299 | .280 | 61 | -0.3 | .151 | .240 | .203 | 25 | -2.0 |
| Anthony Scull | .244 | .291 | .358 | 79 | -0.2 | .191 | .243 | .278 | 46 | -2.4 |
| Korey Holland | .236 | .273 | .370 | 76 | -0.4 | .174 | .215 | .275 | 36 | -2.2 |
| Alexander Ramirez | .223 | .269 | .371 | 74 | -0.4 | .154 | .203 | .252 | 26 | -2.3 |
| Caleb Ketchup | .212 | .282 | .319 | 64 | -0.4 | .155 | .228 | .239 | 29 | -2.3 |
| Alberto Rios | .188 | .252 | .266 | 43 | -1.0 | .131 | .197 | .179 | 5 | -2.0 |
| Mac McCroskey | .195 | .254 | .249 | 41 | -1.3 | .145 | .207 | .187 | 12 | -2.5 |
| Dario Laverde | .232 | .282 | .321 | 68 | -1.0 | .173 | .224 | .240 | 30 | -2.9 |
| Randy De Jesus | .215 | .277 | .370 | 76 | -1.0 | .160 | .221 | .273 | 37 | -3.5 |
Batters – Platoon Splits
| Player | BA vs. L | OBP vs. L | SLG vs. L | BA vs. R | OBP vs. R | SLG vs. R |
|---|---|---|---|---|---|---|
| Zach Neto | .274 | .348 | .500 | .251 | .324 | .448 |
| Mike Trout | .231 | .357 | .413 | .236 | .352 | .451 |
| Vaughn Grissom | .252 | .323 | .361 | .250 | .313 | .380 |
| Nelson Rada | .236 | .316 | .286 | .251 | .330 | .311 |
| Yoán Moncada | .232 | .308 | .390 | .242 | .327 | .429 |
| Christian Moore | .233 | .315 | .395 | .226 | .295 | .350 |
| Logan O’Hoppe | .242 | .312 | .438 | .231 | .289 | .397 |
| Nolan Schanuel | .252 | .340 | .366 | .264 | .353 | .390 |
| Donovan Walton | .232 | .293 | .330 | .240 | .308 | .343 |
| Jo Adell | .238 | .302 | .483 | .231 | .295 | .440 |
| Kyren Paris | .210 | .301 | .370 | .203 | .284 | .347 |
| Travis d’Arnaud | .219 | .286 | .375 | .214 | .275 | .382 |
| Bryce Teodosio | .219 | .274 | .298 | .220 | .274 | .323 |
| Gustavo Campero | .253 | .321 | .421 | .248 | .329 | .390 |
| Oswald Peraza | .214 | .285 | .336 | .213 | .273 | .323 |
| Denzer Guzman | .227 | .299 | .367 | .217 | .283 | .343 |
| J.D. Davis | .233 | .310 | .398 | .221 | .291 | .362 |
| Jorge Soler | .228 | .325 | .426 | .223 | .308 | .416 |
| Luis Rengifo | .257 | .301 | .382 | .247 | .302 | .354 |
| Niko Kavadas | .189 | .291 | .320 | .206 | .314 | .389 |
| Ben Gobbel | .231 | .285 | .380 | .233 | .282 | .365 |
| Josh Crouch | .209 | .265 | .352 | .209 | .269 | .322 |
| LaMonte Wade Jr. | .203 | .307 | .281 | .226 | .344 | .376 |
| Anthony Rendon | .250 | .346 | .364 | .226 | .315 | .298 |
| Cavan Biggio | .205 | .308 | .282 | .214 | .320 | .336 |
| Adrian Placencia | .203 | .283 | .331 | .188 | .276 | .318 |
| Carter Kieboom | .257 | .317 | .376 | .247 | .304 | .343 |
| Chad Wallach | .209 | .281 | .349 | .199 | .259 | .327 |
| Yolmer Sánchez | .204 | .289 | .265 | .197 | .293 | .282 |
| Zach Humphreys | .213 | .294 | .307 | .200 | .271 | .281 |
| Myles Emmerson | .212 | .280 | .294 | .195 | .251 | .284 |
| Tim Anderson | .264 | .295 | .330 | .236 | .275 | .288 |
| Travis Blankenhorn | .200 | .267 | .318 | .202 | .272 | .383 |
| Chris Taylor | .211 | .294 | .333 | .215 | .296 | .339 |
| Peter Burns | .172 | .273 | .207 | .187 | .282 | .240 |
| Rio Foster | .216 | .309 | .351 | .213 | .298 | .336 |
| Caleb Pendleton | .167 | .194 | .300 | .180 | .206 | .246 |
| Juan Flores | .202 | .250 | .298 | .193 | .243 | .289 |
| Omar Martinez | .190 | .261 | .280 | .196 | .280 | .336 |
| Brandon Drury | .225 | .286 | .363 | .216 | .285 | .355 |
| Tucker Flint | .200 | .281 | .333 | .203 | .294 | .340 |
| Joe Redfield | .208 | .276 | .283 | .203 | .262 | .286 |
| Matthew Lugo | .227 | .275 | .373 | .223 | .266 | .373 |
| Oscar Colás | .218 | .269 | .339 | .221 | .275 | .358 |
| Matt Coutney | .209 | .276 | .348 | .220 | .285 | .350 |
| Capri Ortiz | .212 | .268 | .288 | .212 | .268 | .286 |
| David Calabrese | .183 | .243 | .262 | .194 | .262 | .311 |
| Ryan Nicholson | .198 | .269 | .306 | .215 | .293 | .356 |
| Evan Edwards | .187 | .265 | .297 | .194 | .272 | .306 |
| Kevin Maitan | .213 | .268 | .292 | .204 | .252 | .296 |
| Sebastián Rivero | .202 | .253 | .286 | .197 | .234 | .303 |
| Sonny DiChiara | .190 | .289 | .310 | .186 | .270 | .298 |
| Mitchell Daly | .182 | .258 | .239 | .166 | .227 | .235 |
| Arol Vera | .202 | .246 | .264 | .199 | .249 | .287 |
| Cole Fontenelle | .173 | .243 | .279 | .183 | .257 | .282 |
| David Mershon | .180 | .263 | .213 | .178 | .270 | .251 |
| Anthony Scull | .213 | .263 | .291 | .218 | .269 | .330 |
| Korey Holland | .211 | .256 | .339 | .200 | .240 | .312 |
| Alexander Ramirez | .190 | .241 | .314 | .180 | .226 | .301 |
| Caleb Ketchup | .186 | .262 | .283 | .181 | .249 | .269 |
| Alberto Rios | .169 | .246 | .237 | .152 | .210 | .212 |
| Mac McCroskey | .175 | .241 | .225 | .169 | .227 | .219 |
| Dario Laverde | .200 | .248 | .273 | .201 | .253 | .275 |
| Randy De Jesus | .193 | .257 | .341 | .186 | .242 | .308 |
Pitchers – Standard
| Player | T | Age | W | L | ERA | G | GS | IP | H | ER | HR | BB | SO |
|---|---|---|---|---|---|---|---|---|---|---|---|---|---|
| José Soriano | R | 27 | 9 | 8 | 4.05 | 30 | 24 | 142.3 | 127 | 64 | 12 | 63 | 133 |
| Yusei Kikuchi | L | 35 | 7 | 8 | 4.33 | 29 | 28 | 147.7 | 150 | 71 | 22 | 57 | 151 |
| Reid Detmers | L | 26 | 7 | 7 | 4.12 | 39 | 17 | 113.7 | 99 | 52 | 14 | 39 | 129 |
| Grayson Rodriguez | R | 26 | 5 | 6 | 4.10 | 19 | 19 | 96.7 | 90 | 44 | 13 | 32 | 101 |
| George Klassen | R | 24 | 6 | 8 | 4.68 | 23 | 23 | 102.0 | 100 | 53 | 14 | 42 | 94 |
| Ryan Johnson | R | 23 | 4 | 5 | 4.24 | 27 | 12 | 70.0 | 71 | 33 | 9 | 22 | 64 |
| Tyler Anderson | L | 36 | 5 | 8 | 4.84 | 24 | 23 | 126.3 | 129 | 68 | 21 | 51 | 98 |
| Alek Manoah | R | 28 | 4 | 6 | 4.00 | 17 | 17 | 87.0 | 82 | 45 | 11 | 35 | 73 |
| Caden Dana | R | 22 | 7 | 11 | 4.91 | 24 | 23 | 117.3 | 112 | 64 | 18 | 51 | 108 |
| Mitch Farris | L | 25 | 5 | 8 | 4.89 | 25 | 23 | 119.7 | 119 | 65 | 18 | 51 | 111 |
| Chase Silseth | R | 26 | 3 | 4 | 4.36 | 27 | 12 | 66.0 | 61 | 32 | 9 | 29 | 67 |
| Brock Burke | L | 29 | 4 | 3 | 3.79 | 61 | 1 | 61.7 | 59 | 26 | 7 | 19 | 57 |
| Ben Joyce | R | 25 | 2 | 1 | 3.69 | 44 | 1 | 46.3 | 37 | 19 | 4 | 20 | 54 |
| Kyle Hendricks | R | 36 | 5 | 9 | 5.16 | 24 | 23 | 122.0 | 136 | 70 | 20 | 36 | 85 |
| Drew Pomeranz | L | 37 | 2 | 3 | 4.13 | 55 | 4 | 48.0 | 44 | 22 | 6 | 15 | 49 |
| Kirby Yates | R | 39 | 3 | 4 | 3.95 | 48 | 0 | 43.3 | 34 | 19 | 5 | 21 | 52 |
| Jack Kochanowicz | R | 25 | 6 | 9 | 5.26 | 25 | 24 | 125.0 | 134 | 73 | 17 | 46 | 77 |
| Luis García | R | 39 | 2 | 2 | 4.10 | 51 | 1 | 48.3 | 49 | 22 | 4 | 19 | 42 |
| Victor Mederos | R | 25 | 5 | 9 | 5.12 | 22 | 20 | 103.7 | 109 | 59 | 15 | 43 | 77 |
| Jose Gonzalez | R | 24 | 5 | 8 | 5.24 | 21 | 19 | 91.0 | 99 | 53 | 15 | 26 | 67 |
| Cody Laweryson | R | 28 | 3 | 3 | 4.26 | 34 | 2 | 50.7 | 50 | 24 | 7 | 16 | 45 |
| Dakota Hudson | R | 31 | 5 | 8 | 5.35 | 23 | 20 | 117.7 | 133 | 70 | 16 | 44 | 67 |
| Shaun Anderson | R | 31 | 4 | 7 | 5.30 | 26 | 18 | 103.7 | 120 | 61 | 18 | 30 | 70 |
| José Fermin | R | 24 | 4 | 6 | 4.37 | 54 | 1 | 57.7 | 50 | 28 | 8 | 26 | 59 |
| Angel Felipe | R | 28 | 1 | 2 | 4.35 | 35 | 2 | 39.3 | 35 | 19 | 4 | 22 | 41 |
| Carson Fulmer | R | 32 | 2 | 3 | 4.96 | 30 | 6 | 69.0 | 70 | 38 | 10 | 29 | 57 |
| Sam Aldegheri | L | 24 | 6 | 10 | 5.43 | 24 | 23 | 122.7 | 130 | 74 | 20 | 55 | 92 |
| Sam Bachman | R | 26 | 3 | 4 | 4.56 | 35 | 5 | 47.3 | 47 | 24 | 5 | 23 | 40 |
| Walbert Urena | R | 22 | 5 | 8 | 5.40 | 25 | 25 | 118.3 | 124 | 71 | 16 | 61 | 85 |
| Robert Stephenson | R | 33 | 1 | 2 | 4.25 | 31 | 0 | 29.7 | 27 | 14 | 4 | 9 | 33 |
| Houston Harding | L | 28 | 2 | 3 | 5.05 | 17 | 7 | 51.7 | 56 | 29 | 7 | 25 | 36 |
| Touki Toussaint | R | 30 | 2 | 4 | 5.14 | 23 | 6 | 68.3 | 66 | 39 | 9 | 38 | 63 |
| José Quijada | L | 30 | 2 | 3 | 4.33 | 38 | 0 | 35.3 | 30 | 17 | 4 | 17 | 40 |
| Mason Erla | R | 28 | 2 | 4 | 5.16 | 18 | 6 | 45.3 | 51 | 26 | 7 | 17 | 28 |
| Joel Hurtado | R | 25 | 4 | 8 | 5.52 | 19 | 18 | 89.7 | 101 | 55 | 14 | 38 | 54 |
| José Ureña | R | 34 | 2 | 4 | 5.22 | 23 | 11 | 70.7 | 78 | 41 | 11 | 32 | 48 |
| Andrew Chafin | L | 36 | 2 | 3 | 4.46 | 50 | 0 | 42.3 | 40 | 21 | 5 | 23 | 46 |
| Jordan Romano | R | 33 | 3 | 3 | 4.43 | 44 | 0 | 40.7 | 37 | 20 | 6 | 15 | 44 |
| Ryan Costeiu | R | 25 | 4 | 8 | 5.54 | 21 | 17 | 92.7 | 98 | 57 | 16 | 39 | 73 |
| Brett Kerry | R | 27 | 5 | 8 | 5.57 | 22 | 19 | 108.3 | 118 | 67 | 21 | 34 | 75 |
| Jack Dashwood | L | 28 | 2 | 4 | 4.94 | 39 | 2 | 51.0 | 53 | 28 | 8 | 19 | 44 |
| Ryan Zeferjahn | R | 28 | 4 | 4 | 4.58 | 50 | 1 | 55.0 | 47 | 28 | 8 | 30 | 63 |
| Luke Murphy | R | 26 | 2 | 2 | 4.88 | 37 | 1 | 48.0 | 48 | 26 | 6 | 20 | 40 |
| Andrew Vasquez | L | 32 | 2 | 4 | 5.27 | 29 | 2 | 41.0 | 42 | 24 | 6 | 15 | 33 |
| Camden Minacci | R | 24 | 3 | 3 | 4.82 | 45 | 0 | 56.0 | 59 | 30 | 7 | 23 | 44 |
| Kenyon Yovan | R | 28 | 3 | 3 | 4.89 | 40 | 1 | 49.7 | 51 | 27 | 7 | 21 | 41 |
| Angel Perdomo | L | 32 | 1 | 3 | 5.00 | 26 | 0 | 27.0 | 24 | 15 | 4 | 17 | 28 |
| Kelvin Cáceres | R | 26 | 2 | 2 | 5.10 | 32 | 1 | 42.3 | 40 | 24 | 5 | 24 | 40 |
| Brady Choban | R | 25 | 3 | 5 | 5.04 | 45 | 0 | 50.0 | 52 | 28 | 6 | 19 | 34 |
| Victor González | L | 30 | 1 | 2 | 4.99 | 37 | 0 | 39.7 | 39 | 22 | 5 | 20 | 30 |
| Dylan Phillips | L | 27 | 2 | 4 | 5.04 | 41 | 1 | 60.7 | 63 | 34 | 9 | 23 | 47 |
| Hunter Strickland | R | 37 | 2 | 3 | 5.06 | 41 | 0 | 42.7 | 43 | 24 | 6 | 20 | 32 |
| Jared Southard | R | 25 | 2 | 3 | 4.88 | 43 | 0 | 55.3 | 56 | 30 | 8 | 22 | 47 |
| Nick Jones | L | 27 | 2 | 3 | 5.21 | 35 | 2 | 48.3 | 50 | 28 | 7 | 22 | 40 |
| A.J. Block | L | 28 | 2 | 3 | 5.24 | 31 | 1 | 46.3 | 46 | 27 | 6 | 23 | 42 |
| Bryce Osmond | R | 25 | 2 | 6 | 6.00 | 14 | 13 | 51.0 | 55 | 34 | 10 | 25 | 39 |
| Samy Natera Jr. | L | 26 | 2 | 4 | 5.40 | 38 | 5 | 55.0 | 52 | 33 | 9 | 34 | 56 |
| Roman Phansalkar | R | 28 | 1 | 2 | 5.87 | 30 | 0 | 38.3 | 40 | 25 | 6 | 22 | 29 |
| Endrys Briceno | R | 34 | 1 | 1 | 6.14 | 24 | 0 | 36.7 | 41 | 25 | 6 | 21 | 26 |
Pitchers – Advanced
| Player | IP | K/9 | BB/9 | HR/9 | BB% | K% | BABIP | ERA+ | 3ERA+ | FIP | ERA- | WAR |
|---|---|---|---|---|---|---|---|---|---|---|---|---|
| José Soriano | 142.3 | 8.4 | 4.0 | 0.8 | 10.2% | 21.6% | .288 | 104 | 104 | 3.93 | 96 | 2.2 |
| Yusei Kikuchi | 147.7 | 9.2 | 3.5 | 1.3 | 8.8% | 23.4% | .312 | 97 | 91 | 4.29 | 103 | 1.8 |
| Reid Detmers | 113.7 | 10.2 | 3.1 | 1.1 | 8.2% | 27.1% | .293 | 102 | 106 | 3.68 | 98 | 1.7 |
| Grayson Rodriguez | 96.7 | 9.4 | 3.0 | 1.2 | 7.8% | 24.6% | .296 | 103 | 103 | 3.94 | 97 | 1.4 |
| George Klassen | 102.0 | 8.3 | 3.7 | 1.2 | 9.3% | 20.7% | .296 | 90 | 95 | 4.49 | 111 | 1.0 |
| Ryan Johnson | 70.0 | 8.2 | 2.8 | 1.2 | 7.4% | 21.5% | .305 | 99 | 105 | 3.95 | 101 | 0.9 |
| Tyler Anderson | 126.3 | 7.0 | 3.6 | 1.5 | 9.2% | 17.7% | .285 | 87 | 81 | 5.10 | 115 | 0.9 |
| Alek Manoah | 87.0 | 7.6 | 3.6 | 1.1 | 9.3% | 19.5% | .281 | 90 | 91 | 4.61 | 110 | 0.8 |
| Caden Dana | 117.3 | 8.3 | 3.9 | 1.4 | 9.9% | 20.9% | .285 | 86 | 92 | 4.80 | 116 | 0.8 |
| Mitch Farris | 119.7 | 8.3 | 3.8 | 1.4 | 9.7% | 21.0% | .296 | 86 | 91 | 4.62 | 116 | 0.8 |
| Chase Silseth | 66.0 | 9.1 | 4.0 | 1.2 | 10.0% | 23.2% | .291 | 97 | 100 | 4.36 | 103 | 0.7 |
| Brock Burke | 61.7 | 8.3 | 2.8 | 1.0 | 7.3% | 21.9% | .295 | 111 | 108 | 3.81 | 90 | 0.6 |
| Ben Joyce | 46.3 | 10.5 | 3.9 | 0.8 | 10.2% | 27.4% | .287 | 114 | 117 | 3.64 | 88 | 0.6 |
| Kyle Hendricks | 122.0 | 6.3 | 2.7 | 1.5 | 6.8% | 16.1% | .300 | 82 | 76 | 4.88 | 122 | 0.5 |
| Drew Pomeranz | 48.0 | 9.2 | 2.8 | 1.1 | 7.4% | 24.3% | .292 | 102 | 93 | 4.00 | 98 | 0.5 |
| Kirby Yates | 43.3 | 10.8 | 4.4 | 1.0 | 11.4% | 28.3% | .279 | 107 | 101 | 3.92 | 94 | 0.4 |
| Jack Kochanowicz | 125.0 | 5.5 | 3.3 | 1.2 | 8.3% | 14.0% | .289 | 80 | 84 | 5.07 | 125 | 0.4 |
| Luis García | 48.3 | 7.8 | 3.5 | 0.7 | 8.9% | 19.6% | .313 | 103 | 99 | 3.87 | 97 | 0.4 |
| Victor Mederos | 103.7 | 6.7 | 3.7 | 1.3 | 9.4% | 16.8% | .294 | 82 | 85 | 5.18 | 122 | 0.4 |
| Jose Gonzalez | 91.0 | 6.6 | 2.6 | 1.5 | 6.5% | 16.8% | .297 | 80 | 86 | 4.99 | 124 | 0.3 |
| Cody Laweryson | 50.7 | 8.0 | 2.8 | 1.2 | 7.4% | 20.9% | .295 | 99 | 99 | 4.25 | 101 | 0.3 |
| Dakota Hudson | 117.7 | 5.1 | 3.4 | 1.2 | 8.4% | 12.8% | .298 | 79 | 78 | 5.09 | 127 | 0.3 |
| Shaun Anderson | 103.7 | 6.1 | 2.6 | 1.6 | 6.5% | 15.3% | .304 | 80 | 78 | 5.03 | 125 | 0.3 |
| José Fermin | 57.7 | 9.2 | 4.1 | 1.2 | 10.4% | 23.7% | .276 | 96 | 103 | 4.38 | 104 | 0.2 |
| Angel Felipe | 39.3 | 9.4 | 5.0 | 0.9 | 12.6% | 23.4% | .295 | 97 | 96 | 4.38 | 103 | 0.2 |
| Carson Fulmer | 69.0 | 7.4 | 3.8 | 1.3 | 9.5% | 18.6% | .293 | 85 | 83 | 4.79 | 118 | 0.2 |
| Sam Aldegheri | 122.7 | 6.7 | 4.0 | 1.5 | 9.9% | 16.6% | .292 | 78 | 83 | 5.35 | 128 | 0.2 |
| Sam Bachman | 47.3 | 7.6 | 4.4 | 1.0 | 10.8% | 18.9% | .300 | 92 | 95 | 4.56 | 109 | 0.2 |
| Walbert Urena | 118.3 | 6.5 | 4.6 | 1.2 | 11.3% | 15.7% | .293 | 78 | 84 | 5.23 | 128 | 0.2 |
| Robert Stephenson | 29.7 | 10.0 | 2.7 | 1.2 | 7.2% | 26.4% | .299 | 99 | 95 | 3.70 | 101 | 0.2 |
| Houston Harding | 51.7 | 6.3 | 4.4 | 1.2 | 10.7% | 15.4% | .299 | 83 | 84 | 5.04 | 120 | 0.1 |
| Touki Toussaint | 68.3 | 8.3 | 5.0 | 1.2 | 12.4% | 20.5% | .294 | 82 | 81 | 4.96 | 122 | 0.1 |
| José Quijada | 35.3 | 10.2 | 4.3 | 1.0 | 11.3% | 26.5% | .289 | 97 | 96 | 3.98 | 103 | 0.1 |
| Mason Erla | 45.3 | 5.6 | 3.4 | 1.4 | 8.4% | 13.9% | .297 | 82 | 83 | 5.19 | 122 | 0.1 |
| Joel Hurtado | 89.7 | 5.4 | 3.8 | 1.4 | 9.3% | 13.3% | .295 | 76 | 80 | 5.49 | 132 | 0.1 |
| José Ureña | 70.7 | 6.1 | 4.1 | 1.4 | 10.1% | 15.1% | .298 | 81 | 76 | 5.31 | 124 | 0.1 |
| Andrew Chafin | 42.3 | 9.8 | 4.9 | 1.1 | 12.0% | 24.0% | .310 | 94 | 85 | 4.23 | 106 | 0.1 |
| Jordan Romano | 40.7 | 9.7 | 3.3 | 1.3 | 8.8% | 25.7% | .292 | 95 | 89 | 4.25 | 105 | 0.1 |
| Ryan Costeiu | 92.7 | 7.1 | 3.8 | 1.6 | 9.4% | 17.7% | .293 | 76 | 81 | 5.19 | 131 | 0.0 |
| Brett Kerry | 108.3 | 6.2 | 2.8 | 1.7 | 7.2% | 15.9% | .286 | 76 | 78 | 5.35 | 132 | 0.0 |
| Jack Dashwood | 51.0 | 7.8 | 3.4 | 1.4 | 8.5% | 19.7% | .300 | 85 | 87 | 4.71 | 118 | 0.0 |
| Ryan Zeferjahn | 55.0 | 10.3 | 4.9 | 1.3 | 12.3% | 25.9% | .283 | 92 | 92 | 4.73 | 109 | 0.0 |
| Luke Murphy | 48.0 | 7.5 | 3.8 | 1.1 | 9.5% | 19.0% | .296 | 86 | 90 | 4.56 | 116 | -0.1 |
| Andrew Vasquez | 41.0 | 7.2 | 3.3 | 1.3 | 8.4% | 18.5% | .293 | 80 | 79 | 5.07 | 125 | -0.1 |
| Camden Minacci | 56.0 | 7.1 | 3.7 | 1.1 | 9.2% | 17.5% | .302 | 87 | 93 | 4.56 | 115 | -0.1 |
| Kenyon Yovan | 49.7 | 7.4 | 3.8 | 1.3 | 9.4% | 18.4% | .297 | 86 | 87 | 4.79 | 116 | -0.1 |
| Angel Perdomo | 27.0 | 9.3 | 5.7 | 1.3 | 13.8% | 22.8% | .282 | 84 | 80 | 5.24 | 119 | -0.1 |
| Kelvin Cáceres | 42.3 | 8.5 | 5.1 | 1.1 | 12.2% | 20.4% | .294 | 83 | 85 | 4.94 | 121 | -0.2 |
| Brady Choban | 50.0 | 6.1 | 3.4 | 1.1 | 8.6% | 15.4% | .291 | 84 | 87 | 4.74 | 120 | -0.2 |
| Victor González | 39.7 | 6.8 | 4.5 | 1.1 | 11.2% | 16.8% | .283 | 84 | 83 | 5.10 | 118 | -0.2 |
| Dylan Phillips | 60.7 | 7.0 | 3.4 | 1.3 | 8.5% | 17.4% | .292 | 84 | 86 | 5.03 | 119 | -0.2 |
| Hunter Strickland | 42.7 | 6.7 | 4.2 | 1.3 | 10.6% | 16.9% | .285 | 83 | 76 | 5.04 | 120 | -0.2 |
| Jared Southard | 55.3 | 7.6 | 3.6 | 1.3 | 8.9% | 19.0% | .294 | 86 | 91 | 4.81 | 116 | -0.2 |
| Nick Jones | 48.3 | 7.5 | 4.1 | 1.3 | 10.1% | 18.3% | .299 | 81 | 83 | 5.00 | 123 | -0.2 |
| A.J. Block | 46.3 | 8.2 | 4.5 | 1.2 | 11.1% | 20.2% | .299 | 80 | 82 | 4.91 | 125 | -0.2 |
| Bryce Osmond | 51.0 | 6.9 | 4.4 | 1.8 | 10.8% | 16.8% | .290 | 70 | 76 | 5.95 | 142 | -0.2 |
| Samy Natera Jr. | 55.0 | 9.2 | 5.6 | 1.5 | 13.4% | 22.1% | .291 | 78 | 82 | 5.38 | 128 | -0.2 |
| Roman Phansalkar | 38.3 | 6.8 | 5.2 | 1.4 | 12.5% | 16.5% | .291 | 72 | 73 | 5.80 | 139 | -0.6 |
| Endrys Briceno | 36.7 | 6.4 | 5.2 | 1.5 | 12.1% | 15.0% | .302 | 69 | 66 | 6.00 | 146 | -0.6 |
Pitchers – Top Near-Age Comps
Pitchers – Splits and Percentiles
| Player | BA vs. L | OBP vs. L | SLG vs. L | BA vs. R | OBP vs. R | SLG vs. R | 80th WAR | 20th WAR | 80th ERA | 20th ERA |
|---|---|---|---|---|---|---|---|---|---|---|
| José Soriano | .217 | .309 | .336 | .254 | .339 | .387 | 3.1 | 0.9 | 3.54 | 4.82 |
| Yusei Kikuchi | .224 | .286 | .366 | .265 | .335 | .448 | 2.8 | 0.5 | 3.70 | 5.25 |
| Reid Detmers | .204 | .278 | .340 | .236 | .305 | .393 | 2.6 | 0.4 | 3.50 | 5.05 |
| Grayson Rodriguez | .223 | .289 | .380 | .255 | .318 | .423 | 2.2 | 0.6 | 3.43 | 4.83 |
| George Klassen | .242 | .322 | .401 | .258 | .330 | .428 | 1.7 | 0.2 | 4.08 | 5.27 |
| Ryan Johnson | .271 | .331 | .443 | .229 | .273 | .361 | 1.6 | 0.4 | 3.51 | 5.00 |
| Tyler Anderson | .270 | .343 | .451 | .258 | .331 | .454 | 1.7 | 0.1 | 4.26 | 5.53 |
| Alek Manoah | .273 | .362 | .459 | .216 | .293 | .352 | 1.3 | 0.2 | 4.13 | 5.28 |
| Caden Dana | .244 | .352 | .394 | .250 | .314 | .450 | 1.5 | -0.1 | 4.42 | 5.50 |
| Mitch Farris | .238 | .310 | .338 | .258 | .333 | .466 | 1.7 | -0.1 | 4.29 | 5.63 |
| Chase Silseth | .244 | .341 | .437 | .237 | .307 | .370 | 1.3 | 0.1 | 3.68 | 5.19 |
| Brock Burke | .240 | .293 | .360 | .248 | .309 | .406 | 1.2 | 0.1 | 3.12 | 4.58 |
| Ben Joyce | .214 | .320 | .357 | .216 | .314 | .318 | 1.0 | 0.0 | 3.07 | 4.57 |
| Kyle Hendricks | .277 | .342 | .485 | .276 | .315 | .452 | 1.1 | -0.5 | 4.63 | 6.04 |
| Drew Pomeranz | .224 | .296 | .327 | .248 | .322 | .429 | 1.0 | -0.2 | 3.05 | 5.73 |
| Kirby Yates | .224 | .342 | .388 | .209 | .298 | .352 | 1.0 | -0.2 | 2.84 | 5.67 |
| Jack Kochanowicz | .282 | .359 | .473 | .256 | .324 | .407 | 1.0 | -0.3 | 4.85 | 5.78 |
| Luis García | .274 | .358 | .405 | .241 | .308 | .361 | 0.8 | -0.2 | 3.28 | 5.24 |
| Victor Mederos | .266 | .360 | .432 | .264 | .341 | .445 | 1.0 | -0.2 | 4.70 | 5.69 |
| Jose Gonzalez | .282 | .344 | .492 | .255 | .316 | .427 | 0.8 | -0.2 | 4.75 | 5.91 |
| Cody Laweryson | .247 | .311 | .452 | .255 | .310 | .387 | 0.7 | -0.2 | 3.60 | 5.13 |
| Dakota Hudson | .284 | .358 | .476 | .273 | .333 | .427 | 0.8 | -0.5 | 4.94 | 5.96 |
| Shaun Anderson | .302 | .350 | .520 | .263 | .313 | .446 | 0.8 | -0.4 | 4.77 | 5.94 |
| José Fermin | .231 | .317 | .407 | .232 | .317 | .392 | 0.7 | -0.3 | 3.70 | 5.17 |
| Angel Felipe | .257 | .366 | .457 | .213 | .326 | .300 | 0.5 | -0.3 | 3.74 | 5.51 |
| Carson Fulmer | .279 | .360 | .475 | .243 | .315 | .392 | 0.6 | -0.4 | 4.33 | 5.86 |
| Sam Aldegheri | .239 | .324 | .355 | .278 | .360 | .503 | 0.9 | -0.7 | 4.89 | 6.10 |
| Sam Bachman | .267 | .357 | .442 | .240 | .336 | .360 | 0.5 | -0.2 | 4.08 | 5.22 |
| Walbert Urena | .270 | .363 | .434 | .257 | .348 | .433 | 0.8 | -0.6 | 4.97 | 6.01 |
| Robert Stephenson | .231 | .298 | .423 | .242 | .294 | .387 | 0.5 | -0.2 | 3.12 | 5.98 |
| Houston Harding | .268 | .354 | .366 | .268 | .342 | .471 | 0.5 | -0.2 | 4.58 | 5.70 |
| Touki Toussaint | .273 | .386 | .446 | .229 | .325 | .382 | 0.7 | -0.5 | 4.43 | 6.00 |
| José Quijada | .213 | .315 | .298 | .230 | .320 | .414 | 0.5 | -0.4 | 3.49 | 5.65 |
| Mason Erla | .289 | .368 | .530 | .267 | .318 | .406 | 0.3 | -0.2 | 4.62 | 5.73 |
| Joel Hurtado | .279 | .356 | .453 | .276 | .353 | .469 | 0.4 | -0.4 | 5.14 | 6.03 |
| José Ureña | .295 | .373 | .496 | .255 | .331 | .428 | 0.5 | -0.4 | 4.66 | 5.91 |
| Andrew Chafin | .242 | .342 | .379 | .242 | .333 | .404 | 0.6 | -0.6 | 3.40 | 6.41 |
| Jordan Romano | .221 | .303 | .382 | .250 | .323 | .432 | 0.5 | -0.4 | 3.58 | 5.59 |
| Ryan Costeiu | .269 | .348 | .469 | .260 | .326 | .449 | 0.6 | -0.6 | 5.03 | 6.13 |
| Brett Kerry | .283 | .342 | .490 | .264 | .316 | .477 | 0.8 | -0.7 | 4.96 | 6.16 |
| Jack Dashwood | .250 | .316 | .382 | .265 | .331 | .471 | 0.4 | -0.5 | 4.23 | 5.77 |
| Ryan Zeferjahn | .234 | .351 | .436 | .221 | .331 | .363 | 0.6 | -0.6 | 3.90 | 5.59 |
| Luke Murphy | .253 | .343 | .437 | .255 | .325 | .392 | 0.2 | -0.4 | 4.30 | 5.48 |
| Andrew Vasquez | .246 | .338 | .351 | .269 | .353 | .490 | 0.2 | -0.5 | 4.47 | 6.37 |
| Camden Minacci | .282 | .355 | .445 | .239 | .308 | .385 | 0.2 | -0.5 | 4.32 | 5.39 |
| Kenyon Yovan | .253 | .333 | .425 | .266 | .341 | .440 | 0.3 | -0.5 | 4.22 | 5.64 |
| Angel Perdomo | .200 | .333 | .314 | .258 | .375 | .455 | 0.1 | -0.5 | 4.16 | 6.24 |
| Kelvin Cáceres | .260 | .367 | .429 | .227 | .349 | .364 | 0.1 | -0.6 | 4.59 | 5.99 |
| Brady Choban | .268 | .339 | .433 | .255 | .330 | .402 | 0.1 | -0.5 | 4.52 | 5.61 |
| Victor González | .236 | .333 | .345 | .265 | .365 | .459 | 0.1 | -0.6 | 4.33 | 5.84 |
| Dylan Phillips | .265 | .347 | .494 | .261 | .339 | .408 | 0.2 | -0.7 | 4.47 | 5.87 |
| Hunter Strickland | .279 | .380 | .471 | .247 | .321 | .412 | 0.2 | -0.7 | 4.26 | 6.42 |
| Jared Southard | .240 | .325 | .410 | .269 | .343 | .445 | 0.2 | -0.5 | 4.34 | 5.41 |
| Nick Jones | .231 | .320 | .354 | .276 | .359 | .472 | 0.2 | -0.6 | 4.54 | 6.07 |
| A.J. Block | .224 | .338 | .362 | .264 | .359 | .440 | 0.2 | -0.6 | 4.54 | 5.96 |
| Bryce Osmond | .253 | .357 | .432 | .284 | .363 | .523 | 0.2 | -0.6 | 5.41 | 6.78 |
| Samy Natera Jr. | .235 | .354 | .397 | .250 | .363 | .451 | 0.3 | -0.8 | 4.59 | 6.30 |
| Roman Phansalkar | .284 | .422 | .507 | .247 | .330 | .400 | -0.3 | -0.9 | 5.16 | 6.74 |
| Endrys Briceno | .279 | .395 | .426 | .275 | .372 | .513 | -0.3 | -0.9 | 5.37 | 7.03 |
Players are listed with their most recent teams wherever possible. This includes players who are unsigned or have retired, players who will miss 2026 due to injury, and players who were released in 2025. So yes, if you see Joe Schmoe, who quit baseball back in August to form a Ambient Math-Rock Trip-Hop Yacht Metal band that only performs in abandoned malls, he’s still listed here intentionally. ZiPS is assuming a league with an ERA of 4.16.
Hitters are ranked by zWAR, which is to say, WAR values as calculated by me, Dan Szymborski, whose surname is spelled with a z. WAR values might differ slightly from those that appear in the full release of ZiPS. Finally, I will advise anyone against — and might karate chop anyone guilty of — merely adding up WAR totals on a depth chart to produce projected team WAR. It is important to remember that ZiPS is agnostic about playing time, and has no information about, for example, how quickly a team will call up a prospect or what veteran has fallen into disfavor.
As always, incorrect projections are either caused by misinformation, a non-pragmatic reality, or by the skillful sabotage of our friend and former editor. You can, however, still get mad at me on Twitter or on Bluesky. This last is, however, not an actual requirement.
Cubs Trade for Edward Cabrera and His Amazing Changeup
This offseason has been reasonably busy in terms of actual moves, but light on rumors. One of the few exceptions has involved the Marlins’ Edward Cabrera. The Yankees’ interest in the 27-year-old right-hander has been consistent throughout the winter, but it appears they’ve been beaten to the punch.
Cabrera is indeed on the move, but he’s bound for Chicago, not New York, as Michael Cerami of Bleacher Nation reported late Wednesday morning. The Cubs get a hard-throwing starting pitcher, fresh off a 3.53 ERA in 137 2/3 innings, with three years of team control remaining. In order to entice the Marlins to part with Cabrera, Chicago gave up three position player prospects: Owen Caissie, shortstop Cristian Hernandez, and corner infielder Edgardo De Leon. The Yankees, Jon Heyman says, were “never close.” Read the rest of this entry »
Let’s Hear About Four Prominent Minnesota Twins Prospects
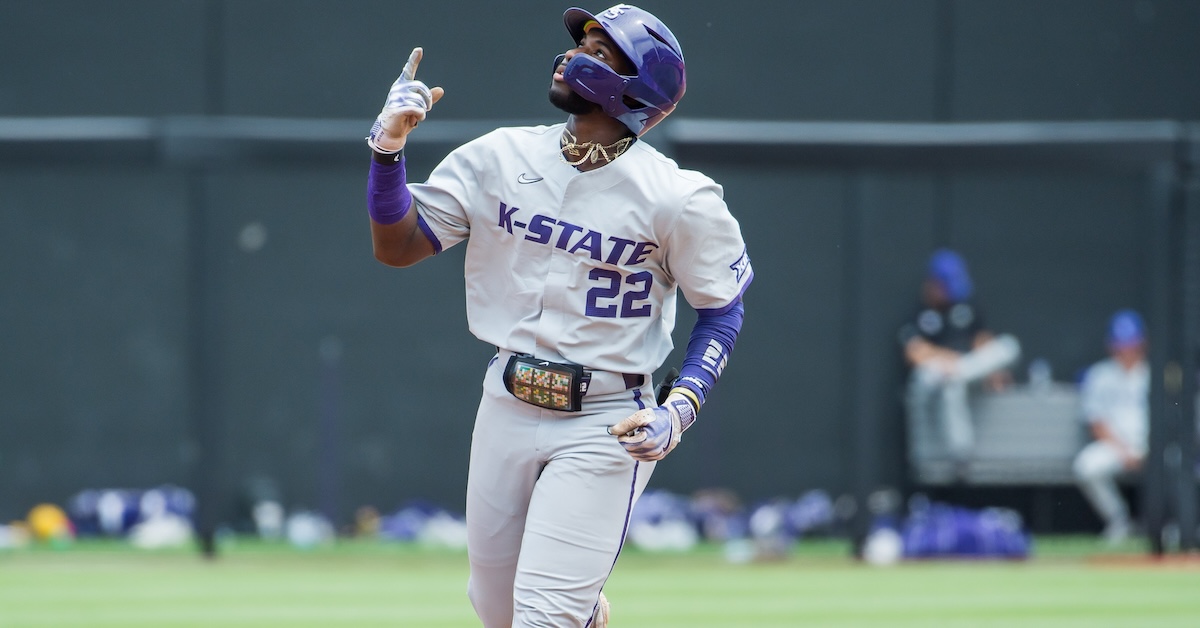
On December 28, Sunday Notes led with a look at how seven of the nine position players projected to start for the Minnesota Twins this coming season were drafted by the club in either the first or second round. (The column also cited homegrown numbers for several other organizations.) Twins president of baseball operations Derek Falvey was quoted extensively within the piece, offering perspective on how the current roster came together.
Today we’ll hear from Twins GM Jeremy Zoll, as well as from Falvey, on a quartet of first- and second-round picks who have yet to reach Minnesota. One is a middle infielder, three are pitchers, and all rank among the team’s top prospects. I asked about each of them when the executives met with members of the media during the Winter Meetings.
———
“It was Kaelen’s first full season, and he had an awesome year,” Zoll said of 23-year-old shortstop Kaelen Culpepper, whom the Twins drafted 21st overall in 2024 out of Kansas State University. “He was between High-A and Double-A, and we couldn’t have asked for it go much better. We’re really pleased. He had the opportunity to go to the Futures Game.
“He’s primarily playing shortstop, but he’s also getting some early work at second base and third base, as well as a little bit of game exposure at both spots. We’ll continue to let that play out as we get through spring training and into the season. We’ll figure it out exactly in terms of placement and proximity. We always kind of let the player dictate that with his performance, but he’s put just about as much pressure on us [as anyone] in terms of us wanting to keep moving him, and keeping him challenged.” Read the rest of this entry »
JAWS and the 2026 Hall of Fame Ballot: Shin-Soo Choo
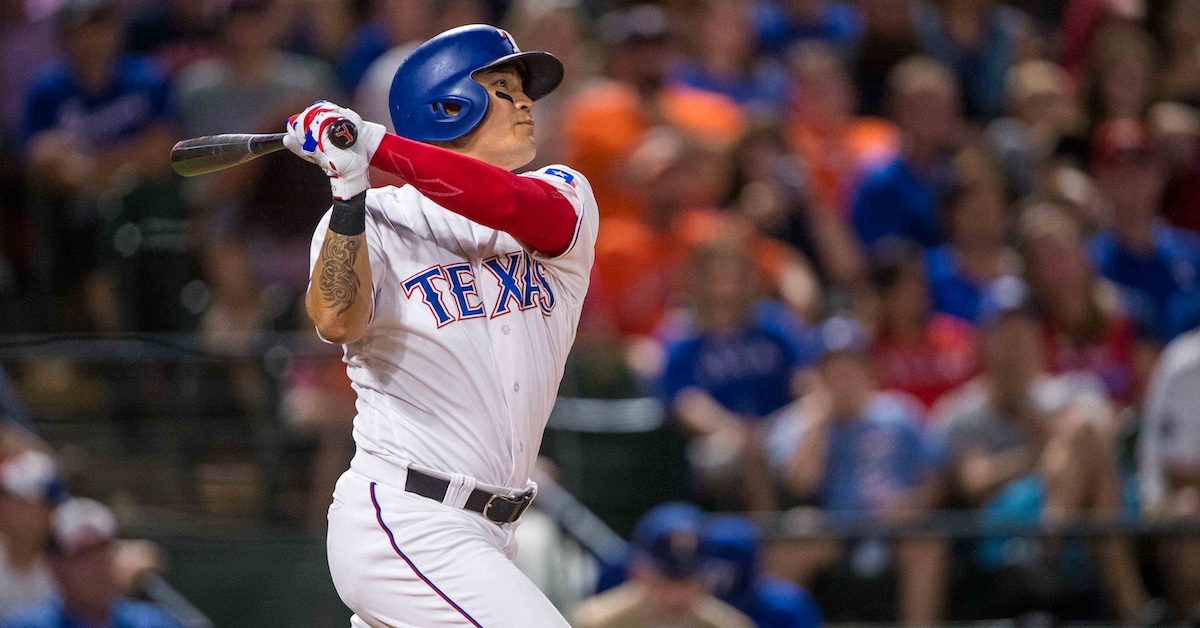
The following article is part of Jay Jaffe’s ongoing look at the candidates on the BBWAA 2026 Hall of Fame ballot. For a detailed introduction to this year’s ballot, and other candidates in the series, use the tool above; an introduction to JAWS can be found here. For a tentative schedule, see here. All WAR figures refer to the Baseball Reference version unless otherwise indicated.
2026 BBWAA Candidate: Shin-Soo Choo
| Player | Pos | Career WAR | Peak WAR | JAWS | H | HR | SB | AVG/OBP/SLG | OPS+ |
|---|---|---|---|---|---|---|---|---|---|
| Shin-Soo Choo | RF | 34.7 | 29.3 | 32.0 | 1,671 | 218 | 157 | .275/.377/.447 | 122 |
Source: Baseball-Reference
By the time Shin-Soo Choo reached the majors with the Mariners in 2005, nine South Korea-born pitchers had followed in the wake of Chan Ho Park, who debuted with the Dodgers in 1994, but just one position player preceded him, namely Hee-Seop Choi. It took a few years and a lopsided trade before Choo’s major league career got off the ground, and he lost significant time to a variety of injuries, but over the course of his 16 seasons with Seattle, Cleveland, Cincinnati, and Texas, he established himself as an on-base machine with considerable pop. He set a number of firsts, including becoming the first South Korean position player to make an All-Star team and now, the first such player to make a Hall of Fame ballot.
To these eyes, that latter distinction is a big deal. Most of the 12 newcomers on this year’s Hall of Fame ballot don’t have the numbers to merit election or even much debate. Their appearance on the ballot after spending at least 10 seasons in the majors with some distinction is its own reward, and with the deadline for voting now past, we’re in the part of the cycle where we can take the time to celebrate these players’ fine careers in their own right. A decade ago, I raised a bit of an international stink when Park — who spent 17 seasons in the majors (1994–2010), won 124 games (still the major league record for a player born in Asia, one ahead of former teammate Hideo Nomo), and became the first South Korea-born player to make an All-Star team — was left off. It felt like a needless snub. “Like Hideo Nomo, who blazed a trail for modern Japanese players to come to the majors, Park deserves the recognition that comes with a spot on the ballot,” I wrote for SI.com. I’ve made noise about other slights since then, and I think the situation has improved over time, so I’m particularly glad to see Choo here.
…
Shin-Soo Choo was born on July 13, 1982 in the Nam district of Busan, South Korea, a coastal city that is the country’s second-largest, behind Seoul. He’s the oldest son of father So-min Choo and mother Yu-jeon Park. He was born into a baseball family, as his mother’s brother, Jeong-Tae Park, starred as a second baseman for the KBO’s Lotte Giants from 1991–2004, winning five Gold Gloves (given to the best all-around player at each position, not just the best defender) and sealing the Giants’ 1992 championship by recording the final out in their Korean Series victory over the Binggrae Eagles. Read the rest of this entry »
Hitters Keep Getting Younger. Pitchers Stay The Same Age.
by Ben Clemens


January 7, 2026
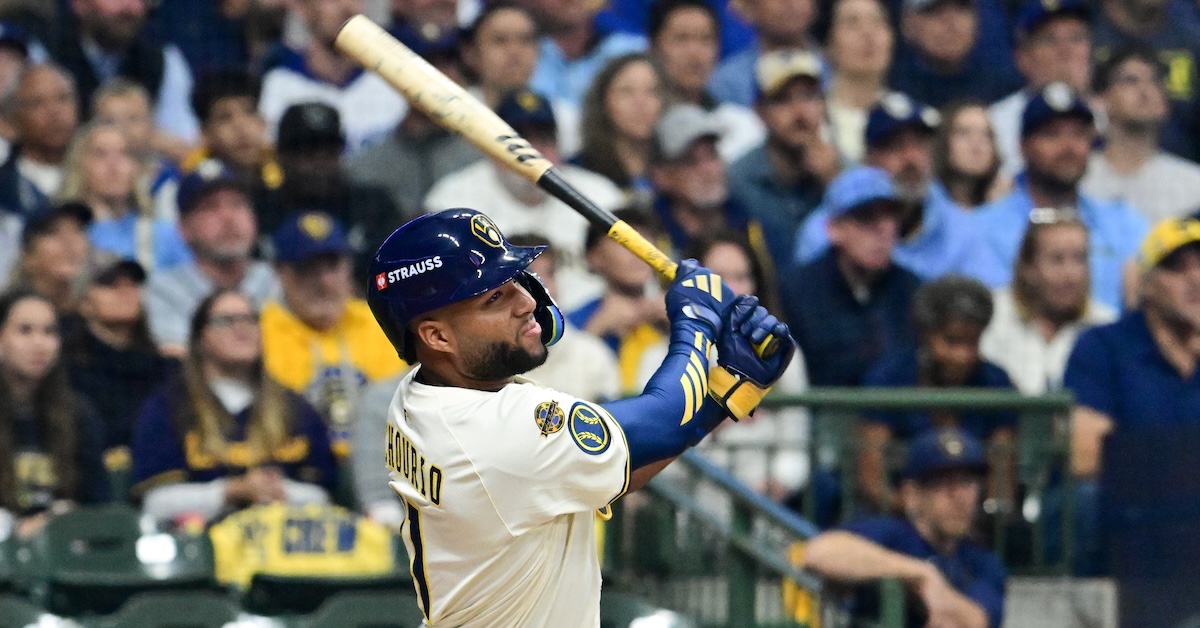
I have a confession to make. I started this article with a conclusion in mind, only to find that that conclusion was spectacularly untrue. But then I pivoted, and found something else I think is quite interesting. Is it obvious, in retrospect? I kind of think so. But I had fun doing it and learned something in the process, so I decided to write about it anyway.
I had a theory that the average catcher age, along with the average age for all the hardest defensive positions, had plummeted over the past decade, with the average DH age increasing as a counterbalance. My theory was that the universal DH allowed teams to massively alter their behavior. National League teams that had been playing older sluggers in the field could shift them down the defensive spectrum, either directly to DH or by displacing other old players to DH via a chain reaction of moving to easier defensive spots.
It’s beautiful logic, with just one problem: It’s untrue. Here’s the average seasonal age (as of July 1 each year) of catchers, shortstops, and DHs since 2002, the first year we have positional splits that allowed me to run this analysis:
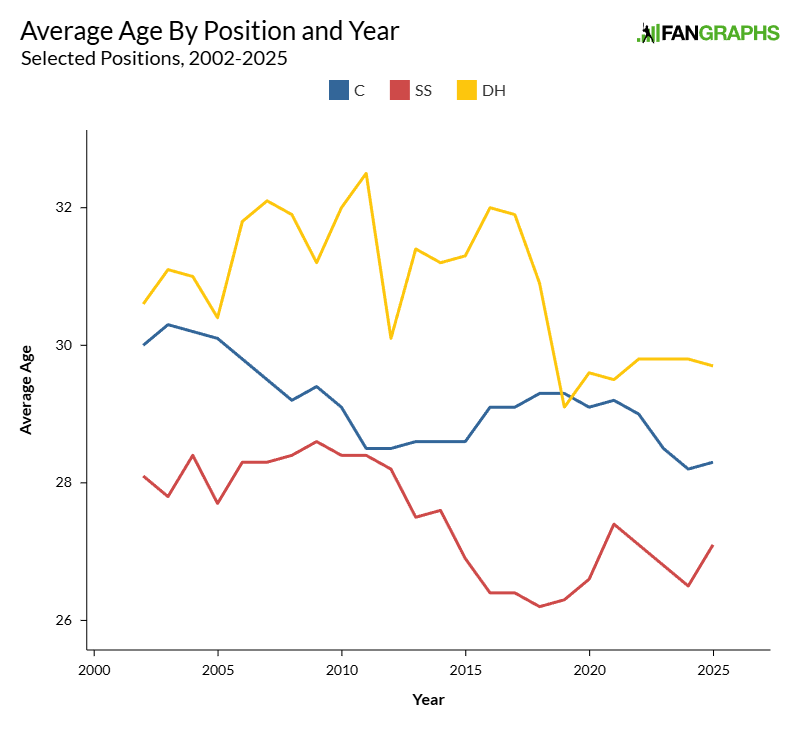
The data is pretty noisy, which makes sense to me. It’s not like teams are targeting a given age; they’re just making baseball decisions about cost, team control, and production. Average age is a downstream result of a lot of decisions that are made for other reasons. But in the aggregate, the pattern I hoped to see just wasn’t there:
Average Age By Era, Position
| Period | C | SS | DH |
|---|---|---|---|
| 2002-2010 | 29.7 | 28.0 | 31.4 |
| 2011-2020 | 28.9 | 27.1 | 31.0 |
| 2021-2025 | 28.7 | 26.7 | 29.7 |
| 2002-10 vs. 2021-25 | -1.1 | -1.3 | -1.6 |
In fact, DH has experienced the greatest decline in average age across all positions. That’s very much not what I expected. I do think that some of that is overstated. First base has had the smallest decline among positions, and I’d expect many of the displaced older hitters I mentioned in my hypothesis to end up there too. But if you average the age changes of first base and DH, they’re almost exactly the league average for position players. Clearly, the data do not support my claim. Read the rest of this entry »
Job Posting: Rice University – Professor in the Practice of Sport Analytics
Rice University – Professor in the Practice of Sport Analytics
Location: Houston, Texas
Description
The Department of Sport Management at Rice University in Houston, Texas, seeks applicants for a full-time (9-month) Professor in the Practice position to further expand the department’s Sport Analytics major. This non-tenure track position has a start date of July 1, 2026.
The primary focus of this position will be the field of sport analytics – both the performance side and the business side. Candidates should be proficient in statistics and data science including modeling, statistical learning, and statistical computing such as R, Python, Tableau, SQL, Excel, or other comparable computational and data scraping platforms. The Professor in the Practice will teach three courses each semester.
Rice University is a private, comprehensive research university located in the heart of Houston’s dynamic Museum District. It offers undergraduate and graduate degrees across eight schools and has a student body of approximately 4,800 undergraduate and 4,100 graduate students. Every year since 1988, Rice has been ranked among the top 20 national universities (US News & World Report). During each of the past seven years, the Department of Sport Management was ranked #1 in “Best Colleges for Sports Management in America” by Niche. For information about the Department of Sport Management and the Sport Analytics major, visit www.sport.rice.edu.
Houston offers abundant opportunities to interact with our numerous sport organizations including seven professional teams (NBA, MLB, NFL, NWSL, MLS, LOVB, UFL). Houston is also home to the PGA’s Houston Open, LPGA’s Chevron Championship, the Insperity Invitational, the U.S. Clay Court Championships, the Texas Bowl, Rodeo Houston, and the Houston Marathon. Since 2004, Houston has twice hosted the Super Bowl as well as the NCAA Final Four three times, Copa América Centenario, the Gold Cup, the MLB All-Star Game, the NBA All-Star Game, the World Series, and the 2024 College Football Playoff Championship Game. Seven matches of the 2026 World Cup will be played in Houston.
Qualification:
Candidates must have a minimum of a Master’s degree in either Statistics, Mathematics, Computer Science, Data Science, Sport Management, Economics, or another related field by the date employment commences.
Application Instructions:
Candidates must complete applications through Interfolio, the hiring system for Rice University.
In addition to the application, the following documents are required: (1) cover letter, (2) curriculum vitae, (3) unofficial transcripts, (4) teaching philosophy statement, (5) contact information for at least three references (the references will be contacted and asked to provide a letter of recommendation only after the applicant advances beyond the initial screening by the search committee).
We welcome the fullness of diversity to Rice. Qualified applicants are considered without regard to race, color, religion, age, sex, sexual orientation, gender identity, national or ethnic origin, genetic information, disability, or protected veteran status. Also, in our candidate pools, we seek to attract greater representation of women, scholars of color, people with disabilities, veterans, and others who have historically been underrepresented; attract students from a wide range of countries and backgrounds; accelerate progress in building a faculty and staff varied in background and thought; and maintain an environment that fosters interaction and understanding within our community.
The search committee will begin reviewing applications January 12, 2026 and will continue until the position is filled.
To Apply
To apply, please follow this link.
The content in this posting was created and provided solely by Rice University.