Sunday wasn’t Charlie Morton’s best night, though it was hardly his worst. Fresh off the announcement of a contract extension for next season, and with nothing less than the Braves’ full control of their own destiny in the NL East race on the line against the Mets, the 38-year-old righty bent but didn’t break before manager Brian Snitker pulled him with a 4–3 lead and one out in the fifth inning. His performance was still better than opposite number Chris Bassitt, who was chased in the third inning. And for the third straight night, the Braves got home runs from both Dansby Swanson and Matt Olson and a save from Kenley Jansen. Their magic number to clinch the division and the NL’s second seed is down to one.
With victories over Jacob deGrom on Friday and Max Scherzer on Saturday, the Braves had taken a one-game lead in the NL East race — their largest of the season — and evened the season series with the Mets at nine games apiece. A victory on Sunday night meant that they would possess not only a two-game lead with three games left to play but also the upper hand in a tiebreaker scenario via their 10–9 record in head-to-head games. Under the new postseason format, so long as they do anything but lose all three of their remaining games against the Marlins in Miami along with the Mets winning their three against the Nationals at home, the Braves would get a first-round bye and face the winner of the best-of-three Wild Card series between the Cardinals and the sixth seed (currently the Phillies, who have a magic number of one over the Brewers). The fourth-seeded Mets would face the fifth-seeded Padres, with the winner moving on to face the top-seeded Dodgers in the Division Series.
So there was a lot riding on Sunday’s contest, to say the least. As a 15-year veteran who’s pitched for teams that have been to the playoffs in eight of the past nine seasons (plus this one) and who has appeared in three of the past five World Series (most notably closing out Game 7 for the 2017 Astros), Morton is no stranger to big games. It appears that he has more in store, not only because the Braves are playoff-bound but also because on Saturday they announced a one-year, $20 million extension with the righty, with a $20 million club option (and no buyout) for 2024. It’s essentially a rollover of Morton’s previous deal, in that he’s making $20 million this year and had a club option for $20 million next year. Read the rest of this entry »
The top nine pitchers by WAR since 2012 have a combined 54 All-Star Game appearances, 13 Cy Young Awards, and two MVP Awards in their careers. Most of them, including Max Scherzer, Clayton Kershaw, Gerrit Cole, Zack Greinke, and Stephen Strasburg, have signed nine-figure contracts that earn each of them over $30 million annually. Then, at number 10, there’s the ever underrated one-time All-Star José Quintana, just ahead of Yu Darvish and David Price:
Quintana, 33, has accumulated 32.7 WAR over an 11-season career that looks wildly different from those of his peers on this list. He started with the White Sox from 2012-17, signing a $21 million extension in 2014 and posting a 3.51 ERA in over 1,000 innings. In 2017, the Cubs took an interest, parting with their top two prospects, Eloy Jiménez and Dylan Cease, and two others to get Quintana’s talents to the North Side.
From there, he wavered. His fastball velocity declined year to year from 2016 to ’20, and while he was still capable of making 30 starts each season, he wasn’t able to get outs as effectively. In his contract year in 2020, COVID-19 and two stints on the IL limited Quintana to just one start and three relief outings. His struggles would continue in 2021, when attempts to catch on with the Angels and Giants resulted in a pair of DFAs. Read the rest of this entry »
I once spent what felt like a lifetime arguing with a colleague who hated the German soccer player Mesut Özil and would not be moved no matter what statistical evidence, stunning highlights, or expert analysis he consumed. For years, my friend insisted Özil was trash, and for years he was wrong.
Then, Özil finally lost a step, fell out with his coach, and got benched. Rather than admit circumstances had changed, my friend claimed victory, as if he’d prophesied the truth instead of stumbling into it after the fact. Which I’m totally fine with, by the way, and in no way still so pissed about that I’m bringing it up for an audience that likely knows or cares little about semi-retired European soccer playmakers and even less about my onetime debate partner. No, sir. Anyway, this experience taught me an important lesson about sports takemanship: If you hold on to an opinion long enough, even in the face of overwhelming evidence, sometimes the mountain comes to Mohammed.
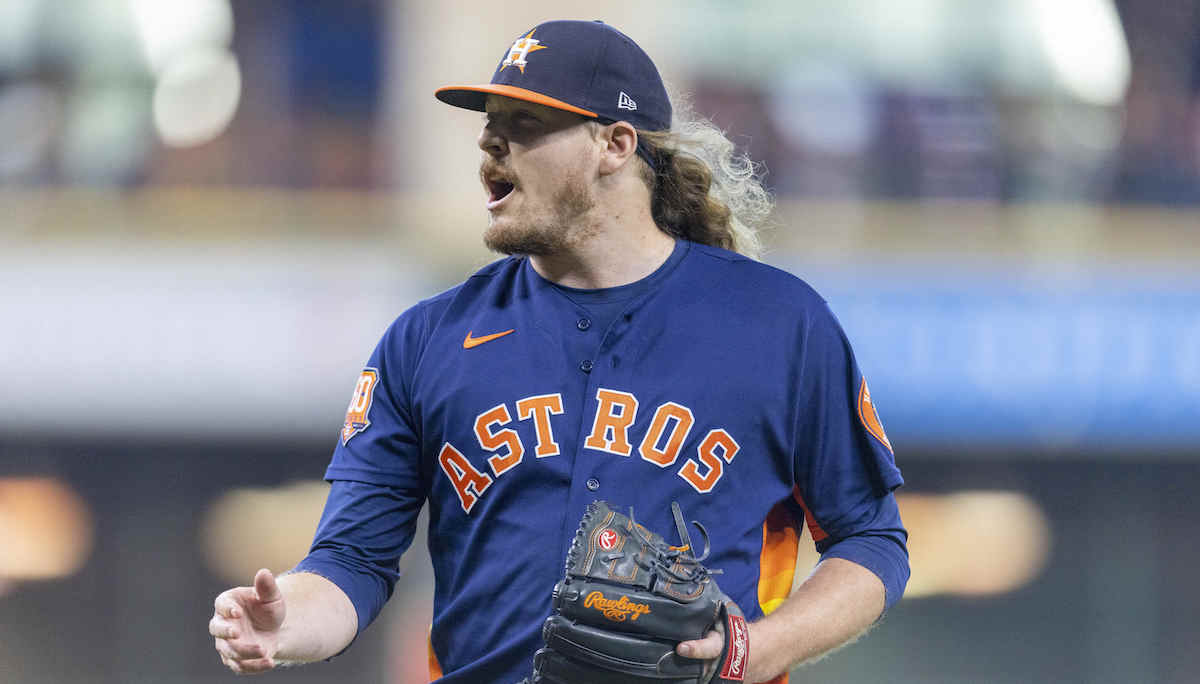
In that spirit, I’m declaring that I was right about Ryne Stanek all along. Back in 2012, I was a huge Stanek fan. In his days at the University of Arkansas, he was one of the top candidates to go first overall in the 2013 draft. I saw his fastball velocity and wipeout slider and imagined him as a future no. 1 starter. And when Stanek continued to worry scouts his junior year — he fell all the way to no. 29 in the draft, despite posting a 1.39 ERA as a starter in the SEC — I was unmoved. Stanek would come good, I insisted.
For nine years, I kept the faith. Through injuries, through command problems, through a move to the bullpen. When Stanek finally started a handful of major league games, it was as an opener, the Blaster to Jalen Beeks’s Master. He was effective in short bursts, but a trade to the Marlins in mid-2019 and a month-long bout with COVID in 2020 brought his career to the brink of dissolution.
Suffice it to say, things have changed. Last year, Stanek became a key part of the Astros’ bullpen, appearing in 13 of Houston’s 16 playoff games, holding batters to a .139/.184/.333 line, and posting a positive WPA in the first 12 of those outings. This year, well, here’s a list of the top reliever ERAs in baseball this season:
It took nine years, but Stanek is finally as dominant as he was at Arkansas. A 1.17 ERA in 58 appearances for the top seed in the American League might not be a 200-inning Cy Young season, but it’s close enough that I can claim to have triumphed in the marketplace of ideas.
Many of these names above will be familiar to you from a piece Ben Clemens wrote last week about how the top relievers in baseball are especially dominant. Among the players he mentioned are the ones you’ll remember in several years’ time: Helsley chucking the rock at 104 mph, Díaz storming in to trumpet fanfare like a Roman consul, Clase cuttering through opponents like Mariano Rivera, plus six ticks. But Stanek, who’s second among relievers in ERA, didn’t merit a mention. As if he’s not actually elite.
The Astros don’t seem to think so either, or at least they’re not using him that way. Among the six Astros relievers with at least 40 innings pitched, Stanek is only fourth in gmLI, at 1.22, which places him in the range of important middle relievers, but hardly a high-leverage fireman or closer. Some of that is down to Houston having a loaded bullpen: in addition to closer Ryan Pressly, the Astros have invested significant resources in the past 18 months to sign or trade for Héctor Neris, Will Smith, Phil Maton, and Rafael Montero. They’ve all pitched well, as has Bryan Abreu. And Houston’s surfeit of rotation arms will bolster the bullpen in the playoffs — Justin Verlanderacolyte Hunter Brown has already moved over, and one or both of José Urquidy and Luis Garcia is likely to join him there as October rolls on.
The other reason Stanek’s exceptional run prevention season is going unnoticed is that it’s most remarkable in one specific way: The sheer number of fluky season red flags he’s managed to hit. In an era when the best relievers are striking out tons of batters and walking no one, Stanek is a throwback to the Matt Mantei–Armando Benitez-type relief ace who gets outs but walks so many guys you end up watching his appearances through your fingers. I’m not complaining — everything that was cool when I was a middle schooler is coming back into style, it seems. Just today I saw a TikTok about how to make your hair look like Shawn’s from Boy Meets World. But I digress. Let’s take a look at some of Stanek’s stats:
Ryne Stanek’s Rank in Key Fluke Indicators, Part 1
Category
Value
Rank*
BABIP
.266
69th
LOB%
91.6
3rd
HR/FB%
4.0
12th
ERA-FIP
-1.84
3rd
*Out of 198 relievers with at least 40 IP. Through Saturday
The Statcast-derived metrics are no more flattering:
Ryne Stanek’s Rank in Key Fluke Indicators, Part 2
Category
Value
Rank*
SLG-xSLG
-.050
20th
wOBA-xwOBA
-.020
55th
ERA-xERA
-2.02
2nd
SOURCE: Baseball Savant
*Out of 360 pitchers with at least 1.25 BF per team game. Through Saturday
Calling Stanek’s season fluky feels unkind, and it’s certainly not my intention to denigrate the fine work he’s done this year. The F-word is usually tagged to players whose superficial stats look good but are actually bad. Stanek, based on the underlying numbers, is a good reliever whose ERA makes him look like Dennis Eckersley.
What is he, then? Well, basically the same pitcher he was last year: A good middle reliever with an above-average strikeout rate and a slightly concerning walk rate. He’s much less homer-prone this year, but that’s about it. His improved LOB% and inherited runner strand rate (up to 41% from 19% in 2021) come despite very similar performance with runners on base (.257 opponent wOBA in 2021, .267 this year). But it bears repeating that he was a workhorse in the playoffs for an Astros team that nearly won the title, and with the LDS and LCS both losing an off day, more of this postseason than ever will be decided by teams’ fourth- and fifth-best relievers.
Players like Stanek, in other words. As much as the Astros need star performances from Verlander, Pressly, and so on, they need their entire pitching staff to show up. Lucky for them, for the seventh and eighth innings they have an ace, just as I predicted all those years ago.
Riley Greene was 18 years old and only three months removed from being drafted fifth-overall when he was first featured here at FanGraphs in September 2019. Harking back to our earlier conversation, I asked the Detroit Tigers rookie outfielder what he knows now that he didn’t know then.
“When I first started, I didn’t really think about much,”replied Greene, who celebrated his 22nd birthday four days ago. “I kind of just went up there, and was free-swinging almost. I was a young kid who didn’t really know anything. Since then, I’ve come up with a routine and am more educated on what I need to do at the plate. I have a plan. Whether it works or not is up the baseball gods.”
The extent to which the baseball gods have been on his side is relative. Greene isn’t exactly setting the world on fire — he has a 100 wRC+ and five home runs in 400 plate appearances — but again, he’s been old enough to take a legal drink for barely over a year. He also came into the season with just 198 professional games under his belt, only 55 at the Triple-A level. His potential far exceeds his present.
In some respects, Greene is much the same player Detroit drafted in the first round out of Oviedo, Florida’s Paul J. Hagerty High School. Read the rest of this entry »
Picking up where I left off from Thursday’s installment, while starting pitchers born in the 1960s are better represented in the Hall of Fame than those born in the ’50s or ’70s — but still far below levels from earlier decades — the period produced a handful of standouts who aren’t in. Some are outside because they didn’t have longevity in their favor due to injuries and other interruptions. They all went one-and-done on BBWAA ballots because they were far short of 300 wins at a time when the writers were only electing such pitchers. “Traditional” JAWS didn’t favor them either, but some of them look like much stronger candidates via S-JAWS, most notably the pair featured here, Kevin Brown and David Cone.
From the previous piece, here’s how they stand among the pitchers born in the Sixties:
Very few things have gone according to plan in Kansas City this season. Yes, Bobby Witt Jr. made his major league debut alongside a number of other promising young position players, but the team is still on track to lose 97 games, their sixth consecutive losing season. After investing in a number of free agents prior to the 2021 season and taking a few small steps forward, the franchise has taken one giant leap backwards this year.
Their inability to break out of a rebuilding cycle that began after their 2015 World Series victory led to the dismissal of president of baseball operations Dayton Moore earlier this month. After guiding the franchise for 16 years, the Royals decided new leadership was required to push the team back into relevance. While Moore was sometimes ridiculed for his adherence to old school methods of roster construction and strategy, his track record should speak for itself. After taking the helm in 2006, he slowly rebuilt the entire organization, culminating in their championship season. Unfortunately, that success was short lived and the team slipped into another rebuilding cycle soon afterwards. Read the rest of this entry »
Max Muncy is having a slightly better-than-league average offensive season. That’s not at all unusual, as Muncy has been an offensive force ever since he joined the Dodgers in 2018. But remember, way back in the olden days of early spring, when he looked disturbingly lost? An elbow injury suffered last year had knocked his mechanics all out of whack, and pitches he’d usually line off the wall were getting popped up or beaten into the ground. Nothing worked. It’s not just that he hit .164 in the first half of the season; he hit under .200 in each of the first four months of the season individually.
It’s kind of remarkable that the Dodgers let him play through this funk; he wasn’t in the lineup every day, but he played 73 games and batted 297 times in the first half. That’s a lot of rope. Usually, in order to get that much playing time with a sub-.200 average, a player needs to be either a premium defender at an up-the-middle position or a Pittsburgh Pirate. But the Dodgers have been tolerant of struggling stars in recent years. Cody Bellinger, for instance, is still a regular despite having been stricken blind sometime in 2020. Read the rest of this entry »
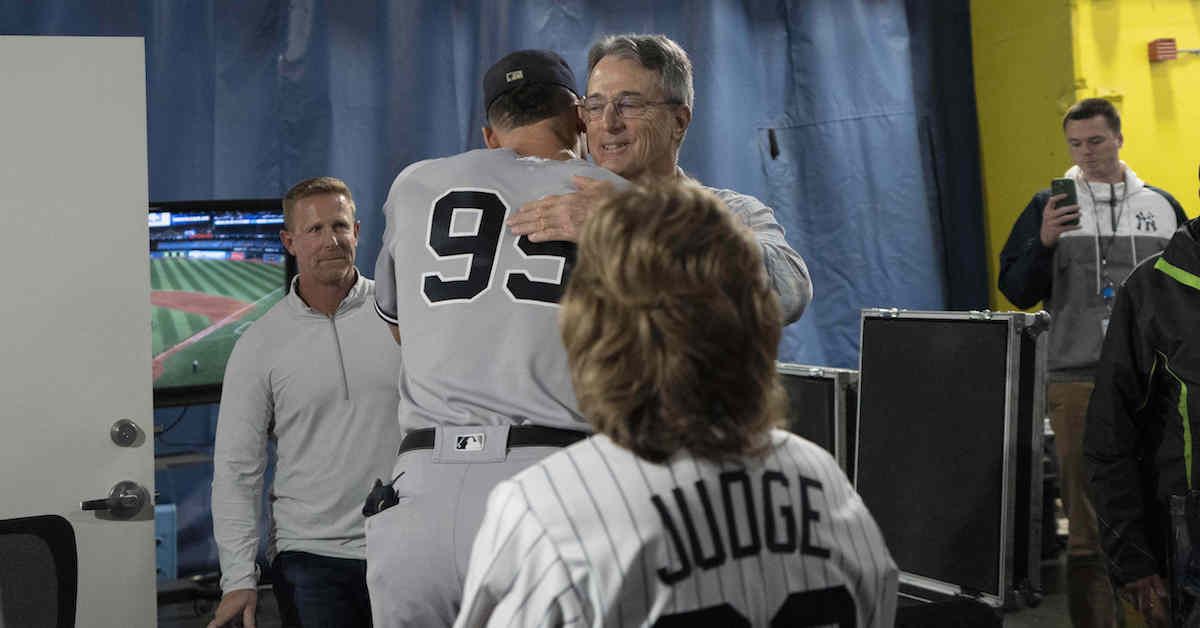
While it is bittersweet to see anyone tie my father’s single-season American League home run record, it’s an honor to know that he shares it with a player as talented and as gracious as Aaron Judge. Aaron plays with passion, puts the team first, and wears Yankee pinstripes. In all of these ways, he is a true successor to Roger Maris. On behalf of the entire Maris family, I would like to offer my sincere and heartfelt congratulations to Aaron Judge.
I would also like to take this opportunity to ask a question: Does this mean I can go home now?
I can go now, right? Please let me go home. It has been so long. I have a cat. I am worried about him. It has been eight days and I need to check on Professor Whiskers. Read the rest of this entry »