
Ben Clemens FanGraphs Chat – 9/26/22
by Ben Clemens


September 26, 2022
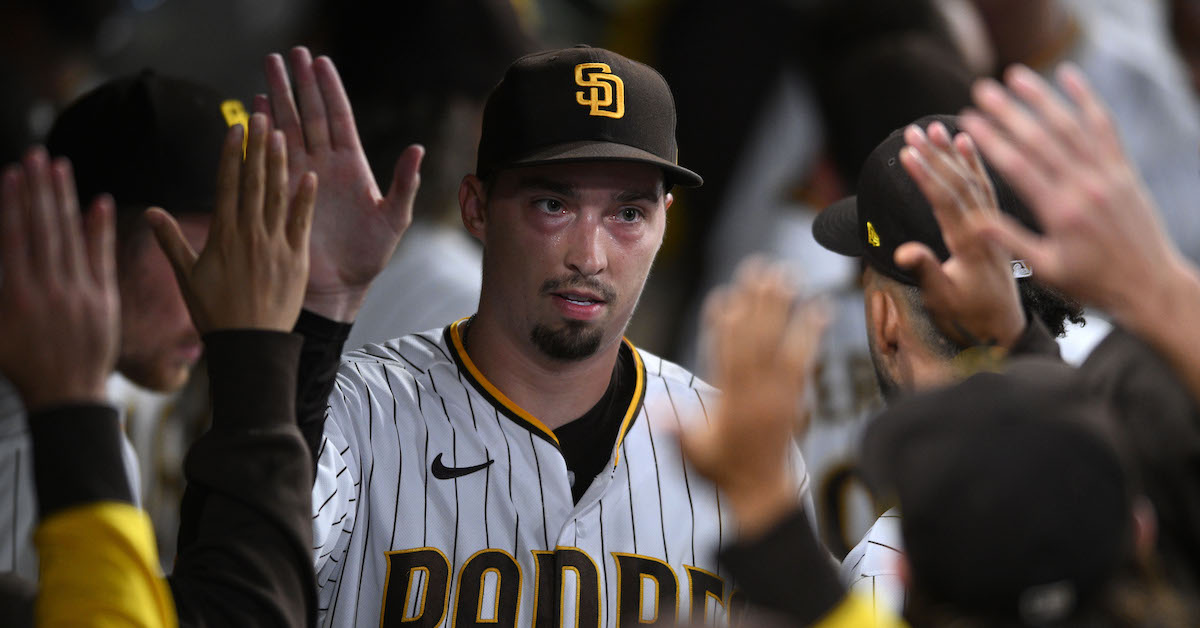
Blake Snell had to have seen 2022 as an opportunity for a bounce-back. After infamously being pulled by Rays manager Kevin Cash with a one-run lead in the sixth inning of a decisive Game 6 of the 2020 World Series, the lefty was dealt to the Padres in a blockbuster that December. He struggled to find his groove in San Diego in 2021, battling through an inconsistent season for a disappointing Padres team and finishing with a 4.20 ERA, a 3.82 FIP, and a 3.74 xFIP. He must have been eager to put his middling Padres debut behind him when he prepared for his first start of 2022 on April 10, but he was scratched during his pregame bullpen session, hitting the injured list and making way for then-Padres prospect (and current Washington National) MacKenzie Gore to make his major league debut.
No, the comeback would have to wait. Snell would have to endure rehab starts in Fort Wayne, Indiana, then Lake Elsinore, California, and then El Paso, Texas before rejoining the team on May 18 in Philadelphia. He would have to suffer eight team losses in his first eight starts, during which he posted a 5.13 ERA, 3.71 FIP, and 4.04 xFIP and finished the sixth inning just twice. And in his final start before the All-Star Break on July 14 in Colorado, Snell walked six and allowed five runs over 3.2 innings. He walked his final three batters of the first half, forcing in two runs.
But you wouldn’t have known any of that last Wednesday night, when Snell took a no-hitter into the seventh inning at Petco Park against the Cardinals, one of the league’s most potent offenses, finishing the night with a career-high-tying 13 strikeouts over 7.0 scoreless innings. The performance was the crown jewel of a second half during which Snell has pitched himself back into the conversation as one of the league’s most dominant lefties – and one of San Diego’s October X factors. Read the rest of this entry »

This week, as the playoff picture becomes clearer and the best teams continue to jockey for seeding, we have another abbreviated power rankings. The only real drama over the next week and a half will come from the two Wild Card races and the battle over the NL East. These rankings will return for a special playoff edition once the field is set.
A reminder for how these rankings are calculated: first, we take the three most important components of a team — their offense (wRC+), and their starting rotation and bullpen (a 50/50 blend of FIP- and RA9-, weighted by IP share) — and combine them to create an overall team quality metric. New for this year, I’ve opted to include defense as a component, though it’s weighted less heavily than offense and pitching. Some element of team defense is captured by RA9-, but now that FanGraphs has Statcast’s OAA/RAA available on our leaderboards, I’ve chosen to include that as the defensive component for each team. I also add in a factor for “luck,” adjusting a team’s win percentage based on expected win-loss record. The result is a power ranking, which is then presented in tiers below. Read the rest of this entry »

Back in June, Ben Clemens noticed that Braves reliever A.J. Minter had taken a big developmental step, specifically by cutting his walk rate basically in half from 2021. Through some statistical trial-and-error, Ben discovered that Minter had revamped his approach after falling behind in the count, pitching in and around the zone almost exclusively in two- and three-ball counts:
“All he did was make one adjustment — before he ever got to a 3–0 or 3–1 count, he’d dial in and throw something competitive — and presto, walks were gone overnight.”
Three and a half months later, Minter’s walk rate has bumped up a little, but only to 5.2%. That’s still a fraction of his previous career low, 8.5%, and even more impressive given his 34.9% strikeout rate. There are other pieces to what makes a good reliever, like preventing home runs (Minter has allowed only four in 65 innings this year) and limiting hard contact, but based just on those strikeout and walk rates, one would assume that Minter has been one of the best relievers in baseball this season. Read the rest of this entry »
Back in the 1950s, Hall of Fame slugger Ralph Kiner famously said that “singles hitters drive Fords and home run hitters drive Cadillacs.” Michael Massey’s grandmother may or may not have been familiar with the quote, but she did her best to send the 24-year-old Kansas City Royals rookie down the right road. I learned as much when I asked Massey about his first big-league blast, which came on August 18 against the Tampa Bay Rays at Tropicana Field.
“What I thought of when I hit it was my nana,” said Massey, who grew up in the Chicago area and went on to play his college ball at the University of Illinois. “She passed away toward the end of last season — she was 93 — and growing up she’d always give me a hundred bucks for every home run I hit. She loved it when I hit home runs, and did that for every league I played in.”
Massey has never tallied up his earnings from over the years, although he does acknowledge that the benevolence was bountiful. Along with his homers in youth leagues, high school, and college, he left the yard 21 times in High-A last year.
His grandmother — his mother’s mother — escaped Illinois winters by vacationing in Florida, and eventually became a snowbird. That the Sunshine State became her “favorite place in the world” made Massey’s first MLB home run even more special. And the memories include much more than money. The family matriarch regularly played whiffle ball with him when he was growing up, and she wasn’t just a fan of her grandson. She loved baseball. Read the rest of this entry »

Ben Lindbergh and Meg Rowley banter about the man who tried to return Roger Maris’s 61st home run ball, two Mickey Mantle letters, the 2017 Zac Gallen/Sandy Alcantara trade, how Maury Wills changed (and dominated) basestealing, and Aaron Judge’s recent value even when he hasn’t hit homers, then answer listener emails (38:15) about hitters setting their own strike zones, Atlanta’s extreme day/night winning percentage split, the shift ban and the Stanky rule, which pitchers will suffer from the new pickoff-attempt rules, and immaculate innings that include an automatic strike from the pitch clock (with a digression into “timer” vs. “clock”), followed by a research-intensive Stat Blast (1:05:53) into whether working quickly improves the defense behind a pitcher, and a double Past Blast (1:27:58) from 1907, including an ahead-of-its-time proposal by the eccentric Bob Unglaub.
Audio intro: Styx, “Havin’ a Ball”
Audio outro: Drive-By Truckers, “Bob”
Link to 2022 article about Durante
Link to 2016 article about Durante
Link to offer for Judge ball
Link to article about Judge ball value
Link to other article about Judge ball
Link to 1961 Mantle letter
Link to 1973 Mantle letter
Link to BP on Gallen
Link to article about 2017 trade
Link to Jeff on the 2017 trade
Link to Wills SABR bio
Link to Wills obit
Link to Pages From Baseball’s Past
Link to Craig Wright on SBs
Link to Wright on Wills
Link to 1960–65 SB leaders
Link to 1962 NL MVP voting
Link to video of Judge near-homer
Link to Defector on the Judge flyout
Link to Defector on walking Judge
Link to EW emails database
Link to Stathead on Atlanta’s split
Link to EW Stanky draft
Link to Stanky maneuver story
Link to Stanky maneuver image
Link to Russell on the running game
Link to list of immaculate innings
Link to Stathead
Link to Savant pitch tempo page
Link to Savant defense behind pitcher
Link to Savant team defense
Link to Mike Fast on pace and defense
Link to Ben on pace and defense in 2017
Link to pace and defense Stat Blast data
Link to 1907 Cubs story source
Link to list of in-season exhibitions
Link to SABR baseball cards site
Link to SABR baseball cards tweet
Link to Unglaub’s 1907 arc idea
Link to article on eccentric Unglaub
Link to article on Unglaub not playing
Link to Unglaub SABR bio
Link to Rob Arthur on deeper defense
Link to Rob on better defense
Link to Jacob Pomrenke’s website
Link to Jacob Pomrenke on Twitter
Link to DraftKings ad
![]() Sponsor Us on Patreon
Sponsor Us on Patreon
![]() Subscribe to Stathead (Code: WILD20)
Subscribe to Stathead (Code: WILD20)
![]() Facebook Group
Facebook Group
![]() Twitter Account
Twitter Account
![]() EW Subreddit
EW Subreddit
![]() Effectively Wild Wiki
Effectively Wild Wiki
![]() iTunes Feed (Please rate and review us!)
iTunes Feed (Please rate and review us!)
![]() Get Our Merch!
Get Our Merch!
![]() Email Us: podcast@fangraphs.com
Email Us: podcast@fangraphs.com
Podcast (effectively-wild): Play in new window | Download
Subscribe: RSS

Once upon a time, mid-September brought my annual check-in on the potential for end-of-season chaos in the playoff races via my Team Entropy series. With the new Collective Bargaining Agreement and the restructured postseason, however, Major League Baseball has done away with tiebreaker games and the scheduling mayhem that they could cause in favor of greed a larger inventory of playoff games. Along with the expansion of the playoff field from 10 teams to 12 and the Wild Card round from a pair of winner-take-all games to a quartet of three-game series, MLB did away with all winner-take-all regular season tiebreaker games. In the name of efficiency, we have no more Game 163s. Instead, ties will be decided by the excitement of… mathematics. Boooooooo!
The untangling of the often-complex scenarios by which those tiebreakers could come about was Team Entropy’s raison d’etre, though we were able to make do in 2020, when in the name of minimizing travel and keeping the schedule compact to accommodate an expanded field, MLB similarly opted to dispense with the on-field tiebreakers. That wasn’t nearly as much fun, but at the very least, it feels appropriate to sketch out what’s at stake while pouring one out in memory of what’s been lost.
As you’re probably aware by now, each league’s playoff field will consist of six teams, namely all three division winners plus three Wild Cards with the best records from among the remaining teams. The top two division winners by record get first-round byes, while the third division winner (no. 3 seed) plays host for all three games against the third-best Wild Card team (no. 6 seed) and the top Wild Card team (no. 4 seed) hosts all three games against the second-best Wild Card team (no. 5 seed). Read the rest of this entry »
Baseball teams are like most entities operating with finite resources: If you want to know what they value, look where those resources get spent. The Toronto Blue Jays clearly value starting pitching. They spent $80 million over four years on Hyun Jin Ryu, two top prospects plus a seven-year, $131 million extension on José Berríos, $110 million over five years on Kevin Gausman, and $36 million over three years on Yusei Kikuchi.
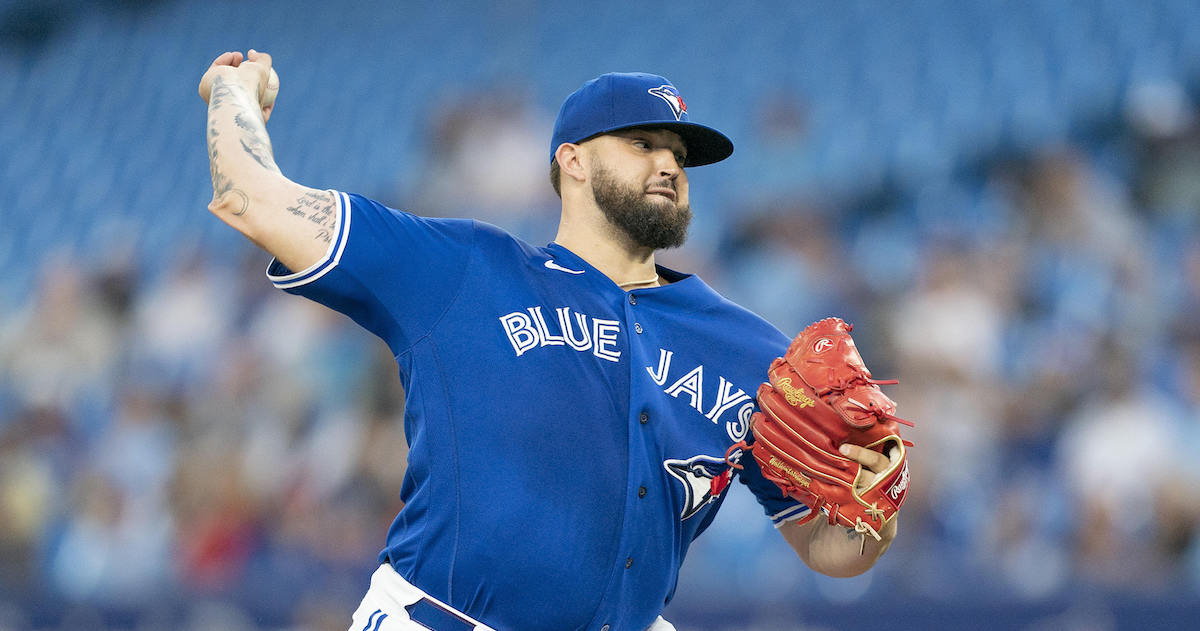
Gausman has been as good as advertised this year, but behind him, the Blue Jays’ most important pitcher hasn’t been one of their big-money acquisitions, but Alek Manoah, a 24-year-old on a pre-arbitration contract. And he’s not even the 6-foot-6 Floridian most people expected to become Toronto’s homegrown frontline starter. In 2017, the Blue Jays spent a first-round pick on Nate Pearson, he of the 102 mph fastball and slider that touched 95. Pearson tickled the top 10 of the global prospect rankings in 2020, while Manoah — despite being a first-rounder himself — worked in relative obscurity.
Pearson’s career has stalled, thanks to an array of setbacks that would be at home in the Book of Job, ranging from a sports hernia to mononucleosis. And into that niche has stepped Manoah, who possesses less eye-popping stuff but the finesse and durability of which frontline starters are made.
Manoah is in the top 15 among qualified starters in innings, ERA, strikeouts, and WAR, but his pitching approach belies his youth. He throws reasonably hard — though an average fastball velocity of 93.9 mph is nothing to write home about in this day and age — but this year his ERA has gone down by eight tenths of a run while his strikeout rate has fallen by five percentage points. That’s because he’s allowing less hard contact than any other qualified starter in the game.
The key to Manoah’s success is the combination of his four-seamer and his sinker, two pitches that resemble each other closely in velocity and flight path until diverging wildly in late break. That combination doesn’t always result in a swing and miss, but it’s exceptionally hard for a hitter to square up, making it the baseball equivalent of putting your palm on your little brother’s forehead and straightening your arm so he can’t hit you back.
“I think the biggest thing I like to do is watch hitters’ approaches, watch their swing path, watch the way they swing, the way they take pitches, and see certain pitches they’re looking for,” Manoah said. “For me that will dictate whether I’m going sinker or four-seam or how I want to set it up.”
Of course, Manoah didn’t invent this strategy; numerous pitchers have used it to great effect, even during the height of the four-seamer-heavy, swing-and-miss tulip fever that gripped baseball at the end of the past decade. In fact, several of those pitchers have worked for Toronto in recent years, specifically Ryu and Berríos, whom Baseball Savant lists as one of the most similar pitchers in the league to Manoah in terms of velocity and movement.
Manoah’s taken the opportunity to learn as much as he can from his older teammates.
“[Ryu’s] pitch design might not be the same, but the way he gets into his legs and his mechanics and his rhythm are very similar to mine,” Manoah said. “For Berríos, it’s really the way he sets up his sinker and his changeup. For me, I wasn’t really much of a changeup guy, but I’ve been able to watch him, and he’s not worried about certain movements — as long as he’s tunneling it off the sinker, he can use them together.” He also mentioned Ray, Gausman, and David Phelps as players he’d picked up lessons from during his time in the majors.
Manoah has had to be a quick learner, because as much as it seems like he just burst onto the scene as a rookie last year, his rise is even more meteoric than you’d think. Despite his physical gifts, he was undrafted out of high school, and in three years at West Virginia, he spent only one as a full-time starter. After being drafted 11th overall in 2019, he spent all of 2020 pitching at Toronto’s alternate site.
“I feel like we had a pretty good simulated season,” he said of the alternate site camp. “Still training, still long tossing, still facing live hitters. There was a sense of motivation because it was that time when people were going to know who was working and who wasn’t. I didn’t have to focus on the results because there were no results. Being able to work on my changeup, my body, my work ethic, and routine without having to worry about results — I think it allowed me to enjoy that process and be ready for spring training.”
So Manoah went into the big league rotation in May of 2021 after just nine minor league appearances ever, at any level, and just two seasons of more than 80 total innings. And he was immediately one of Toronto’s best pitchers, striking out more than a batter an inning and posting a 3.22 ERA in 111 2/3 innings over 20 starts.
“I think every step of my journey has been preparing me for this,” Manoah said.
Now, despite his youth, Manoah is one of the most essential players on a team that’s a near-lock to make the postseason. He made his first All-Star team in July, and his inning while mic’d up made him one of the game’s breakout stars. When a Montreal radio host made insensitive comments about Alejandro Kirk last week, it was Manoah who jumped to defend his catcher. He’s a veteran, in every respect but age.
And now, one of the big questions facing Toronto interim manager John Schneider is how hard to ride Manoah down the stretch. On the one hand, home-field advantage in the first round could be huge for Toronto, but on the other, the young righty is now some 54 innings past his previous career high with two weeks, plus the postseason, left on the calendar. Manoah is currently 16 1/3 innings from 200, a milestone he views as important because reaching it is evidence of a good work ethic, but he’s happy to pitch or sit if asked.
“I literally told them I don’t want to be the one to make that decision,” he said with a chuckle. He’s simply pleased to be pitching so well that the Blue Jays are scheduling their playoff rotation with him in mind.
“Last year, I got moved because we wanted to set up Robbie Ray and our horses,” he said. “I remember telling myself I want to be one of the guys they’re setting up for big games. Now that we’re there, it’s pretty cool.”

This is Davy’s first piece as a FanGraphs contributor. Davy is a writer and musician who lives in Brooklyn. He has previously written for Baseball Prospectus, where he contributed to the Too Far From Town series about the contraction of the minors. He bakes fancy cakes and plays guitar for The Subway Ghosts, a punk rock band whose other members are also baseball writers. Davy grew up in Falls Church, Virginia, and his earliest ballpark memory is of boos raining down on Glenn Davis at Memorial Stadium.
Carlos Correa picked a great time to turn things around. The 28-year-old is widely expected to opt out of his three-year contract with the Twins this winter, and he’s primed to hit the free agent market on an absolute tear. Correa is slashing .377/.438/.663 in September, good for a 216 wRC+. That’s the sixth-best mark in all of baseball and second among shortstops, behind only the red hot Bo Bichette.
Like Bichette, Correa faced a rough time earlier in the season. Where did things go wrong for the future former Twin? It’s time for some fun with 15-day rolling averages! Read the rest of this entry »

Tuesday night, the White Sox and Guardians played to a standstill over the first eight innings of a game that would help decide the fate of the American League Central. Of course, getting late into the game with a chance to win suits both teams just fine. The White Sox have Liam Hendriks anchoring their bullpen, while the Guardians have Emmanuel Clase in the same role in theirs.
Hendriks pitched a scoreless top of the ninth. But even with the Guardians’ two best setup men, Trevor Stephan and James Karinchak, out of the game, Clase cooled his heels in the Cleveland bullpen while Enyel De Los Santos matched Hendriks out for out. What was Terry Francona up to?
He was, in fact, playing the percentages. “Never save your closer” is a modern analytical truism, but it wasn’t designed for the zombie runner rule. When every inning works the same, you should always get your best pitchers into the game post haste. The only difference between the ninth and 10th innings used to be that you might not get to play the 10th. That’s not the case anymore.
As I examined in 2020, making the 10th inning a higher-scoring affair than the ninth changes optimal pitcher usage. When all the action is in the 10th, it follows that you want your best arm pitching then. Walking the tightrope in extra innings and escaping without a run allowed is quite difficult; it’s an inherently higher-leverage spot, which means using your best reliever pays off.
The easiest way to think about it is with someone like Ryan Helsley or Edwin Díaz, a pitcher who frequently ignores runners on base thanks to strikeouts. Outs aren’t all created equal. With a runner on first and less than two outs, a groundout is the best kind of out thanks to the chance of a double play. With a runner on third and less than two outs, strikeouts and popups reign supreme. With the bases empty, everything is the same. The base/out state determines a lot about the optimal style of pitching. Read the rest of this entry »