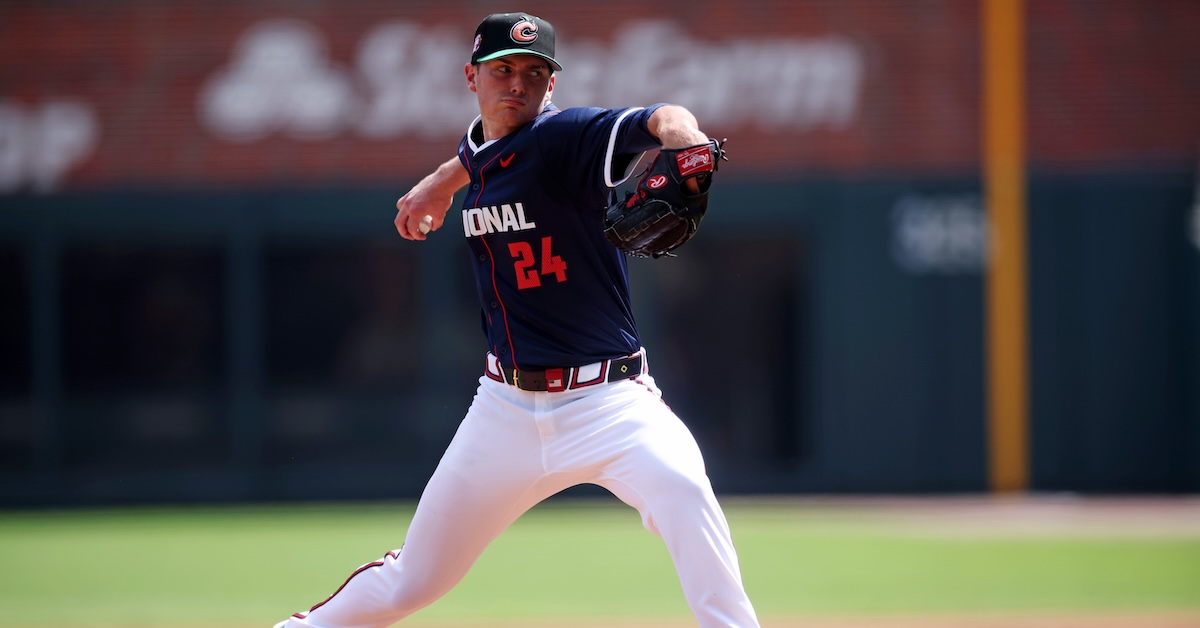
Below is an analysis of the prospects in the farm system of the Atlanta Braves. Scouting reports were compiled with information provided by industry sources as well as my own observations. This is the sixth year we’re delineating between two anticipated relief roles, the abbreviations for which you’ll see in the “position” column below: MIRP for multi-inning relief pitchers, and SIRP for single-inning relief pitchers. The ETAs listed generally correspond to the year a player has to be added to the 40-man roster to avoid being made eligible for the Rule 5 draft. Manual adjustments are made where they seem appropriate, but we use that as a rule of thumb.
A quick overview of what FV (Future Value) means can be found here. A much deeper overview can be found here.
All of the ranked prospects below also appear on The Board, a resource the site offers featuring sortable scouting information for every organization. It has more details (and updated TrackMan data from various sources) than this article and integrates every team’s list so readers can compare prospects across farm systems. It can be found here. Read the rest of this entry »
MIAMI — Through the first two games of the World Baseball Classic, the Dominican Republic had scored 24 runs, recorded 22 hits, and drawn 18 walks. Fifteen of those 24 runs had come on the team’s seven home runs. Collectively, the Dominican hitters were slashing .361/.506/.754; their 1.260 OPS was two points better than Babe Ruth’s was in 1927. They couldn’t possibly keep this up.
They cooled off some in Monday afternoon’s 10-1 win over Israel, lowering that slash line to a pedestrian .319/.488/.692. Those slackers.
Obviously, these numbers are staggering. Across three games, the Dominican squad has scored 34 runs and tallied 29 hits, nine home runs, and 29 walks; they’ve struck out just 13 times. Their OPS is now 1.180, slightly better than Ruth’s career mark of 1.164.
This is Ryan Blake’s first piece as a contributor for FanGraphs. He is a former newspaper reporter in the Inland Northwest and a current writer for Lookout Landing, where his work on the batter’s eye at T-Mobile Park was nominated for a 2026 SABR Analytics Conference Research Award.
A bottom-ranked pitching staff got a little deeper this weekend.
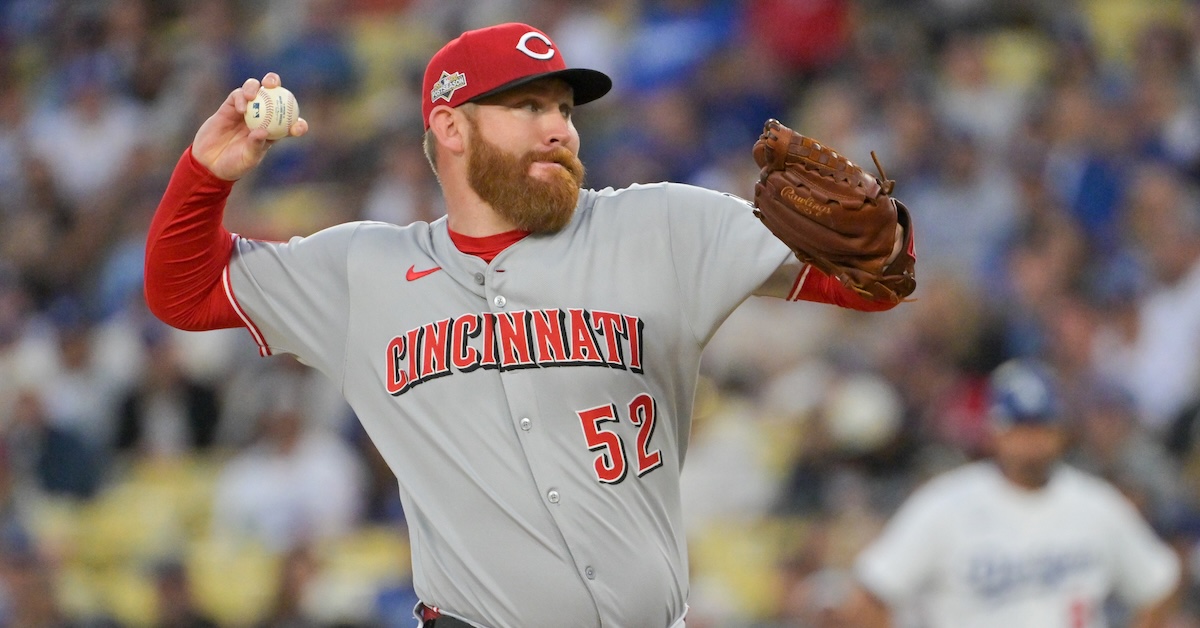
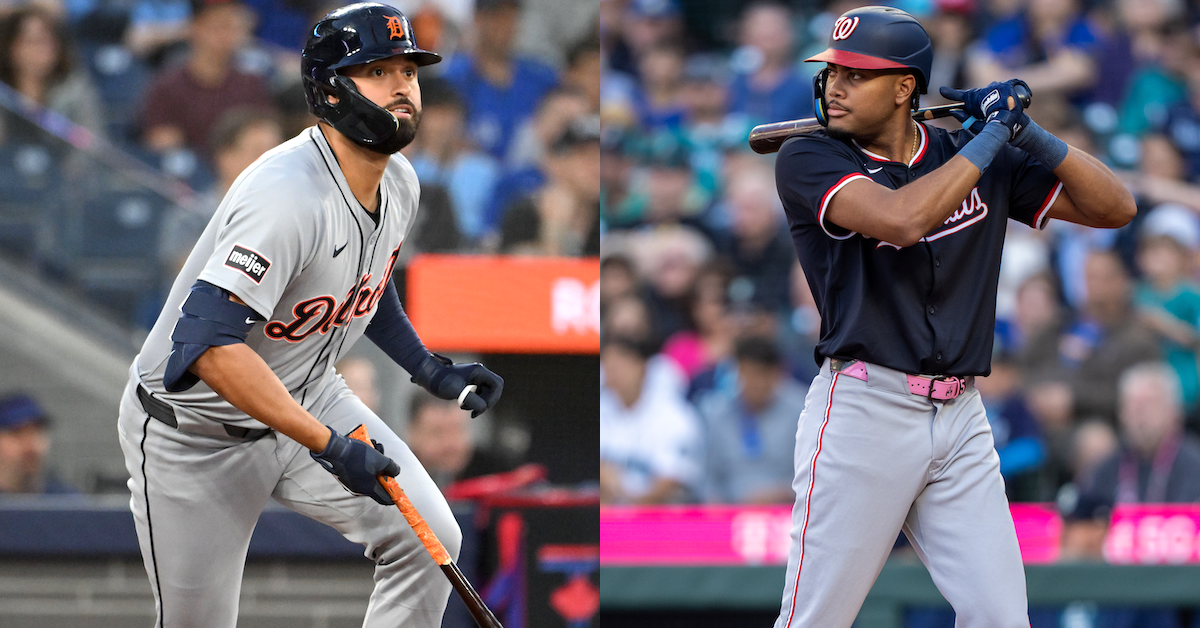
Zack Littell and the Nationals have agreed on a one-year contract, as several outlets reported Sunday. The price tag is currently unknown, though the deal includes a mutual option for 2027. Littell, 30, ranked next-to-last on our Top 50 Free Agents list this offseason. As it happens, he is also next-to-last to sign (only Lucas Giolito remains available).
Littell threw a career high 186.2 innings in 2025 across 32 starts for the Rays and Reds. Only 10 pitchers threw more innings last year. His 3.81 ERA was above average among qualified starters, and his 4.2% walk rate was the best in the majors. On the other hand, his 4.88 FIP, 17.1% strikeout rate, and 1.74 HR/9 each ranked in the bottom five. It was a mix of strengths and weaknesses that, taken together, made him the 88th-most valuable starting pitcher by WAR — useful depth for most organizations. Read the rest of this entry »
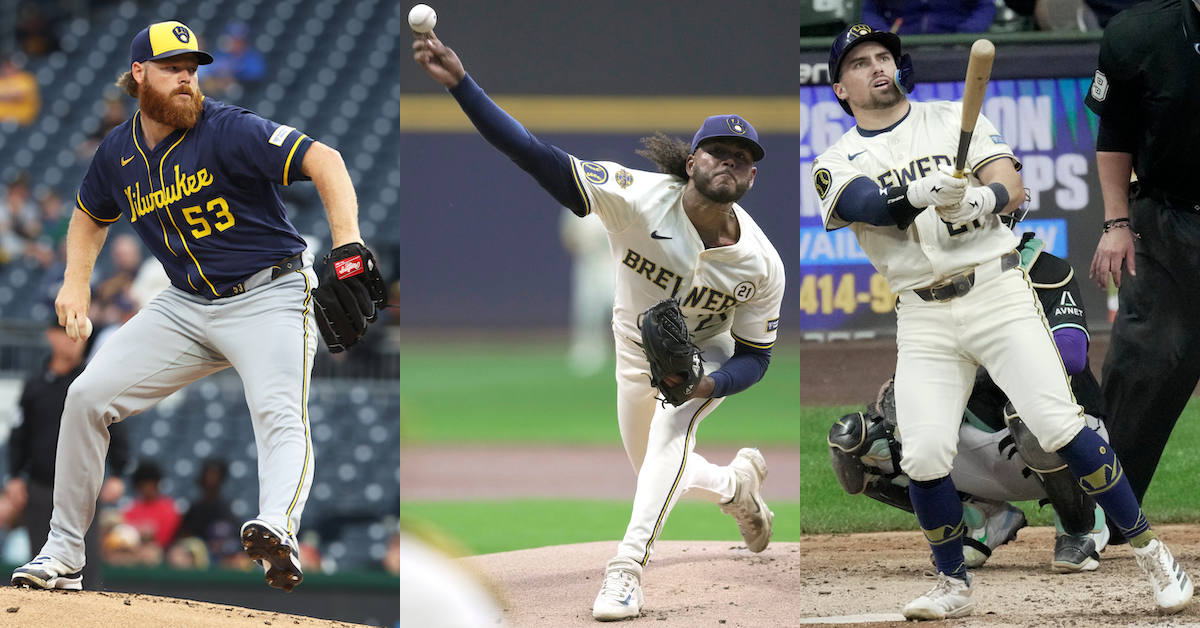
Charles LeClaire and Mark Hoffman/Milwaukee Journal Sentinel-USA Today Network via Imagn Images
This offseason, I’ve taken high-level looks at the offseason decisions made by the New York Mets and the Boston Red Sox. It’s been a popular series, so today, I’m going to use the same framework to offer a holistic evaluation of the Brewers. As a refresher, here’s how I’ve been thinking about the exercise:
“How should we evaluate a front office, particularly in the offseason when we don’t have games to look at? I’ve never been able to arrive at a single framework. That’s only logical. If there were one simple tool we could use to evaluate the sport, baseball wouldn’t be as interesting to us as it is. The metrics we use to evaluate teams, and even players, are mere abstractions. The goal of baseball – winning games, or winning the World Series in a broad sense – can be achieved in a ton of different ways. We measure a select few of those in most of our attempts at estimating value, or at figuring out who “won” or “lost” a given transaction. So today, I thought I’d try something a little bit different.”
I won’t be offering a single grade. Instead, I’m going to assess the decisions that Matt Arnold and the Brewers made across three axes. The first is Coherence of Strategy. If you make a win-now trade, but then head into the season with a gaping hole on your roster, that’s not a coherent approach. It’s never quite that simple in the real world, but good teams make sets of decisions that work toward the same overarching goal. Read the rest of this entry »
OOPSY peak projections for all minor and major league players are now available for FanGraphs Members.
I’ve been publishing current season OOPSY projections since 2025. They broadly fit in with the other FanGraphs systems in terms of methodology (and accuracy), though like all projection systems, they have their own methodological quirks. OOPSY makes use of its own aging curves, major league equivalencies, park factors, league scoring environment factors, regression, and recency weights to project players. For those interested in learning more, the OOPSY introduction, 2025 review, and recent Top 100 Prospects list provide a more detailed overview of my methodology.
Since 2022, OOPSY peak projections have been featured on Scout the Statline and, since 2024, they have also been featured on RotoGraphs, where I’ve used them to generate fantasy-oriented top prospect lists. Last month, after incorporating defense into the projections using our prospect team’s work on The Board, I published OOPSY’s first top prospect list with a real-life focus, ranking prospects by peak projected WAR. Read the rest of this entry »
If there’s something even more satisfying than spending your hard-earned money, it’s spending someone else’s money that you didn’t earn. When we’re talking baseball, unless you’re an extremely high-net-worth individual who can casually spend hundreds of millions of dollars — if this describes you, call me and we can totally hang out or something — you only have the option to spend other people’s cash. I mean, I haven’t technically asked American Express to up my credit limit to $300 million, but I’m guessing the answer would be no. Every year around this time, I make a whole piece out of it, naming seven players I think teams should attempt to sign to long-term contracts now, rather than waiting until later. There are some additional complications, of course, with a lockout likely coming after this season, but teams and players could be willing to act with more urgency to sign contracts now before all the uncertainty ahead of them.
I’ve (hopefully) chosen seven players whose possible extensions would benefit both the player and the team, as all good contracts ought to do. I’ve included the up-to-date ZiPS projections for each player, as well as the contract that ZiPS thinks each player should get, though that doesn’t necessarily mean I think the player will end up with that figure or even sign an extension. Read the rest of this entry »
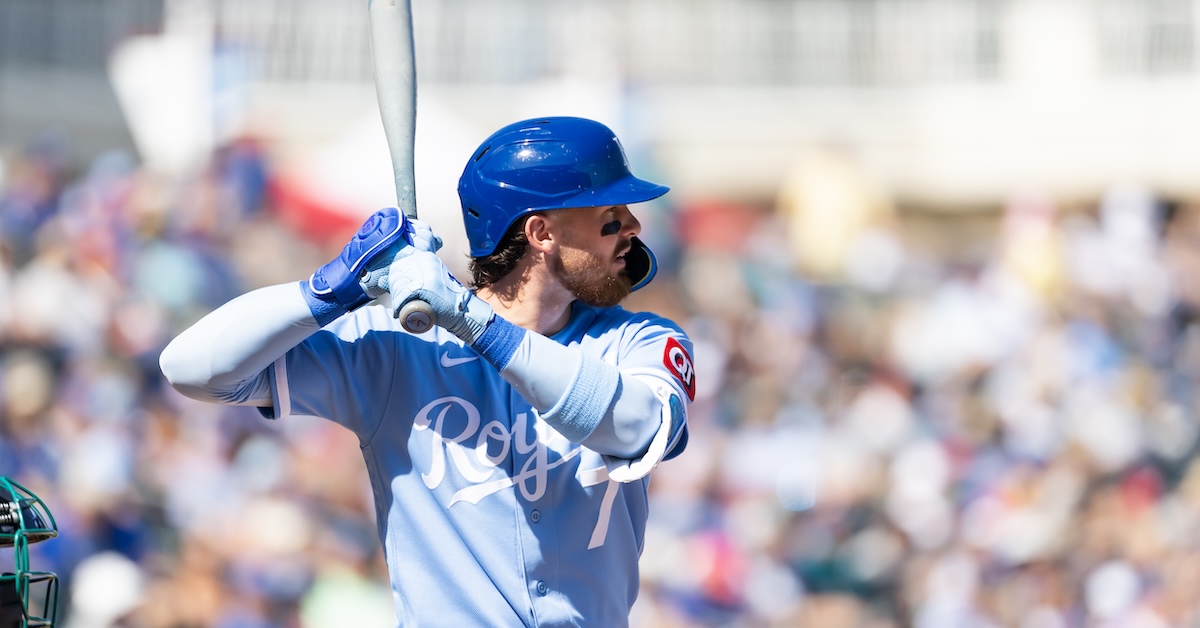
Collin Snider is with Chicago looking to recapture what he had two seasons ago with Seattle. Currently in camp with the Cubs, the 30-year-old right-hander was a pleasant surprise for the Mariners in 2024, logging a 1.94 with a 27.8% strikeout rate over 42 relief outings comprising 41-and-two-thirds innings. Last year was a different story. Hampered by a flexor strain and unable to get back on track, Snider struggled to the tune of a 5.47 ERA across 24 appearances in the majors, then posted an even uglier 8.06 ERA across 25 games with Triple-A Tacoma. Cut loose by Seattle in November, he subsequently inked a deal with the Cubs in December.
Despite the dismal results, Snider wasn’t without suitors. He had options — every team can use more pitching — and in the case of the Cubs, he also had connections. Tyler Zombro, the NL Central club’s Vice President of Pitching Strategy, previously worked at Tread Athletics, where Snider trained in previous offseasons. As the erstwhile Vanderbilt Commodore put it, “That really steered my decision. I like the way the pitching development is here.”
Asked about his poor 2025 performance, Snider pointed to how his injury contributed to bad mechanical habits that resulted in a drop in velocity, as well as “pitch shapes that weren’t the same.” He knew what was happening, but correcting it was another matter.
“I was very rotational, throwing too side-to-side, whereas I need to be north-south,” Snider said. “Side-to-side made the velo go down, because I couldn’t get behind the baseball. I was aware of what was going on, but I didn’t know why I was doing it, or how to make the adjustment quickly. It ended up being one of those things where I needed the offseason to straighten it out.”
Snider averaged 92.5 mph with his four-seamer last season, whereas in the prior two years that number was 94.2 and 95.3. His sweeper was also impacted by his delivery being out of sync. Read the rest of this entry »
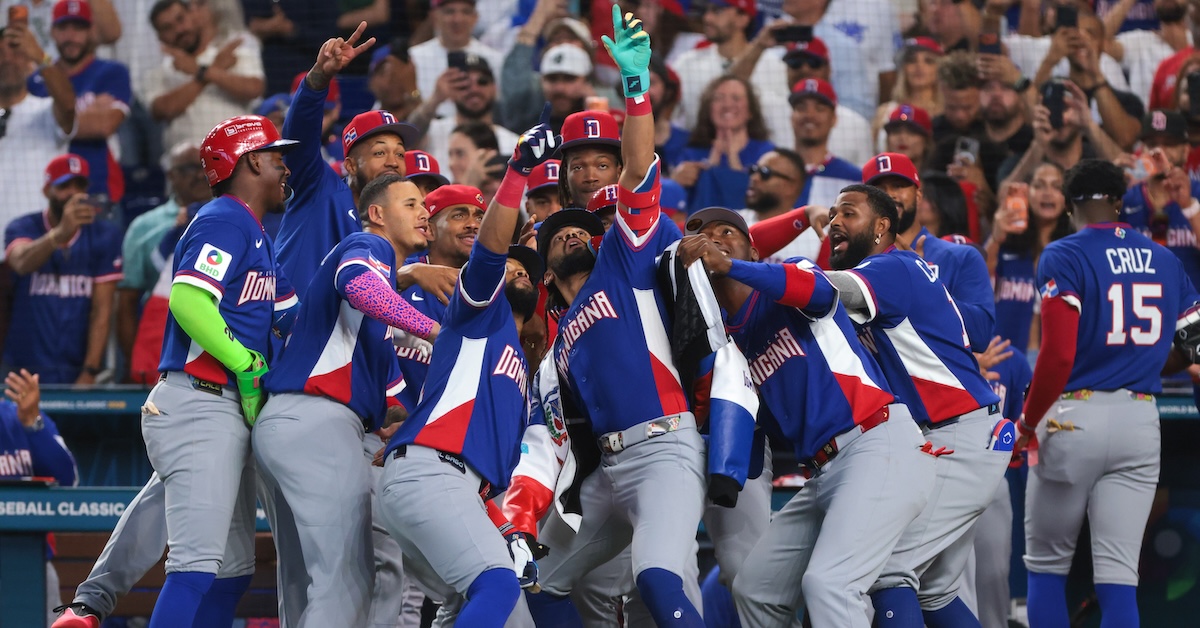
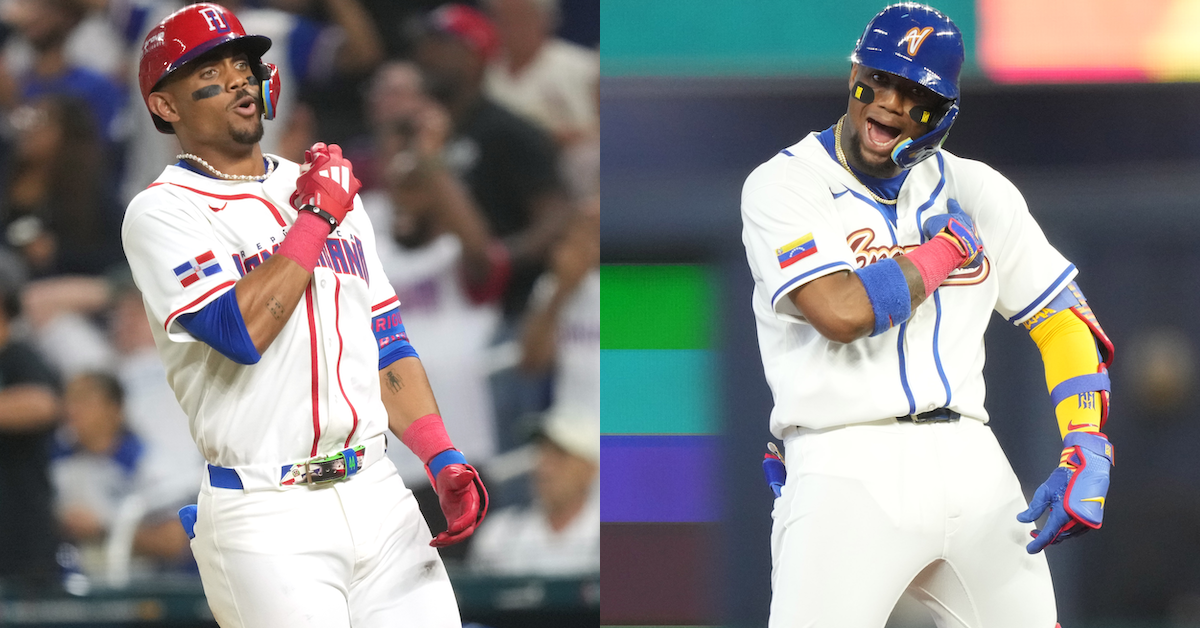
MIAMI — Mere seconds after the ball left his bat in the bottom of the sixth inning, Junior Caminero was booking it around the bases, euphoria smothering all sense of reason. You see, he’d just tattooed a two-run homer to straightaway center field to give the Dominican Republic the lead in its opening game of the World Baseball Classic, and even though nobody could possibly get him out, the 22-year-old slugger couldn’t contain himself.
He sprinted so fast toward second base that his helmet flew off. He skipped to third, where he seemed to finally realize that he didn’t have to run. He paused and gestured toward the Dominican fans behind the dugout, then pranced home.
It was one of the most electric home run celebrations in the history of the World Baseball Classic, a moment of catharsis after five and a half bewildering innings. The blast snapped the Dominican squad out of its temporary daze, as one of the most lethal lineups ever assembled pummeled Nicaragua’s pitchers for the remainder of the game. The final score of 12-3 didn’t reflect the chaos of what could have been. Up until that point, the Dominicans were getting outplayed by a vastly inferior Nicaragua team, whose leadoff batter, Chase Dawson, is from Northern Indiana and has never played affiliated baseball; it was only last year that he established residency in the country while playing winter ball there. Read the rest of this entry »
Hello from loanDepot Park in Miami, where I am covering Pool D of the World Baseball Classic. In the two games here Friday, Venezuela beat the Netherlands, 6-2, and the Dominican Republic defeated Nicaragua, 12-3. I am writing about those two games in a separate piece that will go live later today. You can find all of our WBC preview stories, as well as our coverage throughout the tournament, on the blog roll here.
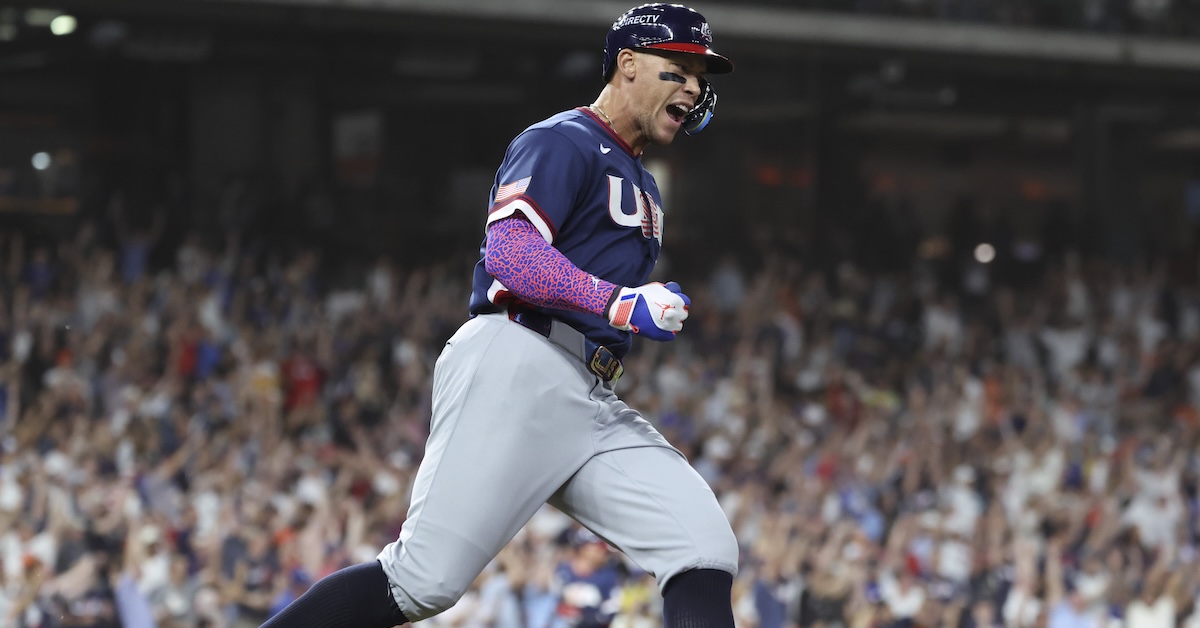
Of course, those were just two of the eight games that took place on Friday. (Well, Friday in the United States, anyway.) Elsewhere in the WBC, Team Japan was every bit as dominant as expected in the first game of its title defense, blowing out Taiwan 13-0 in seven innings. Shohei Ohtani went 3-for-4, with his grand slam getting Japan on the board and kicking off a 10-run second inning. Cuba opened the action from Pool A in San Juan, Puerto Rico, with a 3-1 win over Panama. Puerto Rico, despite being without many of its best players because of insurance issues, shut out Colombia, 5-0, in the second game of that pool. Over in Houston for Pool B, Great Britain kept things tight with a superior Mexican team for the first seven innings before Mexico exploded for three runs in the eighth and four more in the ninth to win, 8-2. Then, in the second game at Daikin Park, Team USA routed Brazil, 15-5, in one of the oddest-looking blowout box scores that I can recall. The leadoff batter for Brazil, Lucas Ramirez, son of Manny, hit more home runs (2) than the entire United States team. The lone U.S. homer came when Aaron Judge a two-run shot in the first inning. The key difference in the game was the Americans drew 17 walks while issuing only one. Later, back in Tokyo for the final game of the night, a matchup of 0-2 teams, Taiwan trounced Czechia, 14-0, in seven innings.
We’ll be talking more about the World Baseball Classic in today’s mailbag, when we answer your questions about the future Hall of Famers playing in this year’s tournament, as well as the Dominican Republic’s chances of contending for the title with Japan, the United States, and Pool D rival, Venezuela. Also in today’s mailbag, we’ll look at the best baseball birthdays and honor Bill Mazeroski with the all-time Az team. But first, I’d like to remind you that this mailbag is exclusive to FanGraphs Members. If you aren’t yet a Member and would like to keep reading, you can sign up for a Membership here. It’s the best way to both experience the site and support our staff, and it comes with a bunch of other great benefits. Also, if you’d like to ask a question for an upcoming mailbag, send me an email at mailbag@fangraphs.com. Read the rest of this entry »