The Cardinals’ Great (and Boring) Defense

At the All-Star Break, the St. Louis Cardinals were an even 44-44 with an 11% shot at the division and a 21% chance at the playoffs. Since the All-Star Break, the team is an NL-best 37-18, just a half-game back of the Houston Astros during that time. The team has gotten great individual performances from Jack Flaherty, whose 3.0 second-half WAR trails only Justin Verlander among pitchers, and Kolten Wong, whose 2.2 WAR in the second half puts him in the top 20 for position players. The team has enjoyed a very good bullpen all season long, and it ranks fourth in baserunning, but on its face, this Cardinals team doesn’t have the look of a 90-plus win division winner. Sometimes a solid defense gets overlooked.
There are currently 47 players in the big leagues with at least four wins on the season. None play for the Cardinals. And St. Louis doesn’t really make up for a lack of star-power with high-end depth, either. Of the 102 players with at least three wins on the season, the Cardinals have just three (Wong, Flaherty, and Paul DeJong). Individually, they might look like the roughly average team they were at the All-Star Break. Even collectively, the numbers don’t impress. As a team, their 99 wRC+ from non-pitchers ranks 17th. Including their good baserunning numbers only ups their offensive rank to 16th in baseball. On the pitching side, their 9.6 WAR from their starters ranks 14th while their bullpen, with the unknown Giovanny Gallegos as their best pitcher, does better at seventh with 4.6 WAR, though the bullpen fails to make a dent overall; the staff still sits in 14th place.
The Cardinals have a thoroughly average offense and an average staff, but are currently projected to win 90 games and only need to go 9-10 the rest of the way to do so. We might chalk some of this up to luck, but their Pythagorean record based on run-differential equals their actual record, and their BaseRuns record is only two games behind their wins in the standings. That means that of the roughly 10 wins that would need to turn to losses to make the Cardinals a .500 team, only a couple have to do with sequencing and getting better results with runners on base than when the bases are empty.
So if the Cardinals have an average lineup, average pitching, and haven’t benefited from much sequencing-related luck or performance, that leaves the defense as the primary driver for the Cardinals’ success relative to other teams. Below you’ll find the team’s DRS as well as the component parts of UZR when compared to the rest of baseball:
| Team | DRS | ARM | DPR | RngR | ErrR | UZR |
|---|---|---|---|---|---|---|
| Athletics | 24 | 6.4 | -1.5 | 10 | 16.5 | 31.4 |
| Indians | 64 | 10.2 | -2.4 | 10.2 | 9.1 | 27.1 |
| Cardinals | 75 | 1.8 | 5.5 | 6.2 | 9.6 | 23.1 |
| Cubs | 3 | 0.2 | 7.5 | 3.6 | 9.2 | 20.5 |
| Diamondbacks | 89 | 7.7 | -1.4 | 8.2 | 3.9 | 18.5 |
| Royals | 11 | -3.7 | 4.7 | 3.3 | 12.6 | 16.9 |
| Angels | -12 | 4.4 | 0.9 | 2 | 7.6 | 14.9 |
| Phillies | 27 | 7.2 | -7 | 7.6 | 6.5 | 14.3 |
| Red Sox | -11 | 11.9 | -6 | -2.3 | 7.4 | 11 |
| Astros | 78 | 1 | -6.6 | 13.1 | 2.6 | 10.1 |
| Giants | 38 | -2.6 | -3.8 | 14.7 | 1.7 | 10 |
| Padres | 16 | -2.4 | -1.5 | 14.9 | -1.6 | 9.4 |
| Marlins | 10 | 0.5 | 1.9 | 9.5 | -5.6 | 6.3 |
| Yankees | -7 | 0.3 | 1.6 | 0.9 | 0.8 | 3.6 |
| Brewers | 22 | 1.1 | 1.8 | 4.8 | -6.6 | 1.2 |
| Dodgers | 127 | 7.2 | -0.2 | 8.1 | -15.5 | -0.5 |
| Twins | 4 | 6.1 | -0.3 | 13.5 | -20.2 | -0.9 |
| Reds | 49 | -2.7 | 2 | -2.7 | 2.1 | -1.4 |
| Nationals | -12 | 1 | -4 | -6.6 | 8.2 | -1.5 |
| Rays | 45 | 7.3 | -1 | -0.7 | -7.4 | -1.8 |
| Rangers | -41 | -8.5 | 1.1 | 2.6 | 1.5 | -3.3 |
| Braves | 25 | 5.7 | 1.7 | -25.2 | 10.5 | -7.3 |
| Rockies | 6 | -13 | 0.9 | 4.1 | -4 | -12 |
| White Sox | -55 | 0 | 5.9 | -6.8 | -12.5 | -13.4 |
| Mets | -82 | -1 | 3.8 | -19 | -0.6 | -16.8 |
| Blue Jays | 3 | -1 | -3 | -20.5 | 7.5 | -17.1 |
| Tigers | -59 | -14.6 | -1.9 | -11.5 | 4.1 | -23.8 |
| Orioles | -91 | -16.8 | 4 | -3 | -16.1 | -31.9 |
| Mariners | -82 | -9.2 | -2.9 | -10.8 | -9.3 | -32.2 |
| Pirates | -46 | -4.5 | 1.6 | -28.3 | -14.9 | -46.1 |
The table above is sortable so we can mess around with the Cardinals’ component parts. In both ARM and range, they rank 11th. Where they excel is at turning double plays (third) and in not making errors (fourth), which, combined with not being bad in the first two categories, places them third overall and first in the National League. Of the four categories, not making errors and the ability to turn double plays are arguably the more boring aspects of defense, but they prevent runs all the same.
And Statcast numbers tend to back up the club’s ability to get outs. The graph below shows a club’s expected batting average minus their actual batting average on balls in play. The larger the number, the more outs that are being made in the field than Statcast would expect:
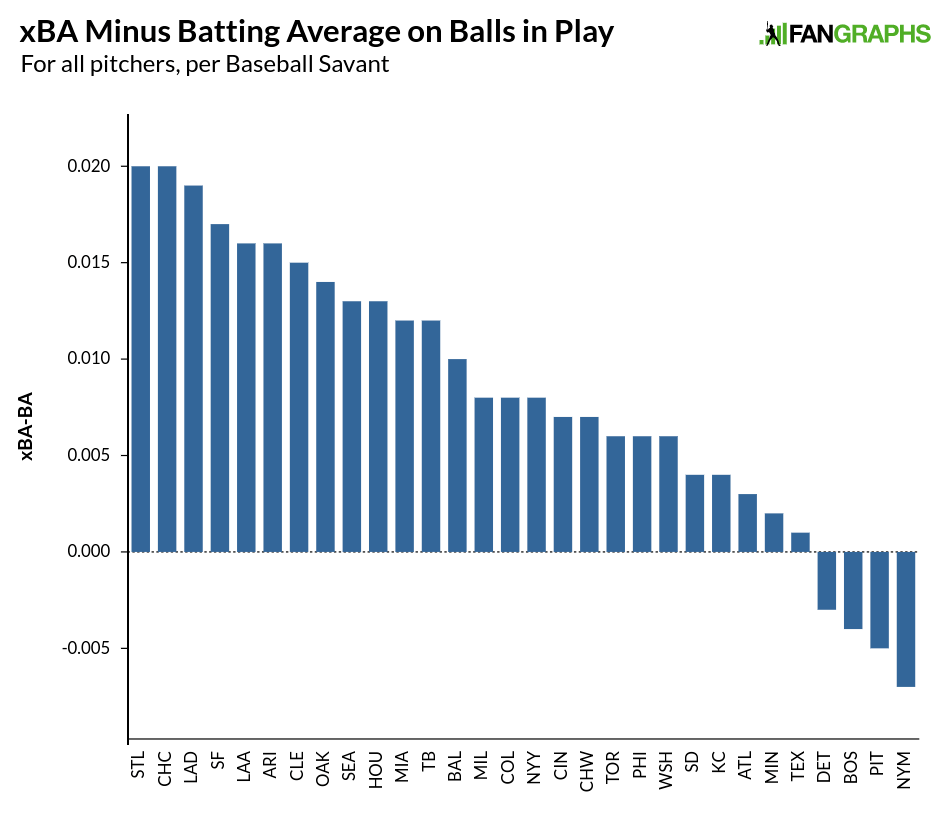
The Cardinals sit in first place just ahead of the Chicago Cubs. The league average difference is eight points, so the Cardinals and Cubs are around 12 points better than average this season. Perhaps confirming the UZR numbers, the sorts of plays the Cardinals make aren’t necessarily the most exciting. I separated individual plays into expected batting average buckets, with sure hits at .700-1.000, in-between at .400-.699, likely outs at .100-.399, and sure outs .000-.099. Here’s how the Cardinals performed in each bucket:
| xBA Bucket | Play % | xBA | BA | STL BA-xBA | Lg BA-xBA | STL-Lg Difference | MLB Rank |
|---|---|---|---|---|---|---|---|
| 0-.099 | 32.4% | .035 | .028 | .007 | .004 | .003 | 8 |
| .100-.399 | 34.8% | .239 | .194 | .045 | .010 | .035 | 1 |
| .400-.699 | 20.8% | .535 | .506 | .029 | .020 | .009 | 9 |
| .700-1.000 | 12.1% | .841 | .867 | -.026 | .004 | -.030 | 28 |
The Cardinals didn’t do great at converting the sure hits, and were pretty good in the sure outs and the 50/50 shots, but nobody has been better than St. Louis at making the likely outs:

Most of these plays end up in the solid but not spectacular category with some helped by positioning like this ground ball:
Other plays take a bit more range, like this diving stop from Kolten Wong:
The Cardinals twitter account actually created a thread highlighting Kolten Wong’s play, with the thread now at 25 plays this year with the last one here:
Gold glove worthy! ? pic.twitter.com/wF2nbzOiyh
— St. Louis Cardinals (@Cardinals) September 8, 2019
Wong leads NL second basemen in both UZR and DRS this season, with his three-year UZR numbers just a bit behind Ian Kinsler and D.J. Lemahieu league-wide to go along with the major league-lead in DRS. His double-play partner, Paul DeJong, is decidedly less flashy with the glove, but he makes all the plays, with his 10.5 UZR leading all shortstops and his +11 DRS coming in fifth. Since DeJong debuted in 2017, his 19.7 UZR is first in the NL, with his +25 DRS coming in behind Nick Ahmed and Trevor Story. Highlight videos don’t help make DeJong’s case much, though the Cardinals do have one outfielder in Harrison Bader who has a bunch of highlight-reel plays like this one:
Bader is one of the fastest players in the game and ranks third in baseball in Outs Above Average, making four of the most difficult catches in baseball this season. Still relatively new to the big leagues, his sample size in the field isn’t as big as DeJong’s or Wong’s, but even if we were to give Bader another 1500 innings at an average level, he’d still be fourth in UZR behind Billy Hamilton, Kevin Kiermaier, and Byron Buxton, and fifth in DRS with Lorenzo Cain also jumping ahead. The Cardinals also get solid defense from left fielder Marcell Ozuna and first baseman Paul Goldschmidt, and decent efforts from right fielder Dexter Fowler and third baseman Matt Carpenter. Future Hall of Famer Yadier Molina isn’t fielding too many balls in play but failing to mention Molina when discussing the Cardinals’ defense seems like a bit of an oversight.
All told, we can see the benefits of good defense in the Cardinals’ starting pitcher numbers. Here is each pitcher’s FIP and ERA, along with their xwOBA and wOBA on balls in play:
| Name | ERA | FIP | xwOBA BIP | wOBA BIP | Difference |
|---|---|---|---|---|---|
| Jack Flaherty | 2.99 | 3.66 | .311 | .249 | .062 |
| Miles Mikolas | 4.25 | 4.15 | .340 | .297 | .043 |
| Adam Wainwright | 4.16 | 4.23 | .334 | .316 | .018 |
| Dakota Hudson | 3.40 | 4.94 | .319 | .271 | .048 |
| Cardinals | 3.84 | 4.24 | .317 | .278 | .039 |
| MLB | 4.52 | 4.52 | .323 | .295 | .028 |
Jack Flaherty is already having a very good season, with his 3.66 FIP resulting in a 3.7 WAR that is among the top 20 pitchers in baseball. But with weak contact plus help from his defense, his sub-3.00 ERA is one of the very best this season. Wainwright hasn’t gotten a huge benefit from his fielders, while Mikolas’ gain on balls in play have been wiped out by a low left-on-base percentage. Hudson is a big beneficiary because of his poor walk and strikeout numbers. As discussed earlier this week, his low ERA is due in part to a large number of unearned runs, so to believe his ERA accurately reflects his abilities, one would need to believe he was playing in front of a poor defense.
Overall, that 11 point difference between the league’s xwOBA-wOBA and the Cardinals’ xwOBA-wOBA might not seem like much, but it amounts to close to three wins this season. If you think that the Cardinals have two wins of sequencing-based results, those three wins might mean the difference between a division title and a fight for the wild card. And that 0.40 difference between FIP and ERA is about five wins worth, absolutely the difference between the division and second place.
The Cardinals have no individual difference-makers posting close to a five-win season this year. The baserunning is good, but that’s maybe worth a win. The offense is average. The starting pitching has been average. The bullpen is good, but not great. All contributions matter, but in discussing the story of this Cardinals’ season, any narrative that doesn’t mention the defense first is burying the lede.
Craig Edwards can be found on twitter @craigjedwards.
Like the Card’s defense, your articles have been quietly consistently excellent Craig. The last week or so have been especially good.