Are Plate Discipline Breakouts for Real?
Earlier this month, I noted that hitters are chasing fewer pitches and seeking out fastballs in the zone. It’s one thing batters can do to fight back against the rising pitching talent and increased strikeouts. It seemed to me that every time I looked into a hitter potentially breaking out this season, I saw the same pattern: fewer swings on pitches outside the zone and a rising wRC+.
- It was true for George Springer, who took over the AL WAR lead.
- Hunter Dozier seemed to benefit greatly from better discipline.
- Jason Heyward’s mini-resurgence seemed due to better plate recognition.
- Paul DeJong took a step forward by mashing balls in the strike zone and avoiding those outside of it.
There comes a point when writing about the same thing over and over again becomes presumptuous if we can’t quite be sure that the benefits will last. To that end, I first went through plate discipline numbers from this season to determine if chasing fewer pitches seemed to help batters like I think it should. First, I looked at all hitters with at least 300 plate appearances in 2018 who were also qualified for the batting title as of May 13 of this year. While we can presume that taking pitches outside the strike zone is a skill, and one that stabilizes pretty quickly based on previous research, here’s how the numbers from last season and this one match up as of Tuesday’s data.
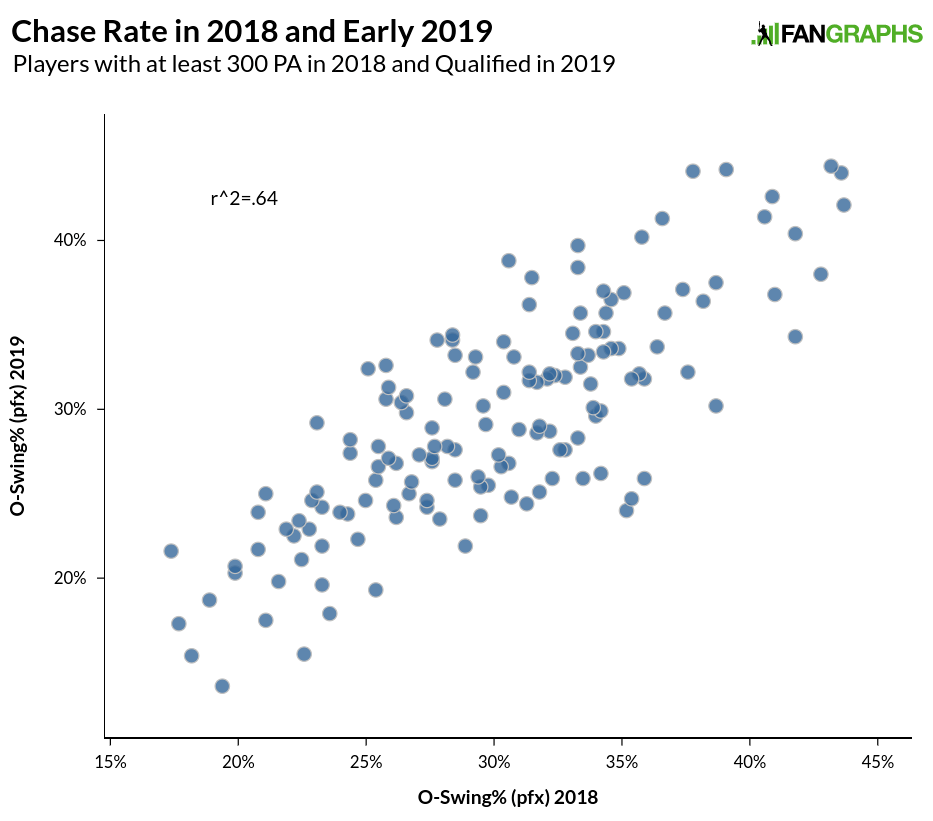
Even at the very early stages of this season, we see that O-Swing% is pretty consistent compared to last year. As to individual players, here are the biggest changers in a positive way over last season.
| Name | O-Swing% (pfx) 2018 | O-Swing% (pfx) 2019 | O-Swing Change |
|---|---|---|---|
| Hunter Dozier | 35.2 | 24 | -11.2 |
| Dansby Swanson | 35.4 | 24.7 | -10.7 |
| Ryon Healy | 35.9 | 25.9 | -10 |
| Orlando Arcia | 38.7 | 30.2 | -8.5 |
| Freddie Freeman | 34.2 | 26.2 | -8 |
| Niko Goodrum | 33.5 | 25.9 | -7.6 |
| Dee Gordon | 41.8 | 34.3 | -7.5 |
| Tommy Pham | 22.6 | 15.5 | -7.1 |
| Kris Bryant | 28.9 | 21.9 | -7 |
| Yonder Alonso | 31.3 | 24.4 | -6.9 |
| Asdrubal Cabrera | 31.8 | 25.1 | -6.7 |
| Joey Gallo | 32.3 | 25.9 | -6.4 |
| Justin Smoak | 25.4 | 19.3 | -6.1 |
| Cody Bellinger | 30.7 | 24.8 | -5.9 |
| Kole Calhoun | 29.5 | 23.7 | -5.8 |
| Mike Trout | 19.4 | 13.6 | -5.8 |
| George Springer | 23.6 | 17.9 | -5.7 |
| C.J. Cron | 37.6 | 32.2 | -5.4 |
| Jason Heyward | 32.8 | 27.6 | -5.2 |
| Albert Pujols | 32.6 | 27.6 | -5 |
| Joc Pederson | 33.3 | 28.3 | -5 |
| Avisail Garcia | 42.8 | 38 | -4.8 |
| Michael Conforto | 27.9 | 23.5 | -4.4 |
| Miguel Rojas | 34 | 29.6 | -4.4 |
| Jose Altuve | 34.2 | 29.9 | -4.3 |
| Paul DeJong | 29.8 | 25.5 | -4.3 |
| Amed Rosario | 41 | 36.8 | -4.2 |
As for how these players have been helped, here are those same players along with their change in wRC+ over last season.
| Name | O-Swing% (pfx) 2018 | O-Swing% (pfx) 2019 | O-Swing Change | wRC+ 2018 | wRC+ 2019 | wRC+ Change |
|---|---|---|---|---|---|---|
| Hunter Dozier | 35.2 | 24 | -11.2 | 80 | 172 | 92 |
| Dansby Swanson | 35.4 | 24.7 | -10.7 | 80 | 111 | 31 |
| Ryon Healy | 35.9 | 25.9 | -10 | 90 | 104 | 14 |
| Orlando Arcia | 38.7 | 30.2 | -8.5 | 54 | 85 | 31 |
| Freddie Freeman | 34.2 | 26.2 | -8 | 137 | 147 | 10 |
| Niko Goodrum | 33.5 | 25.9 | -7.6 | 103 | 85 | -18 |
| Dee Gordon | 41.8 | 34.3 | -7.5 | 77 | 104 | 27 |
| Tommy Pham | 22.6 | 15.5 | -7.1 | 129 | 131 | 2 |
| Kris Bryant | 28.9 | 21.9 | -7 | 125 | 148 | 23 |
| Yonder Alonso | 31.3 | 24.4 | -6.9 | 97 | 68 | -29 |
| Asdrubal Cabrera | 31.8 | 25.1 | -6.7 | 111 | 101 | -10 |
| Joey Gallo | 32.3 | 25.9 | -6.4 | 110 | 156 | 46 |
| Justin Smoak | 25.4 | 19.3 | -6.1 | 121 | 109 | -12 |
| Cody Bellinger | 30.7 | 24.8 | -5.9 | 120 | 227 | 107 |
| Kole Calhoun | 29.5 | 23.7 | -5.8 | 79 | 117 | 38 |
| Mike Trout | 19.4 | 13.6 | -5.8 | 191 | 176 | -15 |
| George Springer | 23.6 | 17.9 | -5.7 | 119 | 181 | 62 |
| C.J. Cron | 37.6 | 32.2 | -5.4 | 122 | 109 | -13 |
| Jason Heyward | 32.8 | 27.6 | -5.2 | 99 | 115 | 16 |
| Albert Pujols | 32.6 | 27.6 | -5 | 90 | 102 | 12 |
| Joc Pederson | 33.3 | 28.3 | -5 | 126 | 141 | 15 |
| Avisail Garcia | 42.8 | 38 | -4.8 | 92 | 124 | 32 |
| Michael Conforto | 27.9 | 23.5 | -4.4 | 120 | 153 | 33 |
| Miguel Rojas | 34 | 29.6 | -4.4 | 79 | 68 | -11 |
| Jose Altuve | 34.2 | 29.9 | -4.3 | 135 | 119 | -16 |
| Paul DeJong | 29.8 | 25.5 | -4.3 | 102 | 161 | 59 |
| Amed Rosario | 41 | 36.8 | -4.2 | 85 | 100 | 15 |
| AVERAGE | 32.5 | 26 | -6.5 | 106 | 126 | 20 |
For most of the players above, chasing fewer pitches is associated with better offensive outcomes. All other hitters lost about five points on average of wRC+ this season, although the players who had the biggest increase in chasing pitches outside the zone didn’t see a significantly different drop than the rest of the population who stayed pretty close to last year’s numbers. These numbers aren’t going to tell us much about whether the changes will remain going forward, nor will they tell us if the offensive gains are here to stay.
Looking back at last year might provide some help in determining whether this year’s players are likely to keep their hitting gains. I checked out all players with at least 300 plate appearances in 2017 and 100 plate appearances in April. Players looked very much last season like the hitters who most changed their O-Swing percentage from the previous season, improving their wRC+ in April by an average of 29 points over the previous year. Then I looked at how that group performed the rest of the year. The results are a mixed bag.
| 2017 | April 2018 | ROS 2018 | |
|---|---|---|---|
| O-Swing% | 33.0% | 25.3% | 30.5% |
| wRC+ | 111 | 140 | 114 |
We see that the players who showed increased plate discipline in April of last season kept some of those improvements the rest of the year. There was a slightly higher correlation between the April O-Swing% and the ROS O-Swing% than 2017 O-Swing% and ROS O-Swing%. The gains made on swinging at pitches outside the zone were real. Unfortunately, the gains made on the wRC+ side didn’t really stick. As a group, the players simply reverted mostly back to 2017 performance the rest of the way.
Not ready to give up, I isolated the group into players who significantly improved O-Swing% in April and improved wRC+ in April. While most of the players who showed improved plate discipline got better results, that wasn’t true for all players. We are down to a group of 16 hitters, but this is how they turned out.
| 2017 | April 2018 | ROS 2018 | |
|---|---|---|---|
| O-Swing% | 33.0% | 24.8% | 30.7% |
| wRC+ | 104 | 149 | 115 |
That looks better. Nine of the 16 players showed significant improvement over their 2017 numbers while only four got significantly worse. To provide a comparison, I took a similar group of players who improved their wRC+ in April 2018 over the previous season but who did not do better at O-Swing%. These were the results.
| 2017 | April 2018 | ROS 2018 | |
|---|---|---|---|
| O-Swing% | 31.8% | 32.6% | 32.8% |
| wRC+ | 97 | 141 | 99 |
Well that’s kind of interesting. Nine of the 17 players got significantly worse while only four made big gains in wRC+. The median change from 2017 was an eight-point loss of wRC+ while the group of players who improved their wRC+ and their O-Swing% last April had a median gain of 12 points. I only studied one year of data, so some necessary waffling is included here, but the data does show some promise that the players who have improved their wRC+ and O-Swing% in the early part of the season have a decent chance of hitting better the rest of this summer than they did last year.
Craig Edwards can be found on twitter @craigjedwards.
Not a single player for the Rockies on the list. This is not surprising.