Author Archive

Shane Greene Heads to Atlanta for Modest Return

The Tigers are rebuilding as the Braves have tried to build a bullpen on the fly all season long. The match between the two teams is an easy one to make, and Ken Rosenthal is reporting that the Tigers are close to trading away closer Shane Greene to the Braves. Robert Murray has added the return for the Tigers. Here’s the deal:
Braves Receive:

  • RHP Shane Greene

Tigers Receive:

A season ago, Greene racked up 32 saves for the Tigers, but he generally wasn’t a very good reliever. His ground-ball rate at 40% was lower than in previous seasons, and too many fly balls meant too many homers and a 4.61 FIP and an ERA over 5. This season, Greene was able to get back to his ground-balling ways with a sinker/cutter/slider arsenal, and he’s been a pretty good pitcher as a result. Looking at Greene’s ERA might lead one to believe he is a great pitcher, but the underlying numbers don’t completely support that greatness.

Greene has a 1.18 ERA, which is certainly really good. Only Kirby Yates‘ 1.02 mark bests Greene among relievers this season. Expecting Greene to continue to post a 1.18 ERA is folly. He has struck out 29% of batters, which is good, while walking 8% of batters, which is roughly average. His ground-ball rate on the season is 54%, and that’s going to keep the ball in the park and limit damage, but those things alone aren’t enough to take a 3.80 FIP, which is about 20% better than average in these heightened run environments, and move it to a 1.18 ERA.

Greene’s BABIP is .181 and his left-on-base rate is 85%, and neither number is sustainable going forward. He’s also given up six runs on the season which weren’t earned, more than double his total of five earned runs. This isn’t to say Greene isn’t good, but it is enough to say Greene isn’t great. Over at Statcast, his xwOBA is a solid .282, but his actual wOBA is about 60 points lower. Greene is a solid addition to the Braves pen, and 15 years ago, the ERA and saves might have netted the Tigers a top-50 prospect. Today, Greene is another solid reliever among many available at the trade deadline. The Braves are likely to pay a premium for that need, but their top prospects were always going to be off limits. Read the rest of this entry »


Getting the Most out of Robbie Ray

A glimpse at Robbie Ray might look like an ace at work. Four times this season, Ray has struck out at least 10 batters while walking one hitter or fewer. Only Gerrit Cole, Chris Sale, and Max Scherzer have more matching games. Since the beginning of the 2016 season, Ray has struck out 31% of batters faced; among the 183 starters with at least 200 innings, only Scherzer and Sale have higher strikeout rates. The strikeouts are great, but Ray’s walk rates and inability to pitch deep into games has long held him back. While he has continued to work to get better, the changes have continued to lead Ray back to being the generally above-average pitcher he’s always been.

Ray’s first full season with the Diamondbacks in 2015 was a solid one, with a 22% strikeout rate, a 9% walk rate, and an ERA and FIP both in the mid-threes, about 10% better than average. Ray tried to get better by changing his delivery slightly, as he told David Laurila in 2016, and become a “strikeout madman”, as August Fagerstrom detailed. His strikeouts went way up, but so did his homers, though his 3.76 FIP was again about 10% better than average. Some bad luck on balls in play meant an ugly 4.90 ERA and the questions began about Ray’s ability to pitch deep into games and limit hard contact.

In 2017, Ray ditched his changeup as well as his sinker and used his curve much more, as Eno Sarris wrote at the beginning of the season. Ray increased his strikeout rate even more, though his walk rate climbed a bit as well and he still gave up his fair share of homers on the way to a 3.72 FIP that was 15% better than league average. It was Ray’s best season and whatever bad luck he had from 2016 turned itself around in 2017, to the tune of a 2.89 ERA and a handful of down-ballot Cy Young votes. Last year was a disappointing one, as Ray missed two months with an oblique injury and posted his first below-average FIP in Arizona. His walk rate surged, though after a rough start to open the second half, he closed the season well with a 3.78 FIP that was about 10% better than average and a 2.83 ERA thanks to a very low BABIP. Read the rest of this entry »


The Case for Noah Syndergaard

After is appeared the Mets put some more eggs in their 2020 basket by trading for Marcus Stroman, there now seems to be a pretty distinct possibility that the club is merely moving eggs around as it attempts to deal Noah Syndergaard. With the relative dearth of impact arms on the market and the decreasing likelihood of a Madison Bumgarner deal, Syndergaard could be the biggest name and best pitcher to change teams this week, even including the recently acquired Stroman. The trade package necessary to land Syndergaard should be significantly richer than the one the Mets gave up for Stroman, given Syndergaard’s relative track record, age, and the extra season of team control through 2021. As was the case with Stroman, there are some discrepancies in how good Syndergaard is as a pitcher given his 4.33 ERA.

Nobody disputes that Sydergaard was an ace for the Mets back in 2016 when he put up a six-win season with a 2.29 FIP and 2.60 ERA. He missed most of 2017 with a torn right lat muscle. In 2018, despite missing more than a month with a finger injury and a little bit of time with hand, foot, and mouth disease, Syndergaard was still one of the best pitchers in the game, posting a four-win season, a 2.80 FIP and 3.03 ERA. This season, Syndergaard’s FIP is very good, but his ERA is not. There’s a fairy simple explanation for that disparity, and for the gap between Syndergaard’s FIP and ERA throughout his career. Simply put, the Mets infield defense is very bad and has been very bad throughout the right-hander’s career:

Mets’ Infield Defense Ranks
SS/2B/3B UZR Rank SS/2B/3B DRS Rank
2016-2019 -36.2 28 -93 30
2019 -13.6 30 -24 27

A .315 career BABIP, and and the lower FIP than ERA, could be an indicator that Syndergaard gives up hard contact. The Statcast numbers tend to disagree:

Noah Syndergaard’s Bad Luck
BA on GB xBA on GB Difference wOBA xWOBA Difference
2015 .246 .219 .027 .279 .265 .014
2016 .250 .218 .032 .277 .266 .011
2018 .232 .216 .016 .286 .268 .018
2019 .280 .228 .052 .308 .281 .027

Read the rest of this entry »


The Rays are in Some Trouble

Yesterday, news came out of Tampa Bay that Blake Snell will undergo arthroscopic surgery to remove loose bodies in his arm. While that isn’t the worst-case scenario when it comes to pitcher injuries, he’s expected to miss at least a month. If this injury had occurred in April or May, we probably wouldn’t be too worried about it; missing 15%-20% of the season isn’t a huge deal. But when the injury occurs in late-July, losing a team’s best starting pitcher and best player for half of the season’s remaining games is a big deal. It’s especially important for the Rays, who are sitting just outside of a Wild Card spot.

Snell isn’t the only injury problem Tampa has had of late.

  • Brandon Lowe, still second on the Rays in WAR with 2.5 wins, has been out with a shin injury since the beginning of the month.
  • Kevin Kiermaier, the club’s standout center fielder, went on the injured list on Sunday with a left thumb sprain.
  • Yandy Diaz, the team’s starting third baseman who has put up 118 wRC+, went on the IL on Tuesday with a foot injury.

Those three position players rank second, fifth, and fourth respectively on the Rays in WAR this season. They have put up 5.7 WAR this year, which is 38% of the team’s total from the position player side. Similarly, Snell and the previously injured Tyler Glasnow represent a quarter of the Rays’ 2019 pitching WAR. That’s roughly one-third of the Rays’ production on the injured list right now. While the injuries are relatively minor, for a team fighting for a playoff spot, every game matters. After a great start to the season, Tampa has seen its playoff odds go from near-sure-thing to a coin flip:

Read the rest of this entry »


Craig Edwards FanGraphs Chat–7/25/2019

Read the rest of this entry »


A Season of Improbabilities in Cleveland

Cleveland entered last offseason with one of the better rosters in baseball, but they spent the winter not offering Michael Brantley a qualifying offer, not bringing in an MLB-level replacement, switching out Edwin Encarnacion for Carlos Santana and Jake Bauers, trading away Yan Gomes, and then went through months of rumors that it would trade one of the best starting pitchers in the game, be it Corey Kluber or Trevor Bauer. In the end, they kept the rotation intact, but did nothing for the outfield, relying on stars on the pitching staff as well as Francisco Lindor and Jose Ramirez on the position player side. In short, the team left itself vulnerable, and two months into the season, it looked like the chickens had come home to roost. With another two months in the books, the club is almost where they were expected to be to start the year.

At the beginning of every season, FanGraphs puts together Positional Power rankings. This is where Cleveland ranked at every position.

2019 Preseason Positional Power Rankings
Team C 1B 2B 3B SS LF CF RF SP RP DH
Indians 17 21 20 1 1 29 22 25 1 15 9

There’s Lindor, Ramirez, the starting rotation, and then a bunch of below-average or worse players. Those rankings netted Cleveland an expected 97-win season, but they were heavily reliant on the stars delivering. Through 59 games, Cleveland was 29-30. Here are the main reasons.

  • Lindor missed the first several weeks of the season. In just three weeks, his replacements Max Moroff and Eric Stamets were nearly a full win below replacement. Stamets got two hits in 48 plate appearances while Moroff hit better than that with a wRC+ of 3. Lindor came back and performed up to his normal standards, but instead of the two wins Cleveland expected from shortstop, they ended up with around one-third of that amount.
  • Ramirez was terrible for two months. Instead of generating a win per month, he was a replacement-level player.
  • The outfield was even worse than expected. Bauers, Leonys Martin, Carlos Gonzalez, and Greg Allen were a combined 1.5 wins below replacement. Slightly below-average play from Tyler Naquin, Jordan Luplow, and Oscar Mercado in fewer plate appearances were not enough to bring the outfield to even replacement level during this time.
  • Mike Clevinger was hurt after just a few starts while Kluber missed a month. Even with Carlos Carrasco, Bauer, and Shane Bieber all pitching reasonably well, the rotation took a hit.

Read the rest of this entry »


Predicting the 2019 Trade Deadline

With just a week to go before the trade deadline, it still isn’t entirely clear which teams will endeavor to make additions for a pennant run, and which teams will cash in their 2019 chips to play for another year. In the American League, nine of 15 teams have at least an outside shot at the postseason, with seven clubs having a legitimate chance. The National League is even more competitive, with every team but the Marlins possessing some chance at the playoffs, and eight clubs having a reasonable path to the postseason.

Below, we’ll go through the trade scenarios for the teams considering moves. Keep in mind, much of these proposed swaps are simply a framework for how a deal might look. Also important to keep in mind? Most of these predictions will be completely incorrect! Please consume the deals below responsibly, and use this as a preview of what teams need, want, and might do over the next week. Unless any of the predicted deals happen; in that case, I expect to receive full credit.

First, some things that won’t happen:

Star Pitchers Are Staying Put

The Tigers aren’t likely to get the kind of offer they want for Matthew Boyd, who has given up 15 homers in his last eight starts. The Mets aren’t going to get the young stars they want for Noah Syndergaard. Cleveland seems less likely to deal Trevor Bauer now that they are back in the race. Zack Greinke and Robbie Ray probably aren’t going anywhere. Even Caleb Smith of the Marlins, or Brad Keller and Jake Junis of the Royals, seem destined to stay put.

The big question remaining is San Francisco, which brings us to a few things that will (maybe) happen: Read the rest of this entry »


The Trade Value Series Skews Young (Again)

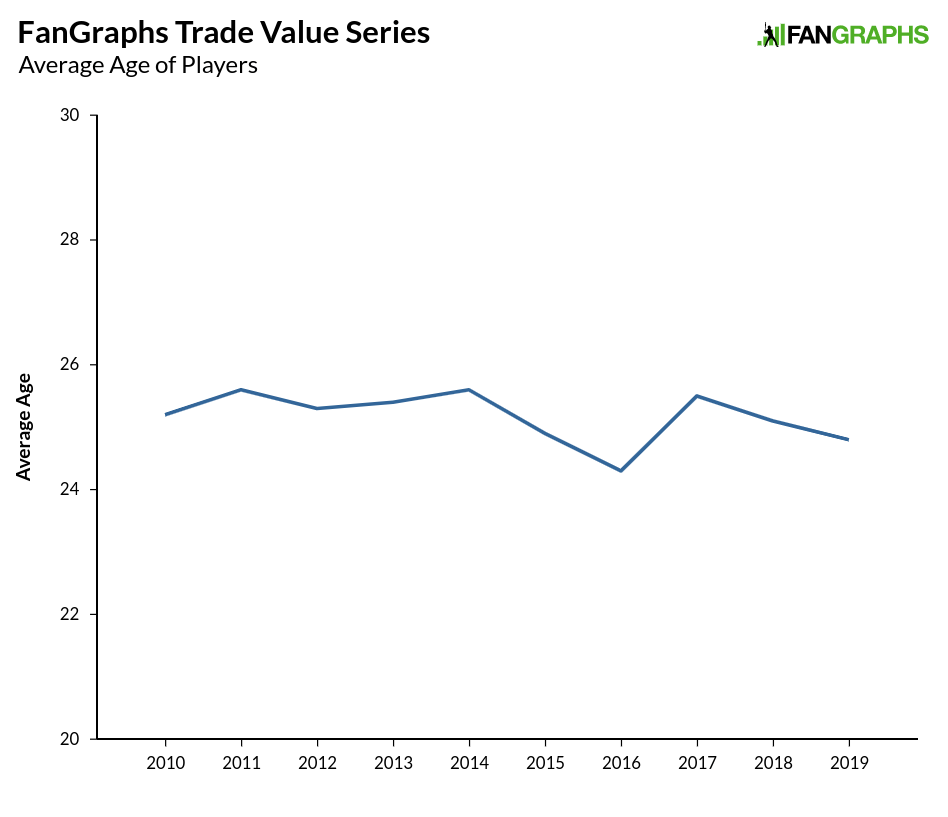
Today, we wrapped the 2019 Trade Value Series. The series always offers a number of a interesting insights into the industry’s thinking leading up to the deadline, and serves as a reminder that younger players tend to have considerably more trade value than their older peers. There are multiple reasons for that phenomenon. First, younger players are cheap. Owners and players have agreed to a system that pays players around half a million dollars for the first three seasons of their major league careers, followed by another three or four years of arbitration during which salaries increase gradually, but are only guaranteed for a single season at a time, limiting risk for teams. Then, after six full seasons in the big leagues, players hit the free agent market, where every team is welcome to bid for a player’s services. As a result, players who reach free agency tend to have much higher salaries than their younger teammates. It stands to reason when determining trade value, then, that, assuming an equal level of play from a younger and an older player, teams would value the younger player more highly because said player is cheaper.

The logic above can be seen pretty clearly in this year’s Trade Value Series, as well as those of the past decade. The graph below shows the average age of the players featured in the Trade Value Series over the last 10 years, with the first eight installments of the exercise conducted by Dave Cameron and the last two performed by Kiley McDaniel.

Read the rest of this entry »


Craig Edwards FanGraphs Chat–7/18/2019

Read the rest of this entry »


Where are the 60 Home Run Hitters?

There have been a lot of homers in baseball this season. Perhaps too many, as Jay Jaffe wrote back in June. At its current pace, the majors will average 227 home runs per team, clobbering the 2017 mark of 204 and coming in way ahead of last year’s 186 mark. When Barry Bonds broke the single-season home run record in 2001, the major league team average was 182. When McGwire and Sosa dueled, it was 169. When Roger Maris broke Babe Ruth’s record, the team average was 152. So how is it that we have a 50% increase in home runs from the time Maris hit 61, and a 22% increase over last year, and yet still don’t have a player likely to hit 60 homers?

Here are this year’s home run leaders through Tuesday’s games along with their projected total, their current pace based on team games, and the number of homers per 700 plate appearances (which will be more important later):

MLB Home Run Leaders
Name PA HR Projected Pace HR/700 PA
Cody Bellinger 401 34 50 57 59
Christian Yelich 388 33 47 56 60
Mike Trout 402 30 48 51 52
Peter Alonso 394 30 45 52 53
Edwin Encarnacion 377 28 44 49 52
Josh Bell 408 27 39 47 46
Hunter Renfroe 304 27 43 47 62
Franmil Reyes 314 26 40 45 58
Max Muncy 381 25 38 42 46
Freddie Freeman 426 25 38 42 41
Mike Moustakas 382 25 38 42 46
Jorge Soler 395 25 37 42 44
Through July 16, 2019

Projections, which are admittedly somewhat conservative, expect there to be one 50-homer hitter at the end of the year (Cody Bellinger), as well as a handful of players with at least 40 homers. Even if we go by pace and the hitters hit exactly was well as they have up to this point, Bellinger and Yelich will have great seasons but fall a few homers shy of 60. Yelich and Hunter Renfroe are the only players on a 60-homer pace if they were to get to 700 plate appearances. While all the home runs being hit might make it seem like a 60-homer season should happen, the sheer number of homers in the game don’t actually dictate what the league leader might do. The graph below shows the average number of home runs by team per year along with the home run leader for that season: Read the rest of this entry »