After having typically appeared in the hallowed pages of Baseball Think Factory, Dan Szymborski’s ZiPS projections have now been released at FanGraphs for more than half a decade. The exercise continues this offseason. Below are the projections for the Milwaukee Brewers.
Batters
With the position players, we have the sizzle that moved the Brewers from an adequate team to a very good one, thanks to the additions of last year’s best, high-profile free agent signing in Lorenzo Cain and the best, high-profile trade in Christian Yelich. ZiPS was a believer in both — I peppered my articles last winter with predictions of a Yelich breakout and Cain as the best free agent hitter available after J.D. Martinez — so the two of them having MVP-type seasons hardly should make ZiPS sour on them. And it didn’t! Sure, Cain turns 33 early in the season, but his defense hasn’t declined as of yet. Indeed, he may actually be underrated at this point; he should have made a minimum of four All-Star appearances rather than a measly two.
I feel for Manny Pina, who is essentially getting pushed aside for Yasmani Grandal, and while the Brewers absolutely should prefer Grandal — he’s younger, better, and signed to a ridiculously team-friendly contract — Pina’s been perfectly adequate behind the plate. The depth charts have Kratz backing up Grandal, but I’d suspect that in a time when the catcher position is weak around baseball, Milwaukee will trade Pina, or play him for a bit before leaving him open to a waiver claim later in the spring.
I’m kind of sad that Arcia’s projection for 2019 is so light on WAR. He’s always been a favorite of mine, but if he’s not matching his minor league glove reputation in the majors, he’s not much of a starter unless his bat rebounds in a big way.
Pitchers
ZiPS is once again more bullish on the Brew Crew’s starting pitching than Steamer is this year, but it still doesn’t see any of the Brewers as an obvious ace type. It’s easy for people criticize Steamer based on the current depth charts, but I think people are underestimating the challenges of projecting essentially the entire Brewer rotation. Each pitcher who is likely to contribute has at least something that makes it difficult for any prognosticator to do their job. Let’s take a look.
Jhoulys Chacin beat his FIP by half-a-run thanks to a .250 BABIP. He’s shown no signs of being able to do this repeatedly in the past, but also spent a lot of his career at Coors, which is obviously an extremely difficult environment for a pitcher.
Zach Davies looked like he was becoming a solid No. 2 or 3 guy, but missed significant time with shoulder injury in 2018.
When it comes to Chase Anderson, well, there’s beating your FIP, and there’s beating your FIP, and Anderson did the latter in 2018, besting it by nearly a run-and-a-third. ZiPS buys that there’s some ability here, but just how big that ability is remains up in the air.
Brandon Woodruff was up-and-down all year after struggling early, but will likely to get rotation spot despite only four major league starts in 2018 (he had more in the minors).
Jimmy Nelson missed the entire 2018 season due to shoulder surgery. Corbin Burnes has yet to make a major league start. Freddy Peralta has a stat profile that looks like that of a guy who throws 97 rather than 90-91.
ZiPS was closer when it came to the Brewers last year, but that’s not necessarily predictive; it wouldn’t take a lot for Steamer to win this battle. I’m less certain about the Brewers’ projections, at least on the pitching side, than I am most others this offseason.
Bench and Prospects
ZiPS buys Keston Hiura, and while it doesn’t have him becoming prime Dan Uggla or anything — I’m not sure why I chose Uggla here — the computer thinks that he’ll force his way into a job fairly quickly. I don’t think the Brewers will do with him what the White Sox did with Eloy Jimenez, and I suspect that if they weren’t going to give Hiura every opportunity to clear the field this summer, they’d have tendered Jonathan Schoop a contract.
The projections now have Mauricio Dubon as the equal of Arcia, though a large part of that has to do with Arcia’s forgettable 2018 season. That the projection is damning with faint praise is further evidenced by the fact that ZiPS sees Tyler Saladino as roughly equivalent as well. After Hiura, Dubon, Trey Supak, and Zack Brown, ZiPS sees the quality falling off very quickly, not expecting Corey Ray to ever make enough contact to be an effective major league hitter, or Lucas Ercerg to be better than a reserve.
One pedantic note for 2019: for the WAR graphic, I’m using FanGraphs’ depth chart playing time, not the playing time ZiPS spits out, so there will be occasional differences in WAR totals.
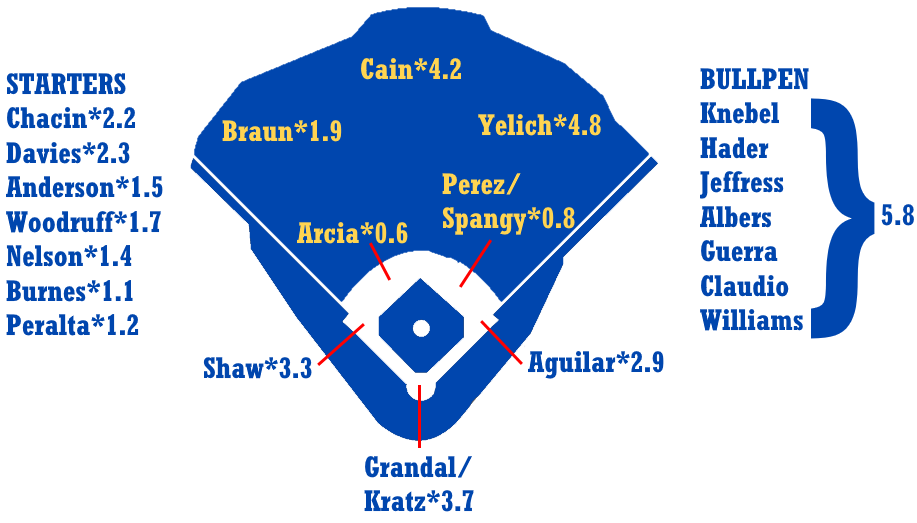
Ballpark graphic courtesy Eephus League. Depth charts constructed by way of those listed here at site.
Batters – Counting Stats
| Player |
B |
Age |
PO |
G |
AB |
R |
H |
2B |
3B |
HR |
RBI |
BB |
SO |
SB |
CS |
| Christian Yelich |
L |
27 |
RF |
154 |
590 |
102 |
176 |
38 |
5 |
28 |
103 |
73 |
142 |
19 |
4 |
| Lorenzo Cain |
R |
33 |
CF |
132 |
506 |
78 |
145 |
23 |
3 |
11 |
45 |
53 |
92 |
23 |
5 |
| Yasmani Grandal |
B |
30 |
C |
128 |
403 |
55 |
96 |
19 |
1 |
23 |
69 |
68 |
122 |
1 |
2 |
| Travis Shaw |
L |
29 |
3B |
142 |
489 |
71 |
124 |
27 |
1 |
26 |
85 |
62 |
120 |
5 |
1 |
| Mike Moustakas |
L |
30 |
3B |
140 |
528 |
68 |
141 |
28 |
1 |
32 |
97 |
41 |
94 |
2 |
1 |
| Jesus Aguilar |
R |
29 |
1B |
153 |
465 |
69 |
120 |
23 |
1 |
28 |
95 |
50 |
133 |
0 |
0 |
| Ryan Braun |
R |
35 |
LF |
113 |
398 |
59 |
107 |
22 |
2 |
18 |
65 |
36 |
86 |
11 |
4 |
| Manny Pina |
R |
32 |
C |
95 |
304 |
37 |
75 |
16 |
1 |
8 |
36 |
21 |
64 |
2 |
0 |
| Eric Thames |
L |
32 |
1B |
112 |
367 |
61 |
84 |
19 |
3 |
23 |
60 |
52 |
138 |
8 |
2 |
| Christian Bethancourt |
R |
27 |
C |
114 |
365 |
42 |
86 |
19 |
0 |
15 |
50 |
16 |
89 |
4 |
1 |
| Keston Hiura |
R |
22 |
2B |
122 |
491 |
57 |
127 |
26 |
6 |
12 |
49 |
31 |
125 |
11 |
10 |
| Ben Gamel |
L |
27 |
LF |
140 |
479 |
65 |
128 |
27 |
8 |
9 |
53 |
44 |
108 |
10 |
4 |
| Stephen Vogt |
L |
34 |
C |
116 |
372 |
43 |
93 |
20 |
2 |
15 |
56 |
35 |
77 |
0 |
1 |
| Erik Kratz |
R |
39 |
C |
77 |
241 |
26 |
57 |
10 |
0 |
8 |
28 |
14 |
55 |
2 |
0 |
| Brad Miller |
L |
29 |
1B |
115 |
366 |
44 |
87 |
20 |
4 |
15 |
55 |
45 |
112 |
4 |
2 |
| Cory Spangenberg |
L |
28 |
3B |
137 |
419 |
52 |
103 |
18 |
5 |
13 |
49 |
33 |
140 |
11 |
3 |
| Orlando Arcia |
R |
24 |
SS |
153 |
514 |
54 |
127 |
22 |
3 |
10 |
50 |
33 |
118 |
13 |
6 |
| Tyrone Taylor |
R |
25 |
CF |
124 |
453 |
53 |
109 |
18 |
5 |
13 |
53 |
25 |
92 |
10 |
4 |
| Hernan Perez |
R |
28 |
2B |
141 |
392 |
42 |
100 |
18 |
3 |
11 |
45 |
18 |
85 |
15 |
4 |
| Mauricio Dubon |
R |
24 |
SS |
113 |
446 |
50 |
111 |
21 |
3 |
8 |
43 |
24 |
88 |
19 |
9 |
| Nate Orf |
R |
29 |
2B |
121 |
428 |
53 |
96 |
20 |
3 |
6 |
37 |
42 |
94 |
11 |
3 |
| Tyler Saladino |
R |
29 |
SS |
92 |
290 |
33 |
66 |
10 |
3 |
6 |
28 |
24 |
74 |
10 |
3 |
| Troy Stokes |
R |
23 |
LF |
131 |
490 |
63 |
101 |
21 |
5 |
17 |
57 |
54 |
168 |
16 |
6 |
| Max McDowell |
R |
25 |
C |
86 |
288 |
30 |
59 |
11 |
1 |
3 |
21 |
25 |
75 |
5 |
2 |
| Jake Hager |
R |
26 |
SS |
100 |
376 |
38 |
87 |
19 |
3 |
7 |
37 |
23 |
86 |
5 |
3 |
| Tyler Heineman |
B |
28 |
C |
74 |
244 |
28 |
54 |
12 |
0 |
3 |
19 |
25 |
46 |
2 |
1 |
| Corey Ray |
L |
24 |
CF |
122 |
494 |
59 |
101 |
24 |
5 |
16 |
55 |
47 |
205 |
24 |
8 |
| Jacob Nottingham |
R |
24 |
C |
90 |
313 |
36 |
63 |
13 |
2 |
11 |
37 |
25 |
121 |
3 |
2 |
| Tuffy Gosewisch |
R |
35 |
C |
75 |
242 |
23 |
46 |
12 |
1 |
4 |
21 |
19 |
67 |
0 |
1 |
| Andres Blanco |
B |
35 |
2B |
103 |
257 |
30 |
59 |
14 |
2 |
6 |
28 |
21 |
51 |
3 |
2 |
| Lucas Erceg |
L |
24 |
3B |
123 |
479 |
51 |
111 |
23 |
2 |
11 |
49 |
31 |
114 |
3 |
3 |
| Shane Opitz |
L |
27 |
3B |
76 |
221 |
22 |
47 |
9 |
2 |
2 |
17 |
17 |
52 |
4 |
2 |
| Richie Shaffer |
R |
28 |
1B |
110 |
383 |
48 |
75 |
18 |
1 |
19 |
51 |
42 |
168 |
2 |
1 |
| Jake Gatewood |
R |
23 |
1B |
115 |
441 |
52 |
98 |
22 |
2 |
16 |
55 |
32 |
167 |
3 |
2 |
| Weston Wilson |
R |
24 |
1B |
114 |
424 |
46 |
93 |
18 |
3 |
9 |
42 |
27 |
130 |
5 |
6 |
| Blake Allemand |
B |
26 |
2B |
107 |
372 |
38 |
84 |
15 |
2 |
6 |
31 |
26 |
92 |
2 |
4 |
| Trent Grisham |
L |
22 |
RF |
122 |
415 |
52 |
83 |
13 |
4 |
9 |
36 |
64 |
137 |
15 |
5 |
| Luis Aviles |
R |
24 |
SS |
130 |
471 |
45 |
97 |
17 |
3 |
6 |
36 |
28 |
169 |
21 |
8 |
| Clint Coulter |
R |
25 |
RF |
115 |
394 |
44 |
81 |
18 |
3 |
13 |
46 |
27 |
138 |
2 |
3 |
| Gabriel Noriega |
R |
28 |
3B |
86 |
241 |
20 |
49 |
6 |
0 |
3 |
16 |
9 |
73 |
1 |
2 |
Batters – Rate Stats
| Player |
PA |
BA |
OBP |
SLG |
OPS+ |
ISO |
BABIP |
RC/27 |
Def |
WAR |
No. 1 Comp |
| Christian Yelich |
673 |
.298 |
.379 |
.522 |
136 |
.224 |
.352 |
7.8 |
3 |
5.2 |
Carl Yastrzemski |
| Lorenzo Cain |
568 |
.287 |
.359 |
.409 |
104 |
.123 |
.333 |
5.9 |
10 |
3.8 |
Robin Yount |
| Yasmani Grandal |
475 |
.238 |
.349 |
.462 |
113 |
.223 |
.283 |
5.6 |
2 |
3.2 |
Frankie Hayes |
| Travis Shaw |
560 |
.254 |
.340 |
.472 |
113 |
.219 |
.286 |
5.9 |
2 |
3.2 |
Eric Chavez |
| Mike Moustakas |
580 |
.267 |
.324 |
.506 |
116 |
.239 |
.271 |
6.0 |
0 |
3.2 |
Graig Nettles |
| Jesus Aguilar |
526 |
.258 |
.333 |
.492 |
115 |
.234 |
.303 |
6.0 |
4 |
2.4 |
Matt LeCroy |
| Ryan Braun |
440 |
.269 |
.332 |
.470 |
110 |
.201 |
.303 |
5.8 |
0 |
1.5 |
Al Simmons |
| Manny Pina |
334 |
.247 |
.303 |
.385 |
81 |
.138 |
.289 |
4.3 |
5 |
1.3 |
Charlie Berry |
| Eric Thames |
427 |
.229 |
.333 |
.485 |
114 |
.256 |
.296 |
5.8 |
-4 |
1.2 |
David Dellucci |
| Christian Bethancourt |
386 |
.236 |
.267 |
.411 |
76 |
.175 |
.272 |
3.9 |
5 |
1.1 |
Rod Barajas |
| Keston Hiura |
534 |
.259 |
.315 |
.409 |
90 |
.151 |
.325 |
4.5 |
-2 |
1.0 |
Tony Batista |
| Ben Gamel |
530 |
.267 |
.331 |
.413 |
96 |
.146 |
.329 |
5.1 |
-2 |
0.9 |
David DeJesus |
| Stephen Vogt |
413 |
.250 |
.315 |
.435 |
97 |
.185 |
.279 |
4.9 |
-8 |
0.8 |
Bill Freehan |
| Erik Kratz |
263 |
.237 |
.294 |
.378 |
77 |
.141 |
.275 |
4.0 |
3 |
0.8 |
Pat Borders |
| Brad Miller |
416 |
.238 |
.320 |
.437 |
99 |
.199 |
.301 |
5.0 |
0 |
0.8 |
Mike Maksudian |
| Cory Spangenberg |
461 |
.246 |
.306 |
.406 |
87 |
.160 |
.338 |
4.6 |
-4 |
0.7 |
Mark Teahen |
| Orlando Arcia |
553 |
.247 |
.294 |
.360 |
73 |
.113 |
.303 |
3.8 |
2 |
0.6 |
Ronny Cedeno |
| Tyrone Taylor |
486 |
.241 |
.285 |
.389 |
77 |
.148 |
.276 |
4.0 |
2 |
0.6 |
Wendell Magee |
| Hernan Perez |
415 |
.255 |
.286 |
.401 |
80 |
.145 |
.301 |
4.3 |
0 |
0.6 |
Frank White |
| Mauricio Dubon |
483 |
.249 |
.288 |
.363 |
72 |
.114 |
.294 |
3.8 |
1 |
0.5 |
Diory Hernandez |
| Nate Orf |
489 |
.224 |
.307 |
.327 |
69 |
.103 |
.274 |
3.6 |
3 |
0.5 |
Brian Harris |
| Tyler Saladino |
321 |
.228 |
.292 |
.345 |
68 |
.117 |
.286 |
3.7 |
2 |
0.5 |
Chris Clapinski |
| Troy Stokes |
557 |
.206 |
.295 |
.373 |
76 |
.167 |
.275 |
3.8 |
5 |
0.4 |
Ryan Lane |
| Max McDowell |
328 |
.205 |
.288 |
.281 |
53 |
.076 |
.267 |
2.8 |
6 |
0.3 |
Brian Moon |
| Jake Hager |
408 |
.231 |
.278 |
.354 |
67 |
.122 |
.283 |
3.4 |
2 |
0.2 |
Ed Brinkman |
| Tyler Heineman |
276 |
.221 |
.297 |
.307 |
61 |
.086 |
.262 |
3.2 |
2 |
0.2 |
Dennis Anderson |
| Corey Ray |
546 |
.204 |
.277 |
.370 |
70 |
.166 |
.311 |
3.6 |
1 |
0.2 |
Brad Snyder |
| Jacob Nottingham |
348 |
.201 |
.277 |
.361 |
68 |
.160 |
.287 |
3.3 |
-1 |
0.1 |
Yohanny Valera |
| Tuffy Gosewisch |
269 |
.190 |
.258 |
.298 |
47 |
.107 |
.246 |
2.5 |
4 |
-0.2 |
Joe Oliver |
| Andres Blanco |
286 |
.230 |
.301 |
.370 |
77 |
.140 |
.265 |
3.9 |
-5 |
-0.2 |
Geoff Blum |
| Lucas Erceg |
516 |
.232 |
.280 |
.357 |
68 |
.125 |
.282 |
3.4 |
1 |
-0.2 |
Jose Valdez |
| Shane Opitz |
243 |
.213 |
.270 |
.299 |
51 |
.086 |
.269 |
2.8 |
4 |
-0.3 |
Jhonny Carvajal |
| Richie Shaffer |
431 |
.196 |
.281 |
.397 |
77 |
.201 |
.286 |
3.7 |
-2 |
-0.5 |
Danny Peoples |
| Jake Gatewood |
479 |
.222 |
.278 |
.390 |
75 |
.168 |
.318 |
3.7 |
1 |
-0.5 |
Rich Murray |
| Weston Wilson |
460 |
.219 |
.272 |
.340 |
61 |
.120 |
.295 |
3.0 |
7 |
-0.8 |
Marco Pernalete |
| Blake Allemand |
405 |
.226 |
.284 |
.325 |
62 |
.099 |
.285 |
3.1 |
-4 |
-0.9 |
Lionel Hastings |
| Trent Grisham |
487 |
.200 |
.308 |
.316 |
67 |
.116 |
.275 |
3.4 |
-3 |
-0.9 |
Roger Bernadina |
| Luis Aviles |
506 |
.206 |
.254 |
.293 |
45 |
.087 |
.307 |
2.6 |
3 |
-0.9 |
Dave Detienne |
| Clint Coulter |
433 |
.206 |
.270 |
.365 |
67 |
.160 |
.280 |
3.3 |
-3 |
-1.1 |
Dustan Mohr |
| Gabriel Noriega |
256 |
.203 |
.232 |
.266 |
32 |
.062 |
.279 |
2.0 |
0 |
-1.4 |
Toby Gardenhire |
Pitchers – Counting Stats
| Player |
T |
Age |
W |
L |
ERA |
G |
GS |
IP |
H |
ER |
HR |
BB |
SO |
| Freddy Peralta |
R |
23 |
10 |
7 |
4.01 |
30 |
27 |
132.3 |
103 |
59 |
18 |
75 |
178 |
| Zach Davies |
R |
26 |
10 |
9 |
4.26 |
28 |
28 |
145.7 |
152 |
69 |
18 |
45 |
109 |
| Corbin Burnes |
R |
24 |
9 |
7 |
3.92 |
49 |
19 |
135.3 |
127 |
59 |
17 |
49 |
131 |
| Jhoulys Chacin |
R |
31 |
11 |
10 |
4.33 |
32 |
31 |
166.3 |
161 |
80 |
21 |
67 |
134 |
| Gio Gonzalez |
L |
33 |
10 |
9 |
4.38 |
29 |
29 |
158.3 |
154 |
77 |
19 |
69 |
139 |
| Josh Hader |
L |
25 |
5 |
2 |
2.95 |
59 |
0 |
73.3 |
46 |
24 |
10 |
35 |
125 |
| Jimmy Nelson |
R |
30 |
8 |
7 |
4.30 |
21 |
21 |
121.3 |
122 |
58 |
16 |
46 |
107 |
| Brandon Woodruff |
R |
26 |
6 |
6 |
4.21 |
32 |
23 |
117.7 |
113 |
55 |
14 |
47 |
112 |
| Chase Anderson |
R |
31 |
8 |
8 |
4.47 |
28 |
28 |
141.0 |
141 |
70 |
26 |
50 |
114 |
| Brent Suter |
L |
29 |
7 |
6 |
4.08 |
25 |
18 |
103.7 |
107 |
47 |
14 |
24 |
82 |
| Corey Knebel |
R |
27 |
4 |
2 |
2.90 |
64 |
0 |
62.0 |
44 |
20 |
7 |
28 |
95 |
| Trey Supak |
R |
23 |
7 |
7 |
4.48 |
26 |
24 |
122.7 |
125 |
61 |
14 |
57 |
101 |
| Alex Claudio |
L |
27 |
4 |
2 |
3.33 |
67 |
1 |
75.7 |
76 |
28 |
5 |
15 |
49 |
| Junior Guerra |
R |
34 |
6 |
6 |
4.46 |
26 |
22 |
119.0 |
114 |
59 |
18 |
51 |
107 |
| Jeremy Jeffress |
R |
31 |
5 |
3 |
3.12 |
66 |
0 |
66.3 |
57 |
23 |
5 |
26 |
68 |
| Aaron Wilkerson |
R |
30 |
6 |
6 |
4.63 |
22 |
18 |
101.0 |
102 |
52 |
15 |
39 |
90 |
| Jake Thompson |
R |
25 |
8 |
8 |
4.98 |
39 |
20 |
128.3 |
131 |
71 |
20 |
62 |
103 |
| Jacob Barnes |
R |
29 |
2 |
1 |
3.65 |
61 |
0 |
61.7 |
56 |
25 |
5 |
29 |
61 |
| Xavier Cedeno |
L |
32 |
2 |
1 |
3.55 |
62 |
0 |
45.7 |
41 |
18 |
4 |
19 |
45 |
| Dan Jennings |
L |
32 |
4 |
3 |
3.79 |
65 |
0 |
57.0 |
57 |
24 |
4 |
24 |
41 |
| Josh Tomlin |
R |
34 |
5 |
6 |
5.03 |
26 |
16 |
96.7 |
107 |
54 |
22 |
12 |
71 |
| Michael Brady |
R |
32 |
3 |
3 |
4.70 |
28 |
7 |
67.0 |
73 |
35 |
12 |
12 |
53 |
| Deolis Guerra |
R |
30 |
3 |
2 |
4.09 |
42 |
2 |
55.0 |
53 |
25 |
8 |
17 |
56 |
| Zack Brown |
R |
24 |
5 |
6 |
5.12 |
23 |
21 |
110.7 |
118 |
63 |
19 |
48 |
91 |
| Bobby Wahl |
R |
27 |
3 |
3 |
4.12 |
42 |
1 |
43.7 |
35 |
20 |
6 |
27 |
62 |
| Thomas Jankins |
R |
23 |
8 |
10 |
5.18 |
24 |
21 |
123.3 |
141 |
71 |
20 |
44 |
81 |
| Jake Petricka |
R |
31 |
2 |
2 |
4.20 |
52 |
0 |
60.0 |
63 |
28 |
6 |
21 |
45 |
| Bubba Derby |
R |
25 |
5 |
6 |
5.25 |
29 |
16 |
109.7 |
120 |
64 |
20 |
51 |
91 |
| Angel Perdomo |
L |
25 |
4 |
4 |
5.29 |
24 |
15 |
80.0 |
78 |
47 |
11 |
56 |
75 |
| Tristan Archer |
R |
28 |
4 |
4 |
4.38 |
50 |
1 |
76.0 |
78 |
37 |
10 |
25 |
63 |
| Jon Olczak |
R |
25 |
6 |
5 |
4.22 |
44 |
0 |
53.3 |
52 |
25 |
6 |
25 |
50 |
| Matt Albers |
R |
36 |
3 |
3 |
4.35 |
42 |
0 |
41.3 |
41 |
20 |
7 |
12 |
39 |
| Adrian Houser |
R |
26 |
3 |
4 |
5.42 |
27 |
20 |
88.0 |
98 |
53 |
16 |
37 |
69 |
| Quintin Torres-Costa |
L |
24 |
4 |
4 |
4.31 |
44 |
0 |
54.3 |
47 |
26 |
6 |
35 |
63 |
| Taylor Williams |
R |
27 |
2 |
2 |
4.34 |
60 |
0 |
56.0 |
56 |
27 |
7 |
27 |
58 |
| Boone Logan |
L |
34 |
1 |
1 |
4.30 |
36 |
0 |
23.0 |
20 |
11 |
3 |
15 |
28 |
| Erik Davis |
R |
32 |
4 |
5 |
4.55 |
45 |
0 |
55.3 |
54 |
28 |
7 |
31 |
53 |
| Erik Kratz |
R |
39 |
0 |
0 |
6.75 |
3 |
0 |
2.7 |
3 |
2 |
1 |
1 |
2 |
| Miguel Sanchez |
R |
25 |
2 |
2 |
4.76 |
34 |
0 |
58.7 |
55 |
31 |
11 |
30 |
68 |
| Conor Harber |
R |
25 |
5 |
7 |
5.38 |
28 |
15 |
97.0 |
101 |
58 |
11 |
74 |
73 |
| Hernan Perez |
R |
28 |
0 |
0 |
7.36 |
3 |
0 |
3.7 |
5 |
3 |
1 |
1 |
2 |
| Brad Kuntz |
L |
27 |
3 |
3 |
4.94 |
35 |
2 |
51.0 |
51 |
28 |
7 |
29 |
46 |
| Paolo Espino |
R |
32 |
5 |
6 |
5.48 |
23 |
15 |
88.7 |
96 |
54 |
21 |
29 |
79 |
| Cody Ponce |
R |
25 |
6 |
8 |
5.46 |
26 |
15 |
95.7 |
109 |
58 |
18 |
38 |
70 |
| Cam Roegner |
L |
26 |
6 |
8 |
5.92 |
24 |
21 |
100.3 |
117 |
66 |
19 |
49 |
63 |
| Braden Webb |
R |
24 |
6 |
8 |
5.77 |
24 |
22 |
101.3 |
105 |
65 |
16 |
78 |
92 |
| Burch Smith |
R |
29 |
3 |
4 |
5.74 |
32 |
7 |
69.0 |
72 |
44 |
13 |
40 |
66 |
| Marcos Diplan |
R |
22 |
5 |
8 |
5.82 |
25 |
23 |
106.7 |
111 |
69 |
14 |
93 |
92 |
| Nate Griep |
R |
25 |
2 |
2 |
5.33 |
53 |
0 |
52.3 |
52 |
31 |
5 |
42 |
43 |
Pitchers – Rate Stats
| Player |
TBF |
K/9 |
BB/9 |
HR/9 |
BABIP |
ERA+ |
ERA- |
FIP |
WAR |
No. 1 Comp |
| Freddy Peralta |
575 |
12.11 |
5.10 |
1.22 |
.286 |
109 |
91 |
4.09 |
2.2 |
Jason Bere |
| Zach Davies |
630 |
6.73 |
2.78 |
1.11 |
.297 |
103 |
97 |
4.33 |
2.1 |
Early Wynn |
| Corbin Burnes |
581 |
8.71 |
3.26 |
1.13 |
.293 |
108 |
92 |
4.11 |
2.1 |
Bob Moose |
| Jhoulys Chacin |
724 |
7.25 |
3.63 |
1.14 |
.284 |
98 |
102 |
4.55 |
2.0 |
Bill Singer |
| Gio Gonzalez |
692 |
7.90 |
3.92 |
1.08 |
.293 |
97 |
103 |
4.36 |
1.8 |
Bill Hallahan |
| Josh Hader |
301 |
15.34 |
4.30 |
1.23 |
.281 |
149 |
67 |
3.07 |
1.6 |
Mitch Williams |
| Jimmy Nelson |
532 |
7.94 |
3.41 |
1.19 |
.299 |
99 |
101 |
4.46 |
1.5 |
Elmer Riddle |
| Brandon Woodruff |
511 |
8.57 |
3.59 |
1.07 |
.298 |
101 |
99 |
4.14 |
1.5 |
Pat Rapp |
| Chase Anderson |
609 |
7.28 |
3.19 |
1.66 |
.278 |
95 |
105 |
5.12 |
1.4 |
Andy Messersmith |
| Brent Suter |
438 |
7.12 |
2.08 |
1.22 |
.296 |
104 |
96 |
4.13 |
1.4 |
Stubby Overmire |
| Corey Knebel |
258 |
13.79 |
4.06 |
1.02 |
.296 |
147 |
68 |
3.05 |
1.3 |
Jim Kern |
| Trey Supak |
548 |
7.41 |
4.18 |
1.03 |
.301 |
95 |
105 |
4.55 |
1.3 |
Mike Mills |
| Alex Claudio |
315 |
5.83 |
1.78 |
0.59 |
.292 |
132 |
76 |
3.43 |
1.2 |
Sparky Lyle |
| Junior Guerra |
518 |
8.09 |
3.86 |
1.36 |
.284 |
95 |
105 |
4.70 |
1.2 |
Ken Hill |
| Jeremy Jeffress |
280 |
9.23 |
3.53 |
0.68 |
.291 |
136 |
73 |
3.35 |
1.2 |
Greg Minton |
| Aaron Wilkerson |
442 |
8.02 |
3.48 |
1.34 |
.297 |
95 |
106 |
4.61 |
1.0 |
Julian Tavarez |
| Jake Thompson |
575 |
7.22 |
4.35 |
1.40 |
.290 |
88 |
113 |
5.18 |
0.7 |
Joaquin Andujar |
| Jacob Barnes |
268 |
8.90 |
4.23 |
0.73 |
.298 |
117 |
86 |
3.73 |
0.6 |
Don McMahon |
| Xavier Cedeno |
195 |
8.87 |
3.74 |
0.79 |
.294 |
124 |
81 |
3.63 |
0.6 |
Don Hood |
| Dan Jennings |
249 |
6.47 |
3.79 |
0.63 |
.296 |
116 |
86 |
3.94 |
0.6 |
Darold Knowles |
| Josh Tomlin |
405 |
6.61 |
1.12 |
2.05 |
.286 |
87 |
114 |
5.11 |
0.5 |
Hal Brown |
| Michael Brady |
285 |
7.12 |
1.61 |
1.61 |
.299 |
93 |
107 |
4.61 |
0.4 |
Jose Bautista |
| Deolis Guerra |
233 |
9.16 |
2.78 |
1.31 |
.300 |
104 |
96 |
4.04 |
0.4 |
Jay Tessmer |
| Zack Brown |
496 |
7.40 |
3.90 |
1.55 |
.298 |
83 |
120 |
5.20 |
0.4 |
Ed Wojna |
| Bobby Wahl |
193 |
12.78 |
5.56 |
1.24 |
.302 |
107 |
94 |
4.09 |
0.3 |
Ryan Bukvich |
| Thomas Jankins |
552 |
5.91 |
3.21 |
1.46 |
.303 |
82 |
122 |
5.19 |
0.3 |
Nate Cornejo |
| Jake Petricka |
262 |
6.75 |
3.15 |
0.90 |
.305 |
105 |
96 |
4.15 |
0.3 |
Frank Linzy |
| Bubba Derby |
498 |
7.47 |
4.19 |
1.64 |
.303 |
84 |
120 |
5.42 |
0.3 |
Sean White |
| Angel Perdomo |
374 |
8.44 |
6.30 |
1.24 |
.296 |
83 |
120 |
5.39 |
0.2 |
Brian Snyder |
| Tristan Archer |
329 |
7.46 |
2.96 |
1.18 |
.300 |
97 |
103 |
4.35 |
0.2 |
Adrian Devine |
| Jon Olczak |
236 |
8.44 |
4.22 |
1.01 |
.303 |
101 |
99 |
4.31 |
0.2 |
Jerry Reed |
| Matt Albers |
176 |
8.49 |
2.61 |
1.52 |
.293 |
101 |
99 |
4.48 |
0.1 |
Mike Maddux |
| Adrian Houser |
397 |
7.06 |
3.78 |
1.64 |
.304 |
81 |
123 |
5.38 |
0.1 |
Mickey Callaway |
| Quintin Torres-Costa |
245 |
10.44 |
5.80 |
0.99 |
.297 |
99 |
101 |
4.36 |
0.1 |
Grant Jackson |
| Taylor Williams |
248 |
9.32 |
4.34 |
1.13 |
.316 |
98 |
102 |
4.20 |
0.1 |
Blaine Neal |
| Boone Logan |
105 |
10.96 |
5.87 |
1.17 |
.298 |
99 |
101 |
4.63 |
0.1 |
Marshall Bridges |
| Erik Davis |
250 |
8.62 |
5.04 |
1.14 |
.301 |
93 |
107 |
4.72 |
0.0 |
Dennis Higgins |
| Erik Kratz |
12 |
6.75 |
3.38 |
3.38 |
.250 |
63 |
159 |
7.65 |
0.0 |
Boom-Boom Beck |
| Miguel Sanchez |
261 |
10.43 |
4.60 |
1.69 |
.297 |
92 |
108 |
5.01 |
-0.1 |
Nguyen Van Phuoc |
| Conor Harber |
465 |
6.77 |
6.87 |
1.02 |
.299 |
79 |
126 |
5.59 |
-0.1 |
Tim Byron |
| Hernan Perez |
18 |
4.91 |
2.45 |
2.45 |
.308 |
58 |
173 |
7.24 |
-0.1 |
Alan Benes |
| Brad Kuntz |
232 |
8.12 |
5.12 |
1.24 |
.299 |
86 |
116 |
5.01 |
-0.1 |
Philip Barzilla |
| Paolo Espino |
390 |
8.02 |
2.94 |
2.13 |
.293 |
78 |
129 |
5.60 |
-0.1 |
Mark Knudson |
| Cody Ponce |
433 |
6.59 |
3.57 |
1.69 |
.302 |
78 |
128 |
5.51 |
-0.1 |
Tony Peguero |
| Cam Roegner |
465 |
5.65 |
4.40 |
1.70 |
.299 |
74 |
135 |
6.00 |
-0.4 |
Josh Shortslef |
| Braden Webb |
487 |
8.17 |
6.93 |
1.42 |
.303 |
74 |
136 |
5.90 |
-0.4 |
Jason Phillips |
| Burch Smith |
317 |
8.61 |
5.22 |
1.70 |
.303 |
74 |
135 |
5.56 |
-0.4 |
Marty McLeary |
| Marcos Diplan |
523 |
7.76 |
7.85 |
1.18 |
.306 |
73 |
137 |
5.94 |
-0.5 |
Jason Phillips |
| Nate Griep |
250 |
7.39 |
7.22 |
0.86 |
.299 |
80 |
125 |
5.33 |
-0.5 |
Dave Cole |
Disclaimer: ZiPS projections are computer-based projections of performance. Performances have not been allocated to predicted playing time in the majors — many of the players listed above are unlikely to play in the majors at all in 2019. ZiPS is projecting equivalent production — a .240 ZiPS projection may end up being .280 in AAA or .300 in AA, for example. Whether or not a player will play is one of many non-statistical factors one has to take into account when predicting the future.
Players are listed with their most recent teams, unless I have made a mistake. This is very possible, as a lot of minor-league signings go generally unreported in the offseason.
ZiPS’ projections are based on the American League having a 4.29 ERA and the National League having a 4.15 ERA.
Players who are expected to be out due to injury are still projected. More information is always better than less information, and a computer isn’t the tool that should project the injury status of, for example, a pitcher who has had Tommy John surgery.
Both hitters and pitchers are ranked by projected zWAR — which is to say, WAR values as calculated by me, Dan Szymborski, whose surname is spelled with a z. WAR values might differ slightly from those which appear in full release of ZiPS. Finally, I will advise anyone against — and might karate chop anyone guilty of — merely adding up WAR totals on a depth chart to produce projected team WAR.

 Dan Szymborski: Powered by bourbon and a few packs of Smarties, it’s the Dan Szymborski Chat!