Archive for Business

Major League Payrolls Set to Drop Again in 2019

Earlier this offseason, I wrote that even if everything broke right for the free agents who remained on the market, we’d see a roughly one percent increase in Opening Day payrolls compared to last year. At the time, I cautioned that things were not likely to break right for the remaining free agents, and that a similar exercise the year prior ended with a one percent drop on Opening Day. Even worse for the players, that one percent drop last season turned into a 2.5% drop by season’s end. Opening Day payrolls are down again in 2019 by roughly the same amount as last year. If last season’s scenario were to repeat itself, the players will be looking at a half-billion dollar swing in revenues to owners in 2019 alone even if we assume that the split between players and owners was 50/50 two seasons ago.

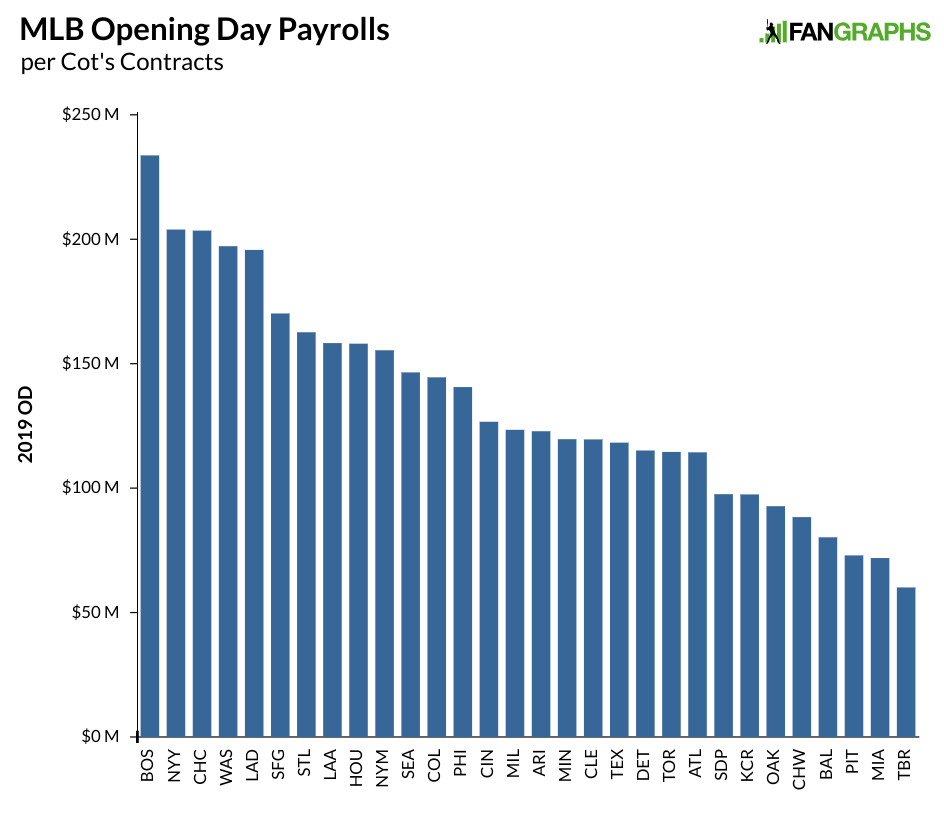
As we begin the 2019 season, here’s a look at every team’s Opening Day payroll, per Cot’s Contracts, which includes a team’s 25-man roster plus whatever other obligations they’ve accrued to players who are on the injured list or no longer with the club.

The Red Sox, coming off their World Series win and the highest major league payroll in 2018, look poised to repeat at least one of those designations this season with a decent shot at both. The Yankees appear just above $200 million this season after a major decline last season, though the team first crossed the $200 million barrier back in 2005, so it is hardly heady territory for them. The Cubs have seen their payroll rise as they try to augment their World Series-winning core with free agents, though they sat this winter out. The Nationals kept up spending after Bryce Harper’s departure, and Los Angeles looks to be trying to stay under the competitive balance tax for the second straight season after averaging a figure more than $50 million higher the previous three seasons. At the lower end of the spectrum, we see the usual suspects of smaller-market teams and traditionally weak-spenders. Read the rest of this entry »


What’s an Opt-Out Worth?

After Manny Machado and Bryce Harper signed their gargantuan free agent deals, dominos began to fall left and right across baseball — if you’re of sound body and mind, you probably recently signed a multi-year extension with a major league franchise. When a star signs a new contract of any type, articles analyzing the contract’s value are never far behind, and this recent extension spree has been no exception. I wanted to get in on the action, but the analysis has already been done for the most part. Search for a player who recently signed a contract, and you’ll find FanGraphs analysis of it, likely with some dollars-per-WAR analysis. Chris Sale? Jay Jaffe’s got you. Kiley McDaniel covered Eloy Jimenez’s extension. Justin Verlander? Jaffe again. You get the idea. Craig Edwards even wrote about Harper vs. Machado in an exhaustive level of depth, down to figuring out state taxes.

What’s an author to do? Well, there’s one angle that hasn’t been covered for a while, believe it or not. More accurately, it’s been covered by a combination of shrugs and mathematical hand waves: the value of the opt-out in Machado’s (and Nolan Arenado’s) contract. The reason these haven’t been sufficiently covered is simple — they’re difficult to value. If we want to figure out how many wins a player projects for, a methodology exists for that exercise. Sprinkle in a little of the aging curve and the dollar value of the contract, and there’s one level of analysis. If you want to put everything in present-day dollars, it’s just more arithmetic, but the basic shape remains similar. Introducing opt-outs, however, is a step in a wholly different direction.
Read the rest of this entry »


A Look at the Padres’ Finances

On the public side, there are few opportunities to see the precise financial machinations of major league baseball teams. The Atlanta Braves are a publicly traded company so we have some information on their inner-workings. And a recent piece by Kevin Acee at the San Diego Union Tribune provides a little bit more information. Acee was granted access to some of the Padres’ finances, though as Acee noted, the league keeps a close watch on financial information and generally doesn’t want it to get out:

The caveat from the club was that many of the numbers shared herein had to be “general.” The Padres are a private company and one of 30 members of a greater private organization. One member does not have the prerogative to make public financial data Major League Baseball has not approved for release.

The Padres’ decision to grant a reporter access to some of the team’s financial information is an unusual one, though the motivation is fairly clear. The Padres are still in the midst of a rebuilding process that isn’t likely to end this season. The club believes their window of contention isn’t yet open and as a result, they aren’t likely to spend big right now. A peek into the books, and the team’s debt, helps them provide further justification for that lack of spending. There is a lot of financial information disclosed in the article, and it is probably best to break things down a bit.

The Debt

The crux of Acee’s article involves a refinancing of the debt the team’s current owners have carried since purchasing the Padres. According to the article, that debt amounted to roughly $193 million at the time of the purchase back in 2012 — it was no doubt factored into the purchase price — and the interest rate on the loans was something like 8.5%. Due to the nature of the loan, which included a make-whole provision that would require paying extra for paying down the loan early, refinancing it to get a lower interest rate would have meant an extra payment of close to $70 million. As a result, the team elected to make payments on the loan, including interest payments of $13 million in 2015 alone.

By 2017, the make-whole penalty was down to $28 million and the club made a cash call for about half of that amount and used some of their MLBAM money for the rest. Reading between the lines here, the piece mentions a total of $68 million in money coming from the sale of BAMTech, with $50 million of that amount presumed to have been received last year. That means that the first sale of MLBAM to Disney, which netted the league one billion dollars, likely resulted in some smaller payment, perhaps $18 million, that was used by the Padres in their refinancing in 2017. The team appears to have further used about $45 million of the $50 million BAMTech proceeds to pay down additional debt. The club has now paid down 40% of the original $193 million, reducing interest payments to around $4 million, a savings of around $8 million per year, plus additional savings on principal payments. In short, the club took $15 million of owner money. plus nearly all the BAMTech money it received, and used it to make $10 million or more per year for the foreseeable future. It has obviously been a good investment for the owners, and the tenor of the article suggests that that money will be invested back into the club at some point in the future, likely, if team officials are to be believed, when the club is closer to contention.

The Minors

In 2016, the Padres were coming off a minor debacle in 2015 (more on that in a bit), having expended a decent amount of cash and prospect capital to attempt to contend. That attempt failed, and the Padres decided not to invest any more money in the major league ball club. Under baseball’s old international spending rules, teams could splurge on international prospects for a year before being restricted to more expenditures in the following two seasons. The Padres splurged like nobody had splurged before, spending around $40 million on prospects and around that amount on penalties. Between the major league payroll and the bonuses for the draft and international amateurs (and the penalties that followed), the team probably spent close to $200 million in 2016, with Acee’s piece indicating the owners pitched in about $20 million to make that happen.

As for the results, the Padres now have one of the best farm systems in baseball, and that 2016 class is a big reason for their success. As of the end of last season, the Padres had 12 players from that class alone receive a graded rank, including three who already project as average despite the fact that most of these players are under 20 years old. Those 12 prospects, including Adrian Morejon, Luis Patino, and Michael Baez, were already worth roughly $100 million by the end of last year. While it hasn’t impacted the results at the major league level yet, that investment should pay huge dividends going forward. As for investments that didn’t go so well…

The First Prellering

The Padres hired A.J. Preller in the middle of the 2014 season, and Preller aimed to make the team a contender the following year. He essentially traded Yasmani Grandal for Matt Kemp, then sent prospects to Atlanta for Justin Upton. He traded Joe Ross and Trea Turner, among others, for Wil Myers and others. James Shields was given a four-year contract. Right before the season started, he took on the money owed to B.J. Upton to get Craig Kimbrel. Those deals added about $20 million in payroll over the previous year and about $40 million over the 2013 campaign. The moves weren’t successful, although they weren’t quite the disaster the Union-Tribune piece and Padres ownership make them to be.

In the piece, the club claimed to have spent $40 million more for the season. That is partially true given they spent that much in new salaries, but when compared to the previous season, the additions were about half that much. Interestingly, the club indicated that all that movement netted the team an extra $15 million in ticket sales and concessions. While that number isn’t too far off from the payroll increase, we can glean more from that bit of information. From 2014 to 2015, the Padres increased attendance by 265,000 fans. Some simple math has the increase in revenue at about $57 per attendee. What’s interesting about that information is just how the attendance increase happened. The Padres’ gambit almost worked.

On June 13, the Padres had a .500 record, were five games out of first place, and three games out of the wild card. Over the next month, they went 9-17 and fell out of the playoff race. Through the trade deadline that season, the club was averaging 31,782 fans, but after the season went south, attendance the rest of the way dropped to 28,200. If the team had remained competitive and drawn the same amount, that potentially would have meant another $6.5 million in revenue, making the increase in payroll worth it. If the team had made the playoffs, the club would have come out ahead. Adding the declining Kemp, the unproven Myers, a one-inning closer in Kimbrel, and getting a below-average performance from Shields sunk the club in 2015, but the decision to go for it wasn’t necessarily bad; it just turned out that some of the players underperformed or were poor fits on the roster. And the added salary commitments ensured the team would spend millions on players who wouldn’t even be with the team after another season. Preller’s first go at building a contender failed; the second, as noted, had to take a different approach.

Revenue Estimates

The article doesn’t come out and say how much the Padres make, but there are a fair number of estimates. First, the piece says that interest payments went from 5% ($12.6 million in 2015) to 2% ($4.6 million in 2018) of the budget, which would put revenues somewhere between $252 million and $230 million, though a few decimal points of difference on the interest percentage significantly changes the total. Looking at their larger expenditures and the percentage of expenses might be more helpful. Roughly one-third of revenues have gone to major league salaries over the last four years, which would put average annual revenue at around $295 million. They have spent around 22% of revenue on operating expenses — that number is listed at $68 million, which would put revenues at around $310 million. Forbes last year estimated the Padres’ revenue at $266 million, which now looks like that might be a little low. I should also note that the team does spend money on stadium maintenance and improvements along with all those debt repayments, but that those amounts are taken out of net local revenue and serve to increase the amount of revenue sharing they receive from the league.

Looking Ahead

Acee’s whole piece is fascinating, and I recommend reading it in full. All of baseball has seen a considerable increase in revenue over the last few seasons, an increase from which the Padres have benefited. With their revenues, they have opted to pay down debt and make an international splash. Their payroll has been lower due to those decisions, and the amount of payroll we actually see on the field has been lower still, due to bad contracts taken on in trades and free agent signings for players who were later dealt with money attached. The explanation offered in the piece is pretty clear, and while the team wasn’t completely forthcoming, most of the information checks out. The team is asking fans to be patient for one more year. Building up the minor league system should eventually create a better on-field product at Petco, but the team’s debt reduction and refinancing does more to add to a franchise value that has already doubled since Executive Chairman Ron Fowler’s group took over seven years ago. The club will need to continue to invest in the big league product to demonstrate that this is more than just perpetually shifting fans’ expectations off into the future. It’s up to the fans to determine how much more losing they can stomach.

MLB Payroll Probably Isn’t Going Back Up in 2019

In 2018, for the first time in more than a decade, player salaries went down from the previous year. At one point, there was some thought that this offseason’s free agent class might reverse the course charted last offseason. For years, we’ve been hearing about the monster class of free agents that would sign this winter. Here’s Jeff Passan back near the beginning of the 2017 season:

For those who have yet to hear about the free-agent class of 2018-19, here’s a sampling: Bryce HarperManny MachadoClayton KershawJosh Donaldson, Daniel Murphy, Dallas Keuchel, Charlie Blackmon, Andrew Miller, Zach Britton, Craig Kimbrel. There are dozens more. Teams will guarantee $3 billion to players that winter. The number could exceed $4 billion.

Two years later, that free agent class isn’t quite as good as we expected. When we put up our Top-50 free agents, along with crowdsourced contract expectations, the expected outlay to 66 potential free agents didn’t come close the $3 billion assumed; the crowd predicted a number that was just about half of $4 billion that was thought possible about 20 months ago. Our readers provided estimates for 66 players, including Joe Mauer and Adrian Beltre, who have since retired. Of the remaining 64 players, 36 have signed contracts so far. Here’s how the contract totals compare to the crowdsourced average.

Free Agent Signings and Contract Predictions
Name Signing Team Proj WAR Crowd Average Contract Total Difference
Patrick Corbin WSN 3.5 102.3 M 140 M 37.7 M
Nathan Eovaldi BOS 2.7 44.5 M 68 M 23.5 M
Andrew McCutchen PHI 2.9 43.1 M 50 M 6.9 M
Zach Britton NYY 1.1 31.8 M 39 M 7.2 M
J.A. Happ NYY 2.8 32.6 M 34 M 1.4 M
Michael Brantley HOU 2.4 42.2 M 32 M -10.2 M
Charlie Morton TBR 2.8 32 M 30 M -2 M
Jeurys Familia NYM 1.0 33 M 30 M -3 M
Lance Lynn TEX 1.6 27.3 M 30 M 2.7 M
Andrew Miller STL 1.3 26 M 25 M -1 M
Joe Kelly LAD 1.0 16.1 M 25 M 8.9 M
DJ LeMahieu NYY 2.0 41 M 24 M -17 M
Daniel Murphy COL 1.9 29.6 M 24 M -5.6 M
Josh Donaldson ATL 4.2 57.8 M 23 M -34.8 M
David Robertson PHI 1.4 26.3 M 23 M -3.3 M
Jed Lowrie NYM 2.1 26.8 M 20 M -6.8 M
Wilson Ramos NYM 2.2 35.6 M 19 M -16.6 M
Anibal Sanchez WSN 1.7 11.8 M 19 M 7.2 M
Yasmani Grandal MIL 3.2 51.6 M 18.3 M -33.3 M
Kelvin Herrera CHW 0.4 24.8 M 18 M -6.8 M
Hyun-Jin Ryu LAD 2.0 35.6 M 17.9 M -17.7 M
Garrett Richards SDP 0.0 17.4 M 15 M -2.4 M
Joakim Soria OAK 0.9 14.8 M 15 M 0.2 M
Nelson Cruz MIN 3.2 28.2 M 14.3 M -13.9 M
Matt Harvey LAA 1.0 14.7 M 11 M -3.7 M
Kurt Suzuki WSN 1.3 10.1 M 10 M -0.1 M
Brian Dozier WSN 2.2 31.9 M 9 M -22.9 M
Trevor Cahill LAA 1.3 14.5 M 9 M -5.5 M
CC Sabathia NYY 1.2 10.7 M 8 M -2.7 M
Ian Kinsler SDP 1.7 11.8 M 8 M -3.8 M
Jesse Chavez TEX 0.6 7.5 M 8 M 0.5 M
Trevor Rosenthal WSN 1.2 9.9 M 7 M -2.9 M
Steve Pearce BOS 1.2 10.5 M 6.3 M -4.2 M
Jonathan Lucroy LAA 1.9 10.4 M 3.4 M -7 M
Lonnie Chisenhall PIT 0.9 10.4 M 2.8 M -7.6 M
Brian McCann ATL 1.0 10.1 M 2 M -8.1 M
TOTAL $984.7 M $838 M -$146.7 M

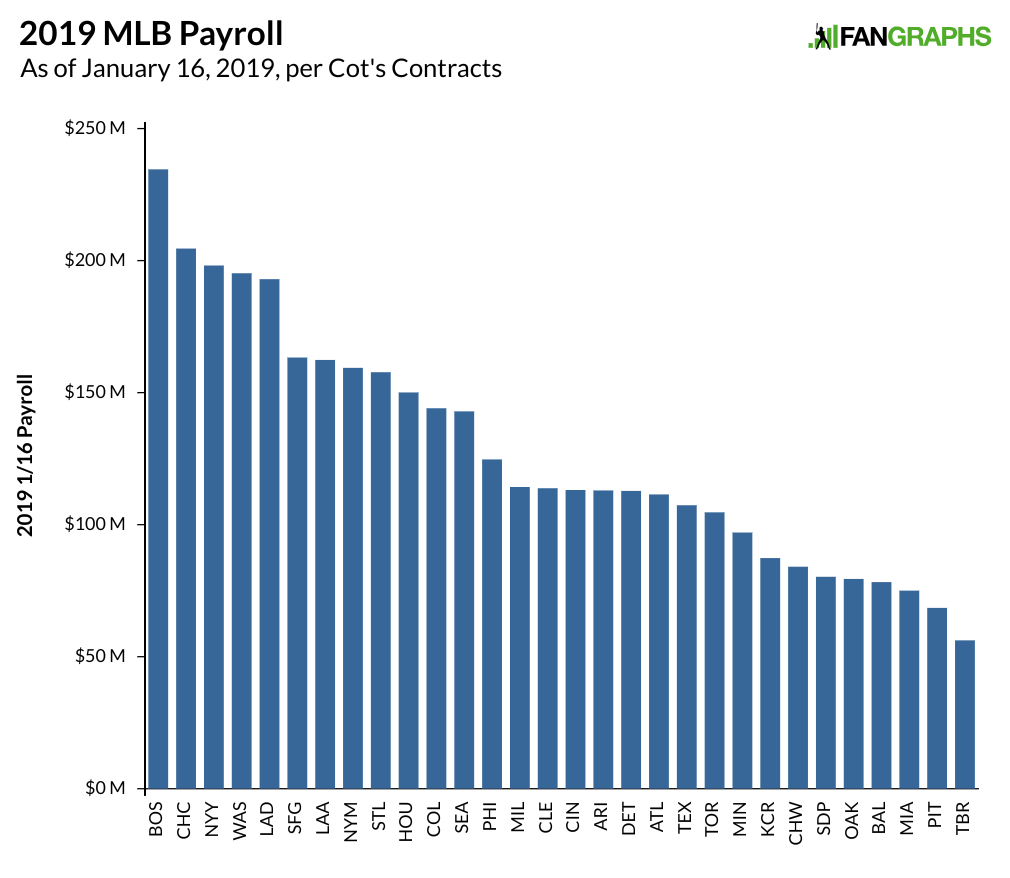
So far, free agents have signed for roughly 15% less combined than predicted. It’s interesting to note that the discount is being taken almost entirely in the length of the contracts, as both the predicted and actual AAV are around $12 million. Now that many players have reached agreements to avoided arbitration and a good number of players have signed free agent deals, we can take a look at where teams’ Opening Day payrolls stand at this point in the offseason. There are obviously a few huge contracts to go, with five of the top six contract projections still unsigned, so these numbers are nowhere near final. As of this writing, here’s what Opening Day payrolls look like for every team.

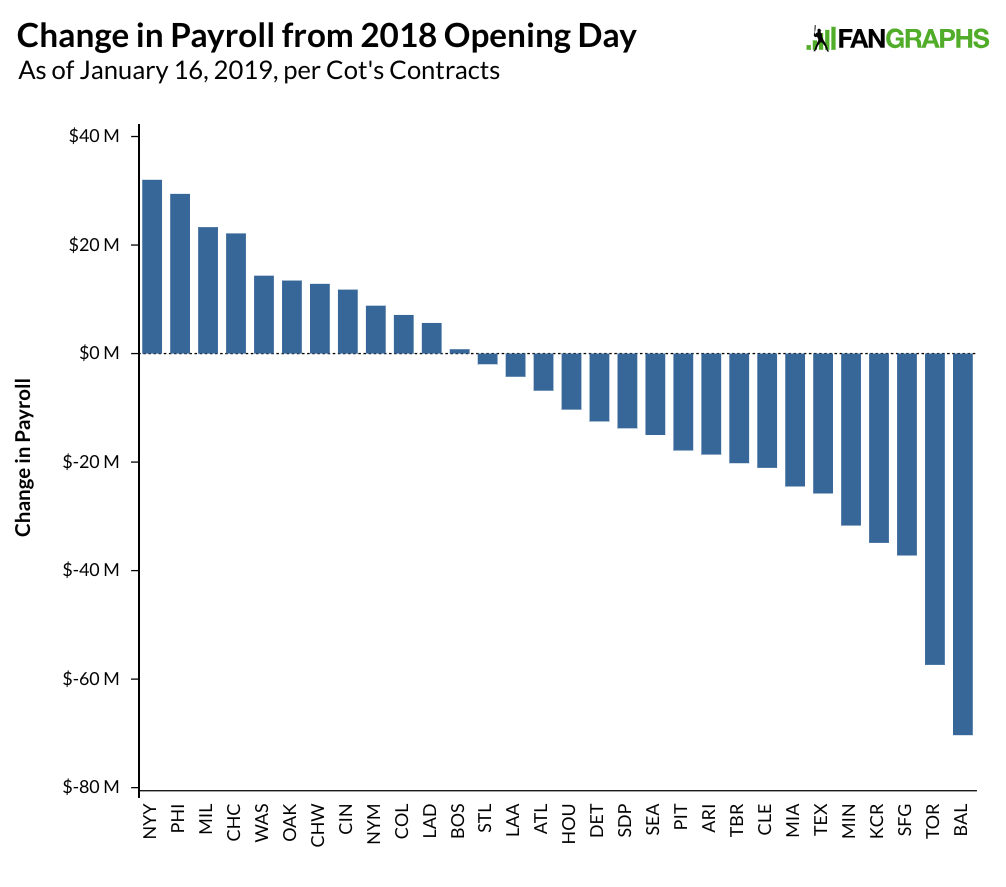
The Red Sox are well out in front of everybody, just like they were last season. The Cubs payroll is up compared to where it was. It might be somewhat difficult, if not impossible, to tell how every team’s payroll has moved based on the graph above. For reference, here’s a graph showing each team’s change in payroll from Opening Day last season.

Some of this will change in the coming months, though a lot of those teams at the bottom aren’t really expected to move the needle much. Last year’s Opening Day payroll average came in at around $136 million. Keep in mind, these numbers don’t include benefits or players on the 40-man roster. Last year, the end-of-season payroll average including those numbers went up to around $152 million. Right now, the average 2019 Opening Day payroll comes in at close to $128 million. In total, the difference between last year’s combined Opening Day payrolls and payrolls right now is $243 million. If we take a look at how much spending is left to be done, we might be able to approximate payroll for next season.

Here are the remaining crowdsourced free agents, their projected total salaries and the average annual value of each deal.

Remaining Free Agent and Contract Predictions
Name Proj WAR Crowd Avg Years Crowd Avg Total ($M) Crowd AAV ($M)
Bryce Harper 4.9 9.1 $300.0 $33.0
Manny Machado 5 8.6 $272.9 $31.7
Dallas Keuchel 3.3 4.2 $81.0 $19.4
Craig Kimbrel 2.1 3.9 $62.2 $16.1
A.J. Pollock 3.1 3.7 $58.8 $16.0
Mike Moustakas 2.8 2.8 $34.3 $12.2
Adam Ottavino 0.8 2.6 $27.0 $10.3
Marwin Gonzalez 1.8 2.9 $29.5 $10.1
Jose Iglesias 1.7 2.8 $25.6 $9.1
Gio Gonzalez 0.8 2.3 $26.4 $11.6
Nick Markakis 1.1 1.9 $19.9 $10.8
Adam Jones 1.2 1.9 $18.7 $9.9
Asdrubal Cabrera 2 2.1 $20.4 $9.6
Cody Allen 0.5 2.3 $20.5 $9.0
Wade Miley 1.1 1.9 $15.9 $8.5
Josh Harrison 1.2 1.9 $14.5 $7.5
Freddy Galvis 0.3 2.1 $15.1 $7.2
Brad Brach 0.1 2.0 $15.0 $7.5
Justin Wilson 0.1 2.1 $12.2 $6.0
Martin Maldonado 1 1.8 $10.7 $5.9
Carlos Gonzalez 1.3 1.5 $10.9 $7.3
Ryan Madson 0.1 1.2 $6.9 $5.8
Clay Buchholz 1 1.4 $9.3 $6.6
Jeremy Hellickson 0.4 1.5 $9.2 $6.2
Greg Holland 0 1.3 $7.4 $5.8
Tony Sipp 0 1.2 $5.9 $4.8
Shawn Kelley 0 1.2 $5.4 $4.5
Zach Duke 0 1.2 $4.7 $3.9
TOTAL 73.3 $1140.3 M $296.1 M

If the crowd is correct and $296 million in salaries are added to the 2019 season, we’ll be looking at around a $50 million increase over last season. That probably won’t happen, though. Last season when I did this same exercise, I was overly generous in my estimates, giving the players the crowdsourced money, and adding in another $60 million for all the other players for whom we did collect estimates. By the time Opening Day rolled around, I was more than $100 million off, and instead of a potential 1% increase in payroll, teams moved down 1% from the previous year.

If the rest of this offseason is anything like the remainder of last offseason, we are going to be looking at flat Opening Day payrolls. Even more troublesome for the players is that while Opening Day payroll was down about one percent from 2017 to 2018, when the end of season numbers were calculated, that figure was closer to 2.5%. While not definitive yet, there seems to be a pretty good possibility that major league payrolls will go down for the second consecutive season.


A’s Revenue Sharing Money Heads Back to the Yankees

A lot of time and words are spent here and elsewhere on the split of baseball revenue between players and owners; we spend less time comparing revenue between franchises. Sure, we make distinctions between small-market teams and large-market teams, putting the Yankees and Red Sox in one corner and Cleveland, Kansas City, and Pittsburgh in another. But we don’t spend a lot of time talking about what that actually means. There are a few good reasons for that. One is that we don’t have access to much of the data that would make meaningful analysis possible. But I suspect the main reason is probably that fights between billionaires who don’t take the field aren’t that interesting to a lot of fans. Add in rising revenues and $50 million windfalls from MLBAM, and for some, exactly how much money owners have isn’t all that important when we just know that they have a lot.

Many fans don’t even care about the fight between millionaires and billionaires. That’s their prerogative, but it’s important to consider these things carefully. The latest CBA wasn’t just a loser for the players for the obvious reasons, those were multiple: a competitive balance tax that barely increased, tax penalties that get progressively worse, small minimum salary increases, no universal designated hitter, only minor changes to free agent compensation, no concessions when it comes arbitration, no additional roster spots, hard international spending limits, and no help at all for the minor leaguers. The CBA also hurt the players when it comes to revenue sharing.

Wendy Thurm’s post from 2012 does a good job explaining the system under the old CBA and it is worth revisiting, but in sum: Teams took 34% of their net local revenue (local revenue minus stadium expenses), pooled it together, and divvied it up equally among all the teams. This was the base plan, and as is probably obvious, teams like the Yankees paid more into the pool than they received as part of it. There was also a supplemental plan. A pool of 14% of total net local revenue is created, with revenue taken from big-market teams like the Yankees and Red Sox and given to small-market teams like Pittsburgh and Tampa Bay. The supplemental plan worked to take a greater percentage away from high-revenue teams like the Yankees, and give it in higher percentages to the small-market teams.

Here’a a hypothetical under the old system.

  • Total Local Net Revenue is $3 billion, averaging $100 million per team.
  • Yankees Local Net Revenue is $400 million
  • A’s Local Net Revenue is $50 million

Under the old system, 34% of the *total* local net revenue is $34 million per team. For the Yankees, 34% of their local net revenue is $136 million; they end up making a net payment to the pool of $102 million once their distribution is taken into account, bringing other clubs up to $34 million. For the A’s, 34% of local net revenue is around $17 million; they end up receiving around $17 million in revenue sharing from the pool. Under the supplemental plan, 14% of $3 billion is $420 million. The Yankees pay about a quarter of that total with the Red Sox, Dodgers, Cubs, and Mets paying another 50%, so the Yankees put another $105 million in the pool. The A’s receive around 8% of the supplemental pool, so they get another $34 million to up their total to around $51 million. The Yankees end up with $193 million in net local revenue minus revenue sharing and the A’s end up with $101 million in net local revenue plus revenue sharing. These numbers are meant to be illustrative and provide a rough example of how revenue sharing worked.

The current CBA is much simpler, with a single 48% pool divided equally so that the same percentage of revenue is shared, but it is distributed differently. It takes less money away from the richest teams by eliminating the supplemental pool. In the example above, every team gets $48 million from the pool. The Yankees 48% figure comes to $192 million, so that they pay in $144 million. The A’s 48% figure is $24 million, so they receive $24 million. In this scenario, the Yankees get to keep a lot more of their money and the A’s get less. While we don’t know what the actual numbers are, the A’s did receive more than $30 million in 2015 and 2016, and at one time expected their 2019 payment to be greater than $40 million. The A’s won’t be getting that $40 million, however, as they will receive just a fraction of that amount. Most of that $40 million will stay with the Yankees, Cubs, Red Sox, and Dodgers.

In the last CBA, which went from 2012-2016, MLB phased in restrictions on teams receiving revenue sharing payments. All teams started on equal footing, able to receive revenue sharing based solely on their local net revenue numbers. (The Marlins were treated slightly differently, essentially unable to collect in 2012 after refusing to spend any money prior to 2012, resulting in a threatened grievance by the players.) The CBA phased in restrictions so that larger-market teams could only collect a portion of the revenue sharing owed to them, and by the time the new CBA rolled around, none of the large-market teams were allowed to collect revenue sharing money if their revenue was low except for the A’s, who despite their famously spendthrift ways and decaying ballpark, signed a billion dollar local TV deal in 2009. They’re low-revenue due to their stadium issues, but not quite small-market. The A’s were given an exception under the previous CBA, so that the restrictions didn’t apply until the team got a new ballpark. The new CBA removed those restrictions and began phasing in reduced revenue sharing payments for the A’s. Per the CBA:

Notwithstanding the foregoing, the revenue sharing disqualification of the Oakland Athletics shall be phased in as follows: 25% disqualified in the 2017 Revenue Sharing Year; 50% disqualified in the 2018 Revenue Sharing Year; 75% disqualified in the 2019 Revenue Sharing Year; and fully disqualified in the 2020 and 2021 Revenue Sharing Years.

This means that if, for example, the A’s had received $40 million in revenue sharing in 2016, they would only have received $30 million in 2017, then $20 million last year, $10 million this year, and then would get nothing in 2020 and 2021. So who gets the A’s money? The teams paying into revenue sharing receive it, but there’s a catch: teams get more money if they don’t go over the competitive balance tax.

Let’s say the Yankees pay about 20% of the money in revenue sharing that goes to other teams. That means that for next season, they will receive $6 million more dollars than they would have because the A’s can’t receive revenue sharing. The Dodgers will get something less than that. The Cubs, too. The Red Sox will receive 75% of their potential share because they will have gone over the tax threshold two years in a row next season. In 2020 and 2021, the clubs stand to gain even more money. Even If the Yankees go above the tax threshold the next two seasons, they might end up holding on to around $15 million that would have gone to the A’s in the previous CBA. That money might make its way to players, but given the incentives here and the teams publicly stated desires to stay under the threshold, there’s cause to be skeptical.

The amounts we are dealing with aren’t huge sums, but they are an added benefit to keeping spending low despite having to pay significantly less in revenue sharing. These aren’t speculative amounts if some big market team have lower revenues. We know where Oakland will be the next few years. And it isn’t just Oakland that ends up with less money, though they certainly bear the brunt of the losses. All of the lowest-revenue, smaller-market teams are likely receiving less money from revenue sharing than they used to under prior CBAs. It’s not an excuse for Cleveland to cut payroll given the increases in national television money, but it is likely that the have-mores are taking a bigger piece of the revenue pie than the have-a-decent-amounts.

Ahead of the last round of CBA negotiations, I thought there would be a fight among the owners over revenue sharing. Likely because the players didn’t demand enough concessions, that fight never took place. Small-market teams were willing to take less revenue sharing because negotiations with the players were too easy, and national revenues from television deals and money from MLBAM were good enough at the time. It’s not a big part of the player loss in the last CBA, but it doesn’t help when the teams with more money refuse to spend it. Revenue sharing might not seem like an important issue for the players, but spreading money around might have yielded a bit more spending at the bottom of the league.


Major League Baseball Gambles On MGM Resorts

We’ve talked a couple of times this year about a potential new revenue stream for Major League Baseball: legalized sports gambling. As a quick refresher, back in May, the United States Supreme Court struck down as unconstitutional the Professional and Amateur Sports Protection Act of 1992 (“PASPA”), the federal law that banned states from permitting sports gambling in the United States (outside of Nevada, which was exempt). Even before PASPA was nullified by the Supreme Court, its imminent demise had been seen coming for a while, and so several states had already passed, or were in the process of passing, laws permitting sports gambling within their borders. Those laws, in many cases, took effect as soon as the Supreme Court ruled that PASPA was unconstitutional. And so it was only a matter of time before we saw the major sports leagues get in on the action themselves.

Enter MGM Resorts International, which took advantage of the opening to strike an exclusive deal with Major League Baseball to become the league’s first official gaming and entertainment partner. What does that mean? Well, I’m glad you asked.

As an official sponsor of MLB, MGM Resorts will domestically promote its brand and gaming options across MLB’s digital and broadcast platforms, including MLB Network, MLB.com, the MLB At Bat app and additional fan engagement offerings to be jointly developed.

MGM Resorts will be identified as an MLB-Authorized Gaming Operator and utilize MLB’s official statistics feed, on a non-exclusive basis, throughout its digital and live domestic sports gaming options. MLB will also make enhanced statistics available to MGM on an exclusive basis. In addition, MGM Resorts and MLB will work together on comprehensive responsible gaming measures and work to protect the integrity of the game both on and off the field.

If that seems a bit opaque to you, you’re not alone. So let’s break this down. This is not, as some have said, an event heralding MLB’s acceptance of players gambling and the rehabilitation of the reputation of Pete Rose. Nothing MLB has done overrides or modifies Rule 21, which prohibits players from betting on games. Nor does it mean illegal sports betting is going the way of the dinosaur; if the news is any indication, that dubious vocation is alive and well.

But it does mean that Major League Baseball is, for the first time, officially sanctioning gambling on games – and perhaps more. For starters, MGM is getting official access to MLB’s stats, but it is not getting exclusive access to most of them. That means MLB can turn around and license most of the same data and intellectual property to other gaming companies as well. And MLB made sure that its other gambling ventures (yes, they do exist!) aren’t impacted.

As to the future, as of today, there are no plans to integrate wagering on baseball into MLB’s digital and mobile platforms, such as the popular “At Bat” for mobile devices. The deal also does not impact MLB’s equity investment in DraftKings for fantasy baseball, although there has been talk that both MLB and the NBA may be looking to divest themselves of their ownership stakes in daily fantasy sports companies.

That opens quite a few doors for MGM, as SB Nation notes.

For starters, one of the most interesting parts of this agreement is that MGM will have access to MLB’s statistical data. Despite the fact that baseball and various gambling venues have had a tenuous relationship over the years (to say the least), this means that MGM will likely use that data to set the betting lines and they’ll be at the forefront in that regard.

That kind of access carries some value, as Forbes relays.

MGM Resorts locations will be see labeling such as “MLB-Authorized Gaming Operator” for digital and live gaming events. As part of the deal, MGM will be granted the use of official league logos and marks. MGM will have a visible presence at the so-called MLB Jewel Events, including the All-Star Game and the World Series.

So what did MGM pay for this unprecedented deal? Actually, that’s not at all clear. MLB didn’t disclose how much MGM paid, but at least one unconfirmed report placed the figure at $80 million. And if that seems light, that’s because (at least in one sense) MGM paid for not all that much, as Christian Pina explains.

In the new industry of mobile apps, this all comes back to the flagship app for MLB, MLB At Bat. No, MLB-At Bat isn’t acting as a DraftKings type of sportsbook for you to place bets, it’s honestly mostly just an open line of communication. Major League Baseball will give MGM and MGM’s mobile applications free-reign over their up to the second stats, next-gen stats (exit velocity, spin rate, etc), and most likely input some live betting expected win %’s pulled from MLB At Bat right into any mobile app parented by MGM.

In short, it really doesn’t mean much for you, the gambler and consumer, which isn’t what you probably wanted to hear.

So in one sense, this is, despite the gaudy headlines, not much more than Major League Baseball garnering a new sponsor in a new area that was previously unavailable; were it, the price MGM paid would likely have been substantially higher. As the official gaming sponsor for Major League Baseball, MGM mostly just bought advertising rights. MLB will have other sponsors and gaming partners, but MGM paid for the use of the word “official” by being first in line.

But in another sense, MGM did score a major coup here. Why? Because MGM is receiving exclusive access to what MLB calls “enhancing” statistics, which MGM Resorts will use for the purpose of setting betting lines. In other words, MGM just purchased the right to set betting lines based on Statcast data, which would, in theory, allow for in-game betting based on those data and metrics. (The specific form that data takes, and which exact Statcast stats and feeds will be available to MGM, is still unclear.) And MGM does have avenues to grow its relationship with the league even further, because its contract is only with MLB and not with any of the thirty individual teams. MGM is currently negotiating with multiple teams in the hopes of signing official sponsorship deals with them as well. And Statcast data will allow for more accurate betting lines and more realistic gaming. How Statcast might be used for betting is an issue that has yet to fully develop – and it’s one we’ll be following closely as this new frontier comes into focus.


The Braves’ Profits Provide Glimpse into Baseball’s Books

Major league baseball teams closely guard their financial information. They have no problem talking about how much money players make, but they prefer to be more circumspect when disclosing the revenue teams take in or the scale of the profits owners make after those players have been paid and expenses accounted for. Because baseball’s ownership is a fairly insular group composed mostly of individuals and privately held businesses– and because there relatively few franchise sales to use as gauge–teams have been largely successful in preventing their financial information from going public. The Atlanta Braves present an exception.

Liberty Media, perhaps best known for its subsidiary SiriusXM Satellite Radio, purchased the Braves in 2007 for $400 million. Two years ago, they began offering stock in their separate divisions, which means the public can buy shares in the Braves as well as the real estate holdings around the stadium. It also means that, as a publicly traded company, the public is entitled to more information regarding the team’s finances than is typical. As I wrote in 2016, the club disclosed an $18 million loss in 2014 before depreciation and amortization. They were on the plus side in 2015 by about three million dollars before recording losses of about $20 million in 2016. During those three seasons, the team averaged 90 losses, with an average annual attendance of 2.1 million fans and a payroll just over $116 million per season. The financial losses in 2016 were largely attributable to a huge international signing class, most of the players from which were later declared free agents after MLB’s investigation into Atlanta’s signing methods.

But focusing exclusively on a team’s year-by-year profits obscures the financial reality of owning a baseball team because it doesn’t address the most profitable aspect of team ownership: the value of the franchise. Based on the calculations above, the Braves lost about $45 million from 2014 through the end of 2016. But Liberty Media CEO Greg Maffei has admitted profits weren’t always the main consideration for the Braves, indicating that “historically, the measurement was we didn’t lose money.” Maffei’s remarks are consistent with statements from another team owner, Rogers Communications, which owns the Toronto Blue Jays, though the Blue Jays’ financials are harder to trace because Rogers owns a whole host of assets along with the baseball team. Per Forbes:

The media giant’s CFO, Tony Staffieri, said at a conference that Rogers wants to “surface value” from the Blue Jays, which he said is a “very valuable asset for us that we don’t get full credit for.”

For the Blue Jays, “surfacing value” would likely come in the form of realizing the profits from selling the team, as Rogers might not be getting “credit” if the team isn’t reaping huge profits. Then there’s the matter of Rogers also broadcasting Blue Jays games, which might further cloud the revenues from the baseball team. (The Braves used to benefit from some of that same confusion back when Ted Turner owned the club and TBS showed Braves games, but the financial model has shifted, and the Braves now have one of the worst local television contracts in baseball.) It is clear the calculus of franchise ownership is more complicated than mere gate sales. Read the rest of this entry »


An Estimate of Every Team’s Payroll Room

Free agency officially begins on Saturday. While clubs have had the right this week to negotiate exclusively with their own departing players, that stops tomorrow. Tomorrow, anyone can talk to anyone.

As we enter free-agent season and attempt to understand which deals are likely and which are less so, it helps to have a sense of how much each club has to spend. Last offseason unfolded slow: teams and players battled on contract terms until spring. When the dust finally settled, payroll hadn’t actually increased from the previous year — a relatively rare occurrence, especially in an era when the game is so financially healthy.

That lack of upward movement in salaries was attributed, in part, to the impressive free-agent class of this winter. By looking at payrolls from the past couple years, we can get an idea of who has the most money to spend and who will need to significantly increase payroll if they want to get in on free-agent spending.

To begin, let’s consider what payrolls looked like at the beginning of the 2018 campaign.

That massive payroll worked out pretty well for the Red Sox: the World Series winners took advantage of the attempt by others clubs to stay under the competitive-balance tax threshold. At the other end of the payroll spectrum, meanwhile, Milwaukee, Oakland, and Tampa Bay managed to win a bunch of games without spending big, though the relationship between payroll and wins remains relatively strong.

Read the rest of this entry »


Those Disastrous World Series TV Ratings

The popularity of baseball is oft-discussed and yet somewhat difficult to measure. We can look at everything from attendance to jersey sales to commercials to revenue and yet fail to reach any real conclusions due to the constantly changing ways in which people consume media and celebrate fandom.

Another measure is television viewership and ratings. Determining the number of people who have enough interest to watch the sport on television should be a relatively good measure of popularity, although even those measures need context to make any sense. On one hand, local television ratings remain strong during the season, indicating relatively widespread support for the game. On the other hand, the ratings for this season’s World Series between the Boston Red Sox and Los Angeles Dodgers were not good.

Consider a couple of headlines. Like Boston-LA World Series Struck Out Looking for Fox from the LA Times and like The 2018 World Series was Good for the Red Sox–and Bad for Baseball from The Atlantic. Even commissioner Rob Manfred acknowledged disappointment with the ratings after the first few games.

Read the rest of this entry »


The Best World Series Money Can Buy

If the Milwaukee Brewers had managed to beat the Los Angeles Dodgers in the seventh game of the NLCS, this post would examine one of biggest payroll disparities in World Series history. The Brewers couldn’t quite get the job done, however. As a result, it’s the Dodgers who advance to the final round of the 2018 postseason, and instead we have the most expensive World Series in history.

The Red Sox are projected to record a final a payroll around $237 million, which is the highest in baseball. The Dodgers — after considerable cost-cutting measures during the offseason — will finish the year with a payroll close to $194 million, per Cot’s Contracts. The Dodgers’ figure will likely be the fourth highest in MLB this season behind the Red Sox, Nationals, and Giants. The $423 million spent on payroll by the two World Series participants this season is the most ever.

The payroll totals somehow don’t do justice to how much these clubs have spent to get here. The Dodgers have spent $1.249 billion over the past five years, for an average payroll of $250 million. That’figure comes before accounting for the $28 million per season the Dodgers have paid in competitive-balance taxes. The Red Sox payroll this season — due to the Dodgers’ and Yankees’ efforts to get under the $197 million tax threshold — is more than $30 million clear of the second-place Nationals. When the club’s $10 million tax bill is considered, the team’s payroll is more than 20% higher than the Nationals. The difference between the Red Sox and Nationals is roughly the same as the difference between the Nationals and the 12th-place Mets. The Red Sox have spent $987.1 million on the team over the past five years, for an average payroll of $197 million — and just a bit over $200 million when factoring in taxes paid. Only the Dodgers and Yankees have spent more during that time.

As for the talent actually featured on the current rosters, the two clubs are very even: both had close to $155 million on the active roster in their respective LCSs. The graph below shows salaries (for competitive-balance tax purposes) for the players expected to play a role in the World Series. Players are shown by the amount of money the Red Sox or Dodgers are paying, not necessarily their full salary for the season. For example, Manny Machado is credited only with the portion of his salary for which the Dodgers are responsible following his acquisition from the Orioles.

Read the rest of this entry »