Archive for Business

Untangling a Minor League Mess, Part I

In 2011, Major League and Minor League Baseball agreed to extend their current Professional Baseball Agreement (PBA) through the 2020 season. That agreement, which extended a prior agreement that wasn’t set to expire until 2014, maintained the status quo between the majors and the minors that most fans are familiar with today. There would continue to be over 160 affiliated minor league teams, with each team’s major league parent organization providing the players and the minor league clubs providing the facilities, travel, and fans. That agreement also included an increase in the ticket tax minor league teams pay to major league teams based on ticket revenue. That PBA is set to expire at the end of this season, and Major League Baseball wants to make drastic changes to the next agreement, changes that would dramatically reshape the minor leagues as we know them now.

The negotiations, which have thus far been quite ugly, first became public back in October when Baseball America revealed some details of MLB’s proposal (Baseball America, and JJ Cooper in particular, has done a great job covering the dispute); a later New York Times report confirmed the 42 teams set for contraction. Since then, the two sides have traded public missives, accusing each other of engaging in behavior that is not in the best interest of baseball.

Cumulatively, the changes proposed by MLB represent a move to gain power and consolidate control over the minor leagues. The MLB plan would move the amateur draft later in the year and decrease its number of rounds, get rid of short-season baseball, remove one-fifth of the independently owned full-season teams, take control of the Florida State League, and restructure existing leagues and reclassify some teams. The cumulative effect of these changes would be to diminish the power of MiLB relative to MLB and to potentially lower affiliate value for independently owned minor league franchises. With such sweeping and fundamental changes on the table, there’s a lot to sort through. But to get to the core of what’s at stake, it’s helpful to unpack one of the most significant changes under consideration: getting rid of short-season baseball. Read the rest of this entry »


How Winning and Financial Power Affect Free Agent Spending

Over the past few days, we’ve discussed the cost of a win in free agency and how that cost has been lowered for slightly below-average players. In this post, I want to examine some of the potential driving forces behind these changes. Specifically, I want to take a look at the following assumptions about how teams operate with respect to paying for wins on the free agent market.

  • The closer teams get to the playoffs, the more money they will be willing to spend on players because of the monetary benefits that come from making the playoffs.
  • The more money a team has, the more they will be willing to spend on a win on the free agent market because they can afford it, and vice versa (i.e. the Rays won’t spend the same dollars per win as the Yankees because the Rays have to hunt for bargains while the Yankees can afford to make the highest offer to any player they want).

We’ll take these assumptions one at a time. While there isn’t a great way to bucket teams by whether they’re “close” to the postseason without some degree of arbitrariness, I opted to look at a team’s projected win totals for each of the last two seasons, plus its current projected WAR for next season. I put teams into three categories: likely playoff teams, teams with a decent shot at the playoffs, and teams with little to no hope of making the playoffs. For the first group, I included teams projected to win at least 86 games, which usually provides a 50% or greater shot at the playoffs. For the second group, I included teams projected to win at least 77 games, but fewer than 86, which is roughly aligns with the 10%-50% range in terms of playoff odds. In the final group, I put teams with fewer than 77 projected wins.

The table below shows how much each group is spending over the last three offseasons, including this one:

Spending Based on Projected Win Totals
Wins Teams Players Dollars $/WAR (2018-2020)
86+ 28 84 $2106 M $9.0 M
77-86 33 104 $2299 M $8.3 M
77- 29 57 $656 M $8.3 M

Read the rest of this entry »


The Cost of a Win in Free Agency in 2020

After a few cold, dreary, quiet hot stove seasons, free agency picked up its pace this winter. While Manny Machado and Bryce Harper got $300 million deals last offseason, it took until nearly spring to get those contracts finalized. This offseason, we’ve seen Gerrit Cole, Stephen Strasburg, Anthony Rendon, and Zack Wheeler sign for more than $100 million, and with the new year just eight days old, only a handful of decent free agents remain. While large deals and total spending near $2 billion have captivated us this offseason, it’s worth exploring what has made this winter different from years past. Is it just timing? Is it this class of free agents? Have teams changed their spending habits? Is the cost of a win still linear? A useful tool when examining those issues it to try to determine how much teams are paying for a win above replacement in the free agent market.

While putting dollar figures on players isn’t the most feel-good task, it’s helpful for framing conversations about costs in free agency. From the front office perspective, it helps to determine which free agents are good values and a worthy investment of resources compared to other free agents and veteran players. It also helps frame the value of younger players who have yet to reach the full six years of service time necessary to hit the market by showing the alternative cost to obtaining similar production. On the player side, these types of valuations tend to show how underpaid players are prior to reaching free agency, given the low cost of their tremendous on-field value compared to similarly productive free agents.

There are a variety of ways to go about determining how much teams are paying per win on the free agent market. Matt Swartz, having found that projections tended to overweight free agent player production and playing time when considered in the aggregate, instead considered actual production of past results to determine how much teams were paying for a win. He also used all players with at least six years of service time to account for players aging over the course of a contract. He acknowledged that there might be issues with including players on extensions. To be clear, Swartz wasn’t wrong about the way he formulated his dollars per win, but another approach can be helpful, and, if we are to look at the current offseason, necessary. Read the rest of this entry »


Cubs, Sinclair, Marquee, and Comcast Combine Forces for a Potential Blackout for Cubs’ Fans

In many cases, no news is good news. But for the Cubs, their broadcasting partner Sinclair, and the new Marquee Network, no news is bad news. While there’s still more than a month to go before the network is on the air, it has yet to reach agreements with Comcast/Xfinity, the largest cable provider in Chicago, as well as RCN and streaming only services like Hulu Live, Sling, and Youtube TV. In his piece for the Chicago Tribune, Phil Rosenthal provides a reminder of where things stand for viewers in Chicago when it comes to seeing Cubs’ games this season:

While Marquee currently has deals in place to run on a handful of carriers, including DirecTV, U-verse, AT&T TV, Charter Communications and Mediacom Communications, it is lost on no one that it’s still negotiating with many others, including Comcast’s Xfinity, the Chicago-area’s largest carrier with an estimated 1.5 million households.

As Rosenthal notes, Sinclair was able to leverage its massive reach across the country, which includes local stations and more than half the Regional Sports Networks that air baseball games, to secure deals with AT&T/DirecTV/Uverse/DirecTVNow, allowing the Cubs and Sinclair to say they reach nearly all Chicagoland homes. But reaching nearly every home and actually airing in those homes are two entirely different things. The deals with Charter and Mediacom aren’t insignificant, as fans in downstate Illinois, southern Wisconsin, Iowa, and Indiana will likely have access to Cubs games in the spring with a cable package. The Cubs didn’t start their own network to reap the benefits of subscriber fees in those areas, however, as getting on cable in homes in Chicago is the big prize and moneymaker.

In Rosenthal’s piece, he notes that the Yankees’ YES network had difficulties getting onto Comcast a few years back. The Yankees’ situation provides an interesting analogue both for its similarities and its differences. While Comcast was in nearly a million homes at the time, none of them were in New York City, where YES Network was available to millions more subscribers. Comcast was a smaller fish for YES, unlike the situation in Chicago. In addition, the dispute ended when Comcast wanted to add Fox News Channel to its lineup and FOX, which owned YES at the time, was able to leverage those negotiations into carriage for YES on Comcast. It’s not clear that the Cubs and Sinclair have the same type of leverage in Chicago. Read the rest of this entry »


Money to Spend: What’s the Likely State of Team Payrolls in 2020?

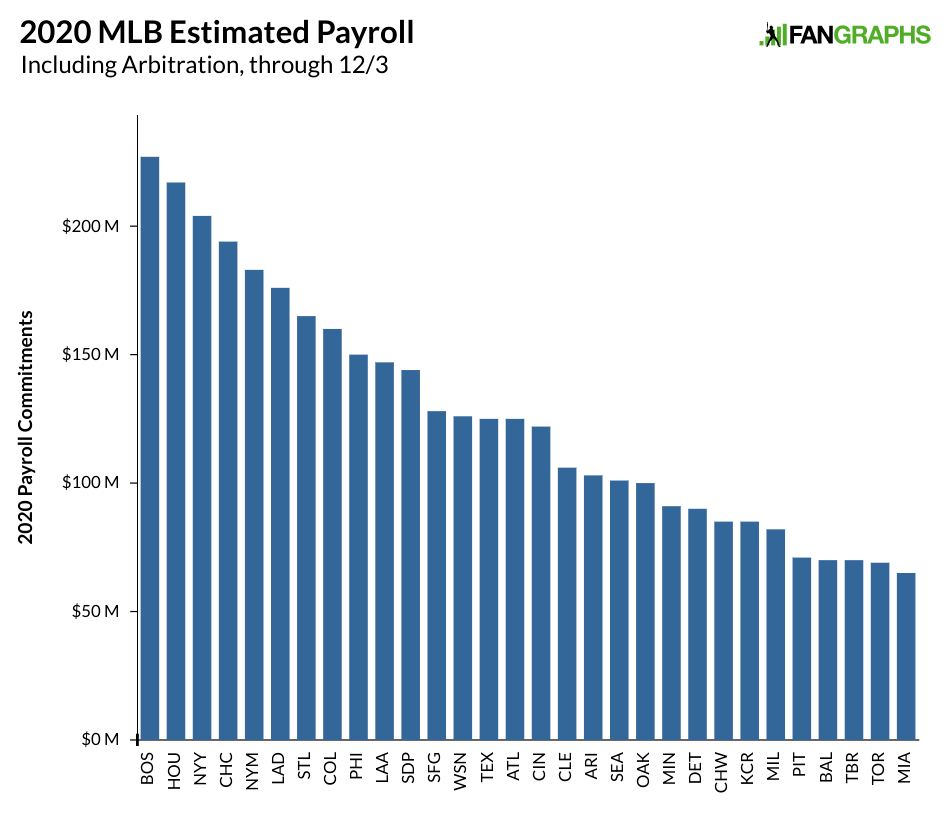
How much major league teams are willing to spend on player salaries in any given year can be a bit murky. Teams don’t want to show their hand and lose negotiating power with free agents, though we can usually figure out their number by the end of spring when the money has been spent. How much every team is likely to spend is more opaque. We know that, generally speaking, teams are making boatloads, but while the revenue across the sport has increased over the last few years, it hasn’t resulted in increased payrolls. Every team has lots of money — the budget constraints we hear front office types reference are, more often than not, self-imposed rather than the result of empty coffers — but some will spend more than others. Trying to pin down what teams will spend in 2020 at this point in the winter is difficult, but we can use last year’s payroll numbers as a guide to get a rough idea of what each is likely to do, and thus gauge which ones will commit to payroll increases and which are likely to embrace thrift.

To answer those questions, we can look to the contracts coming off the books at the end of 2019, but that number can be misleading. Raises to players with long-term contracts, as well as increased pay in arbitration can bite into some of the departed money. Let’s start with how much money every team has committed for 2020 as of right now, using estimates for arbitration figures and minimum salaried players. (All the data can be found in the Payroll section on our RosterResource pages.)

Read the rest of this entry »


What the Crowd Tells Us About Free Agent Trends

Every year, FanGraphs asks our readers to provide contract predictions for the game’s top free agents and every year, our readers do an admirable job with their winter forecast. The predictions for this offseason’s most notable free agents can be found in our Top 50 Free Agents post; if you prefer a sortable, filterable table where you can easily see all the predictions, plus players’ actual contracts (when signed), we have that option as well. While their predictions are important and valuable to the site, I hope our readers will not take offense when I say that over the last few years, their contract prognostications have not been as good as they were in the past.

Going back to the winter prior to the 2014 season, here is what our readers predicted teams would spend, as well as the actual dollars spent, by year, with some figures coming from this 2018 post and Max Rieper’s prior research:

Free Agent Contract Crowdsourcing Results
Year Players Crowd ($/M) Contract ($/M) Difference % Difference
2014 43 1320.8 1366.9 $46.1 M 3.5%
2015 45 1396.0 1498.4 $102.37 M 7.3%
2016 52 2340.0 2215.0 -$125.0 M -5.3%
2017 42 1441.0 1147.0 -$294.0 M -20.4%
2018 50 1711.0 1279.0 -$432.0 M -25.3%
2019 63 2068.3 1707.4 -$360.9 M -17.5%
TOTAL (’14-’19) 295 10277.1 9212.6 -$1064.4 M -10.4%

Over six offseasons, the crowd’s predictions were roughly a billion dollars too high. That total is only about 10% off, which doesn’t seem so bad. Looking at the individual years above, we can see that the billion dollar difference is housed almost entirely in the last three winters. From 2014 through 2016, the crowd fluctuated a bit but with over five billion dollars in predicted salary, the crowd was off the actual mark by just $23 million, less than half a percent off the total amount. Over the last three seasons, major league payrolls have remained static. The lack of upward movement in spending has come almost entirely at the expense of free agents, who make up roughly two-thirds of total payroll. Based on the crowdsourced predictions, it’s fair to say that readers expected payrolls to rise. The lack of a decent increase in 2017 was a surprise, as was the fact that there was no upward correction in 2018. Last year, readers were closer than they had been the previous two offseasons, but still missed the mark by 17% compared to the actual contracts signed. Read the rest of this entry »


Rumored Royals Sale Would Rank Among Most Profitable

On Tuesday, Ken Rosenthal and Jayson Stark reported that Royals owner David Glass was discussing a potential sale of the baseball team to John Sherman, who currently owns a minority interest in the Cleveland Indians. Jeff Passan is reporting the deal would be worth more than a billion dollars, which could potentially exceed Forbes’ estimate from earlier in the year. In very related news, Jeffrey Flanagan of MLB.com reported that the Royals are close to an extension of their television rights with Fox Sports Kansas City that were set to expire after this season. That deal, worth an estimated $50 million per season, looks light in relation to recent deals. Combined with the news of a potential sale, it seems possible the Royals have opted for a lesser television deal in favor of certainty in order to sell the team.

The potential television deal will be addressed later in this piece, but the bigger news is clearly the potential sale. Glass purchased the team for $96 million back in 2000, and if he were to sell the team for a billion dollars, it would be one of the most profitable sales in the history of the sport in sheer monetary terms. The graph below shows all sales of MLB franchises since the Orioles were sold back in 1988. During that time, every team except for the Yankees, White Sox, Twins, and Phillies have been sold, with the Diamondbacks and Rockies still with their original ownership group in some form. There have been 33 sales, with the Royals a potential 34th transfer.

The graph above can be a bit misleading as inflation and the amount of time a team has been owned can greatly affect the numbers above. The sale of the the Dodgers is still the biggest on the list, with the Mariners coming in second, and even after accepting a deal at only 75% of the rumored price, Jeffrey Loria’s profit on the Marlins was enormous. The average profit on a sale over the last 30-plus years (without the Royals) has been $306 million. Over the last decade, seven sales have averaged $900 million in profits. Read the rest of this entry »


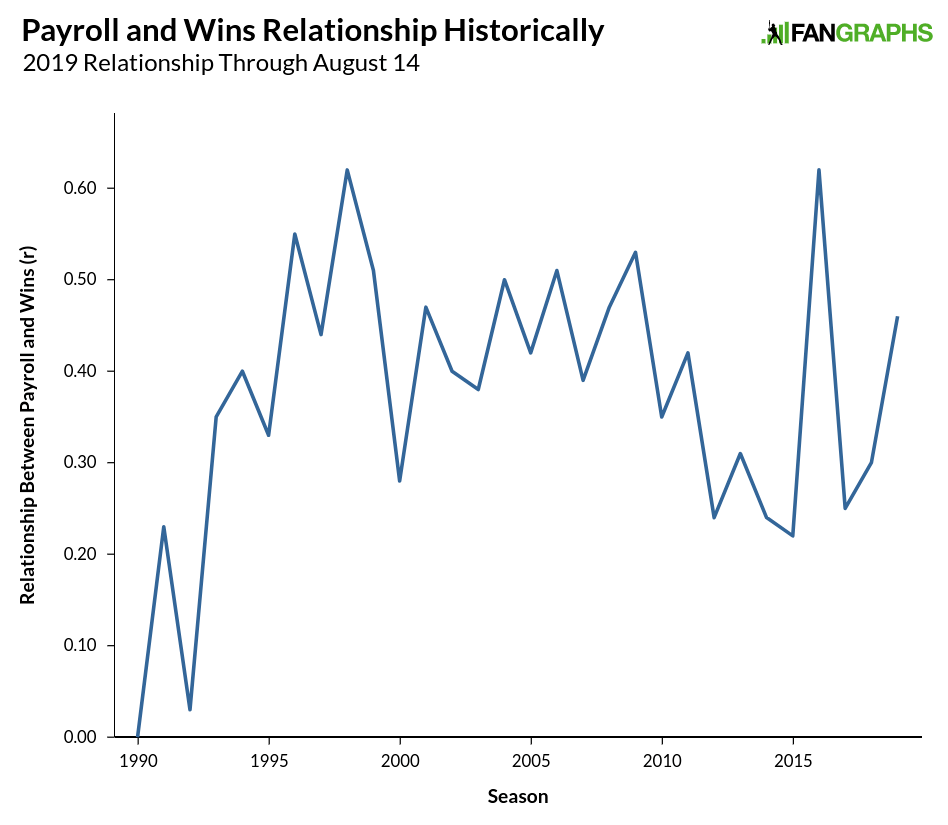
In 2019, Team Payroll and Wins Are Closely Linked

Over the last decade, we’ve seen a change in the demographics of baseball, with playing time shifting away from older, declining veterans toward younger players still in their prime. There’s a good reason for that, as each new generation of player entering the majors has been getting better and better relative to their older peers. Baseball’s owners have capitalized on this development — those younger, better players are also much cheaper. And teams have not reinvested those gains elsewhere on their rosters, as major league payrolls have stagnated the last few seasons while amateur talent expenditures have become hard-capped. Given the emphasis on younger players, it might be reasonable to believe that when it comes to fielding a winning team, payroll matters less than ever. But that hasn’t been the case this season.

This piece marks the fifth season during which I’ve taken a look at the standings in August and compared them to Opening Day payrolls (2015, 2016, 2017, 2018) and for the most part, the relationship between Opening Day payrolls and wins has been relatively low. I’ve used the Pearson correlation coefficient “r” to track the strength of the relationship between the two and from the end of the strike through 2011, the average correlation per year was .45. In the last seven seasons heading into this season, though, the correlation coefficient between the two was higher than .31 only once, when it was a high .62 back in 2016.

In past years, I’ve noted that while individual season correlations have remained low, looking at either sustained spending or using Forbes franchise valuations to gauge a team’s overall financial might tends to show that the relationship between spending, wealth, and winning remains strong. That logic remains for this season, and indeed, the relationship between wins and payroll trails only that of 2016 season this decade:

Read the rest of this entry »


The Team-By-Team Draft Cost of Signing Dallas Keuchel or Craig Kimbrel

We don’t know exactly why Dallas Keuchel and Craig Kimbrel didn’t sign with teams during the winter and early spring like the other prominent free agents did. It’s possible that early posturing around large contract demands pushed some teams away and caused them to explore other options. It’s possible there were just too many teams that weren’t sufficiently interested in adding good players at a reasonable cost, even if Keuchel and Kimbrel’s demands had come down. We do know that neither signed before the season, or in April, and that coming up on the end of May, both players are still looking for a team.

What we might have heard over the last few months is that teams are waiting until after the draft in June to sign Keuchel or Kimbrel so as to avoid losing a draft pick. Over the last decade, as the game has gotten younger and younger players have gotten cheaper relative to veterans, teams have placed greater emphasis on draft picks. Ahead of the last CBA, one of the bigger issues for players was the free agentcompensation system, in which teams made qualifying offers to free agents and then received a first round pick (or something close to it) when those free agents signed elsewhere. One of the major changes in the new CBA was a change to that system designed to make free agents more attractive by lessening the penalty for signing free agents attached to a qualifying offer. While Keuchel and Kimbrel aren’t ironclad proof the system didn’t work, they are a couple of key pieces of evidence. A breakdown of the penalties provides further reasoning.

To understand why the system hasn’t worked, it helps to look at the penalties. Here are the rules from MLB:

Any team that signs a player who has rejected a qualifying offer is subject to the loss of one or more Draft picks. However, a team’s highest first-round pick is exempt from forfeiture, which is the most notable change that went into affect with the new system. Three tiers of Draft-pick forfeiture — which are based on the financial status of the signing team — are in place to serve as a penalty for signing a player who rejected a qualifying offer:

• A team that exceeded the luxury tax in the preceding season will lose its second- and fifth-highest selections in the following year’s Draft, as well as $1 million from its international bonus pool for the upcoming signing period. If such a team signs multiple qualifying-offer free agents, it will forfeit its third- and sixth-highest remaining picks as well.

Examples: A team with one pick in each round of the 2019 Draft would lose its second- and fifth-round picks. A team with two first-round picks and one pick in each subsequent round would lose its second-highest first-round pick and its fourth-round pick.

• A team that receives revenue sharing will lose its third-highest selection in the following year’s Draft. If it signs two such players, it will also forfeit its fourth-highest remaining pick.

Examples: A team with one pick in each round of the 2019 Draft would lose its third-round pick. A team with two first-round picks and one pick in each subsequent round would lose its second-round pick.

• A team that neither exceeded the luxury tax in the preceding season nor receives revenue sharing will lose its second-highest selection in the following year’s Draft, as well as $500,000 from its international bonus pool for the upcoming signing period. If it signs two such players, it will also forfeit its third-highest remaining pick and an additional $500,000.

Examples: A team with one pick in each round of the 2019 Draft would lose its second-round pick. A team with two first-round picks would lose its second-highest first-round pick.

Determining exactly which picks can be forfeited is a little tricky, as essentially all picks count when determining a team’s second, third, or fourth pick, but compensatory picks from not signing a player the previous season, as well as the market/revenue picks at the end of the first and second rounds, are not subject to forfeiture. That said, since the market/revenue comp picks can be traded, if one of those picks is traded to another team, it is no longer protected. For example, Oakland was awarded the 40th pick in this year’s draft. That pick would have been a protected pick for the club, but since they traded it to Tampa Bay in the Jurickson Profar deal, it becomes subject to potential forfeiture for the Rays if they were to sign Dallas Keuchel or Craig Kimbrel.

To provide concrete examples, the table below shows the pick every team would give up for signing Keuchel or Kimbrel right now, along with the slot value for that pick (which can be found here), and the present value of the pick based on my research. Also included is the value of the international money penalty based Kiley McDaniel’s research, with one dollar of international spending estimated at five times that amount in value.

A note about this table: Houston and Boston are assumed to sign their own free agent, and thus not get a compensatory pick, which is the value listed below. In reality, that pick is now worth considerably less, as it is far less likely to happen. If Boston or Houston were to sign the other team’s free agents, the cost would be significantly higher.

Penalty for Signing Dallas Keuchel or Craig Kimbrel
Pick for FA Slot Amount Present Value of Pick International Value Lost Extra Cost of FA
NYY 38 $1,952,300 $8.1 M $2.5 M $10.6 M
TEX 41 $1,813,500 $7.4 M $2.5 M $9.9 M
ARI 33 $2,202,200 $9.3 M — $9.3 M
CHW 45 $1,650,200 $6.7 M $2.5 M $9.2 M
SFG 51 $1,436,900 $5.8 M $2.5 M $8.3 M
TOR 52 $1,403,200 $5.7 M $2.5 M $8.2 M
NYM 53 $1,370,400 $5.5 M $2.5 M $8.0 M
LAA 55 $1,307,000 $5.3 M $2.5 M $7.8 M
TBR 40 $1,856,700 $7.6 M — $7.6 M
STL 58 $1,214,300 $4.9 M $2.5 M $7.4 M
CHC 64 $1,050,300 $4.3 M $2.5 M $6.8 M
PHI 91 $647,300 $3.8 M $2.5 M $6.3 M
WSH 94, 183 $884,200 $6.3 M — $6.3 M
LAD 78 $793,000 $3.8 M $2.5 M $6.3 M
MIN 54 $1,338,500 $5.4 M — $5.4 M
PIT 57 $1,243,600 $5.0 M — $5.0 M
ATL 60 $1,157,400 $4.7 M — $4.7 M
BAL 79 $780,400 $3.8 M — $3.8 M
KCR 80 $767,800 $3.8 M — $3.8 M
MIA 46 $1,617,400 $6.6 M — $3.8 M
DET 83 $733,100 $3.8 M — $3.8 M
SDP 84 $721,900 $3.8 M — $3.8 M
CIN 85 $710,700 $3.8 M — $3.8 M
SEA 76 $818,200 $3.8 M — $3.8 M
COL 100 $581,600 $3.8 M — $3.8 M
CLE 101 $577,000 $3.8 M — $3.8 M
OAK 104 $560,000 $3.8 M — $3.8 M
HOU 79* $780,400 $3.8 M $2.5 M $3.8 M
MIL 133 $422,300 $2.8 M — $2.8 M
BOS 138* $402,000 $2.5 M — $2.5 M

For no team is the extra cost greater than the amount guaranteed to Matt Harvey this offseason and for half the teams, the cost is around what Daniel Descalso or Jordy Mercer received. These are not large sums. This list isn’t meant to provide a justification for a team signing or not signing any particular free agent, but it does show that there are pretty significant differences in the penalties teams face. The amounts of money we are talking about shouldn’t be the deciding factor in determining whether or not to sign a free agent, and “We are unwilling to forfeit a draft selection to sign Player X” is actually a prohibited phrase under the CBA, whether on or off the record. Teams can and do factor in the value of a draft pick when making an offer. The argument that teams horde draft picks as things to be held at all costs rings false when Cleveland, Cincinnati, Milwaukee, Oakland, and St. Louis have all traded early-round draft picks in the current draft alone.

A handful of teams would incur additional penalties if they signed another free agent in the form of competitive balance taxes. An extra $18 million in salary would result in only a few million in penalties for teams like the Yankees and Cubs, though the Red Sox would pay an additional $15 million if they added the same amount to their roster. As for why the new qualifying offer system didn’t provide the improvements players expected, we can look at how the old rules applied compared to the current system. Under the old system, teams gave up their first pick so long as it wasn’t in the top 10. For teams picking in the middle of the first round, this constituted a pretty sizable amount of potential value lost, particularly under a system with a hard draft cap and the inability to pay more for greater talent later.

Using this year’s draft as an example, here is the value teams would give up under the old system versus the new system. Some of the penalties above might not match those below, as trades, qualifying offers, and free agent signings weren’t assumed below so we could get a better theoretical understanding of the differences.

Draft Pick Penalty Values In CBA Compared to Old CBA
Old CBA New CBA Difference
BAL $7.2 M $3.8 M -$3.4 M
KCR $6.9 M $3.8 M -$3.1 M
CHW $6.7 M $9.2 M $2.5 M
MIA $8.8 M $6.6 M -$2.2 M
DET $6.4 M $3.8 M -$2.6 M
SDP $6.3 M $3.8 M -$2.5 M
CIN $8.1 M $6.1 M -$2.0 M
TEX $7.4 M $9.9 M $2.5 M
ATL $14.1 M $4.7 M -$9.4 M
SFG $5.8 M $8.3 M $2.5 M
TOR $22.2 M $8.2 M -$14.0 M
NYM $21.1 M $8.0 M -$13.1 M
MIN $20.2 M $7.8 M -$12.4 M
PHI $19.2 M $7.8 M -$11.8 M
LAA $18.4 M $7.8 M -$10.6 M
ARI $17.6 M $9.3 M -$8.3 M
WSH $16.8 M $12.5 M -$4.3 M
PIT $16.1 M $5.0 M -$11.1 M
STL $15.4 M $7.4 M -$8.0 M
SEA $14.8 M $3.8 M -$11.0 M
TBR $13.6 M $7.6 M -$6.0 M
COL $13.0 M $3.8 M -$9.2 M
CLE $12.5 M $3.8 M -$8.7 M
LAD $12.0 M $6.8 M -$5.2 M
CHC $11.1 M $6.8 M -$4.3 M
MIL $10.7 M $4.3 M -$6.4 M
OAK $10.3 M $4.2 M -$6.1 M
NYY $10.1 M $10.6 M $0.5 M
HOU $9.5 M $6.5 M -$3.0 M
BOS $7.0 M $8.9 M $1.9 M
AVERAGE $12.3 M $6.7 M -$5.6 M

The penalty was lessened, but for teams picking in the top 10, it was virtually unchanged, and for teams paying the competitive balance tax, it was the same or worse. The gap would be even smaller if the Cubs, Yankees, and Dodgers were over the competitive balance tax as they have been fairly recently. While the most substantial improvements in terms of lessening the penalty come right in the middle of the draft, those teams generally still have the biggest penalties, with teams at the end of the draft not seeing much of a change. If draft picks played a big role in free agency prior to the current CBA, there isn’t that much reason to think the new CBA constitutes a big step forward, as the number of teams significantly affected isn’t that great and most of those teams were still left with penalties approaching eight figures.

Whether or not it is a sound decision to sign Dallas Keuchel or Craig Kimbrel at their current asking prices, it is important to understand the exact cost of signing either at this point in the baseball calendar. There is certainly a credible argument to be made that for the teams that might need those players now, the cost of their missed production over two months of the season outweighs the penalties above, and perhaps by a significant margin. There is always a need for starting pitchers and relievers, and most teams had a pretty good idea if they would be contending this season. If these players were available for the same price now as they were at the beginning of the season, which we don’t know, then not signing them then was a poor choice for most teams. Now the missed production is a sunk cost, and the penalties for the draft pick, when signing a player only gets you another week of their services, weigh more heavily. Even still, the costs aren’t great and shouldn’t be too difficult for any team to justify whether it is for this season or into the future.


How Sinclair’s Purchase of Baseball Sports Networks Will Affect You

Near the end of 2017, reports surfaced of a massive deal that would see Disney buy more than $50 billion in FOX assets, including 22 regional sports networks that broadcast the games of about half of the 30 major league baseball franchises. After a bidding war between Comcast and Disney saw the latter win out, moves needed to be made to satisfy antitrust concerns. Given Disney’s already powerful place in the market with its ESPN family of channels, one of those moves included the sale of those regional sports networks. The first domino fell in March when the Yankees agreed to buy back the YES Network at a total valuation of around $3.5 billion dollars. Now, the remaining dominoes appear to have fallen, with the Wall Street Journal first reporting that Sinclair Broadcasting Group has agreed to buy the remaining 21 networks, valued at $10.6 billion.

The networks included in the deal are as follows:

MLB Regional Sports Networks Purchased by Sinclair
Team Network
Angels Fox Sports West
Braves Fox Sports South/Southeast
Brewers Fox Sports Wisconsin
Cardinals Fox Sports Midwest
Diamondbacks Fox Sports Arizona
Indians Fox SportsTime Ohio
Marlins Fox Sports Florida
Padres Fox Sports San Diego
Rangers Fox Sports Southwest
Rays Fox Sports Sun
Reds Fox Sports Ohio
Royals Fox Sports Kansas City
Tigers Fox Sports Detroit
Twins Fox Sports North
Other networks included in this deal are Fox Sports Carolinas, Fox Sports Indiana, Fox Sports New Orleans, Fox Sports Oklahoma, Fox Sports Prime Ticket, and Fox Sports Tennessee. Sinclair has previous reached deals with the Cubs (Marquee Network) and Yankees (YES) for less than a controlling interest.

Read the rest of this entry »