Last week, we looked at a few single-inning relievers who changed hands in the recent flurry of transactions. We’ll wrap up this series with another small reliever signing, as well as looking at two swingman/starter-types who could have a larger role on their new teams in the upcoming season.
With Quantrill coming off a career-worst year and with a looming arbitration salary estimated at $6.6 million, the Guardians decided to part ways with the 28-year-old righty, designating him for assignment to clear up 40-man roster space. The Rockies opted to cut the waiver line, acquiring him in exchange for low-minors catcher Kody Huff. Read the rest of this entry »
Up in Seattle, the Mariners had a problem. Eugenio Suárez, who the team initially acquired as salary ballast in the trade that brought them Jesse Winker, was due to make $11 million next year – $13 million if you count a buyout on a team option for 2025. This wasn’t a huge problem – Suárez had been solid since joining the team, racking up 7.3 WAR in two seasons – but for a club whose payroll has bounced around between $110 million and $140 million in recent years, it’s a sizable chunk of the puzzle.
What’s more, Jerry Dipoto telegraphed the team’s intention to favor long-term budget sustainability over short-term upgrades in his now-infamous 54% remark. Dipoto apologized for the tone of those comments – “doing the fans a favor” is just not a good way to phrase things – but the broad point was hard to miss. The Mariners are committed to building their team for the long run on their own terms, which seems to mean prioritizing payroll savings and cost-controlled players wherever possible. Read the rest of this entry »
Dave Dombrowski has had a highly successful career as a top-level front-office executive. Now the President of Baseball Operations for the Philadelphia Phillies, the 67-year-old Western Michigan University graduate’s resume includes World Series titles with the Florida Marlins and the Boston Red Sox, while nine other teams he’s constructed have reached the postseason before falling short. His current club has played October baseball in each of the past two seasons.
As Detroit sports fans know all too well, five of Dombrowski’s not-quite campaigns came with the Tigers from 2006-2014. Moreover, the majority of those disappointments are notable for a particular reason: a lack of reliable back-end bullpen arms torpedoed multiple opportunities to take home a title.
(Tigers fans wanting to avoid angst might want to skip the next two paragraphs.)
In Game 4 of the 2006 World Series, Fernando Rodney and Joel Zumaya combined to allow three late-inning runs in a 5-4 loss to the St. Louis Cardinals. In 2011 the Tigers twice lost ALCS games in which the Texas Rangers scored four runs in the 11th inning, Two years later, five Detroit relievers combined to cough up a 5-1 eighth-inning lead in ALCS Game 2 against the Boston Red Sox, ruining a Max Scherzer start and depriving the Tabbies of what would have been a 2-0 series lead. That year’s Game 7 was even more painful. A 2-1 seventh-inning lead, this in another well-pitched Scherzer start, turned into a 5-2 loss when Jose Veras gave up a grand slam to Shane Victorino. Read the rest of this entry »
José Ramírez is the definition of a set-it-and-forget-it player, and I mean that at least a little bit literally. Neither we nor our friends over at Baseball Prospectus published a single article that focused on him during a 2023 season when, for the fourth time in a row, he finished in the top 10 in the AL MVP voting. He turned out to have a very interesting season, and not just because he was, as always, excellent.
In June of 2022, Ramírez injured the ulnar collateral ligament in his right thumb. To the surprise of the Cleveland coaching staff, he decided to play through significant pain and postpone surgery until the offseason. Despite seeing his power drop off dramatically, he ended the season with a 141 wRC+ and 6.4 WAR. He finally had the surgery in November and came into the 2023 season healthy, but he got off to a slow start and finished with a 123 wRC+. It was his worst showing since 2019, when a broken hamate bone ended his season prematurely. (As an aside, if you’re desperate for for reassurance that Mike Trout will bounce back from his hamate injury, look no further than Ramírez, who immediately returned to superstardom in 2020.) Read the rest of this entry »
Last week I covered the American League half of the flurry of transactional activity that occurred as a result of the 40-man roster and non-tender deadlines. Is any one move here as impactful as signing a Yoshinobu Yamamoto or a Matt Chapman? No, but when your favorite team experiences a rash of injuries in June, whether or not they have the depth to scrap and compete is often dictated by the people and processes that surround this day. Below are my thoughts on the National League, with some quick scouting snippets on most of the added players and thoughts about roster construction where I had something to say.
Arizona Diamondbacks
The Diamondbacks lone addition was lefty Blake Walston, a former $2.5 million high school signee who, despite being young for his class and physically projectable as an amateur, has seen his fastball velocity plateau and slightly decline since he signed. He’s had fits and starts where he’s thrown harder, but for the most part, Walston’s fastball still sits 89-92 mph and his performance peripherals took a nosedive in 2023, though part of that was likely because of the PCL hitting environment. The lanky 22-year-old is still a fair long-term prospect because of his age and what one could reasonably hope will still be late-arriving physicality, but for now, I’d consider him at the very back of Arizona’s 40-man starting pitching depth chart. Read the rest of this entry »
All things considered, James Paxton had a productive season. In 19 starts comprising 96 innings, the recently turned–35-year-old left-hander fanned 101 batters, allowed 93 hits and logged a 4.50 ERA and a 4.68 FIP. The erstwhile Seattle Mariners and New York Yankees rotation mainstay put up those numbers with the Boston Red Sox between May 12 and September 1, and he did so after throwing just 1.1 innings over the past two-plus seasons. “Big Maple” underwent Tommy John surgery in April 2021, and he remained on the shelf the following year due to a lat tear incurred late in the rehab process. Factor in the truncated 2020 COVID campaign, and he’d tossed just 22.1 frames since September 2019.
Paxton, now a free agent, has been a quality pitcher when healthy. From 2017 to ’19, the hard-throwing Ladner, British Columbia native went 38–17 with a 3.54 ERA, a 3.26 FIP, and a 30.0% strikeout rate. His heater averaged 95.6 mph over that three-year span, just a few ticks over this year’s 95.3. As for next season, he expects not only to be throwing every bit as hard, but also to be close to his old self in terms of overall arsenal quality. He addressed that subject, as well as his experience returning to the mound in 2023, when I spoke to him at the end of September.
———
David Laurila: You came back from Tommy John surgery. What has that experience been like in terms of your pitch quality?
James Paxton: “It’s definitely interesting coming back from it, the stuff differences [and] trying to figure out my arm again. I feel like the fastball came back, it felt really good, but the breaking stuff took some time. The cutter wasn’t the same pitch it was before Tommy John. I’m still kind of figuring that pitch out. I got to a place where it was good enough. I could use it, it just wasn’t the same as it was.”
Laurila: How has it been different?
Paxton: “I used to throw it harder. It was a shorter, harder slider, basically, and now it’s not quite as hard. I used to throw it 88–91 [mph] and now it’s like 85–87. It still has decent movement to it, but again, it’s just not quite the same pitch that it was before I got hurt. Maybe that’s something that will come back in year two. People say that your stuff isn’t really 100% back until the year after your first year back from Tommy John.” Read the rest of this entry »
Good relief is hard to find. Well, that’s not strictly true. Pretty much every team in baseball has multiple good relievers, random guys who throw 100 mph and snap off ludicrous sliders. But enough good relief pitching is hard to find, because it takes a village’s worth of relievers to get through a season, and the playoffs are even more challenging. As teams go to their bullpen earlier and earlier, they put more pressure on every arm in it, and the penalties to overworking your best few arms areharsh.
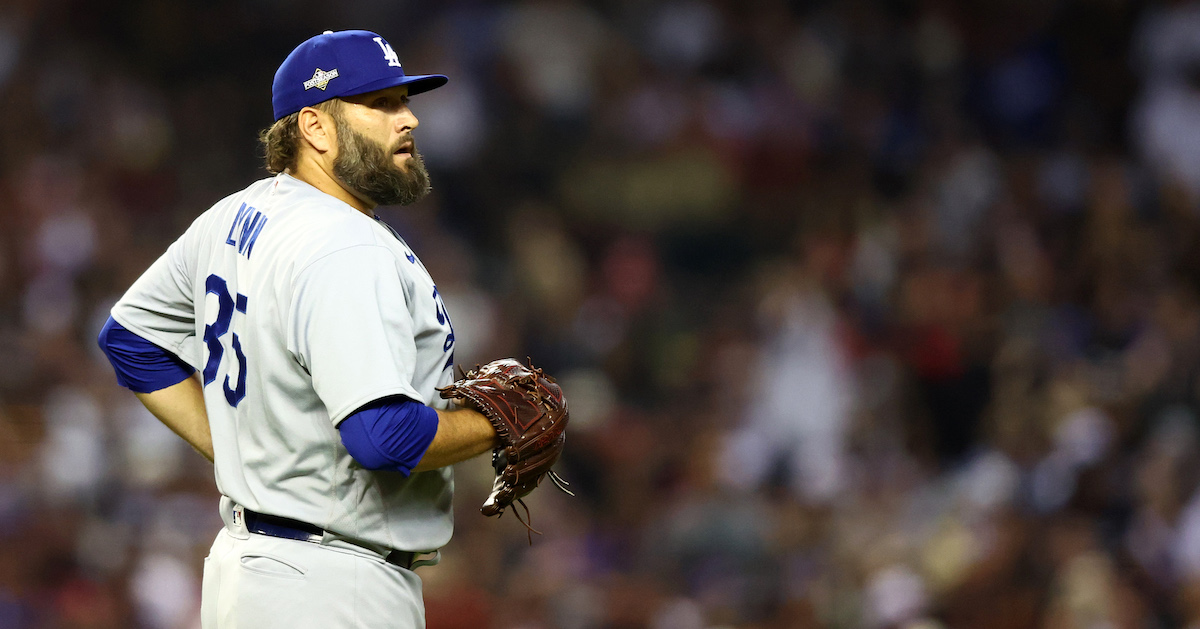
The theme of free agency so far is returning to one’s origins. A day after Aaron Nolare-upped with the Phillies, Lance Lynnsigned a one-year contract with the St. Louis Cardinals, the team that drafted him in the first round in 2008. Lynn’s deal will pay him $10 million in 2024, with a 2025 club option for $11 million that comes with a $1 million buyout, and $3 million in incentives. That brings the total guarantee to $11 million and the total potential value of the contract to $24 million.
Lynn won a World Series with St. Louis as a rookie in 2011, made his first All-Star team in 2012, and in total pitched six years and nearly 1,000 innings with the club before leaving as a free agent after the 2017 season.
In the few weeks following the conclusion of the World Series, with no meaningful major league games on the calendar until March, our collective attention shifts quickly to hot stove season. But as eager as we are to start slotting free agents into new rotations, bullpens, and lineups, there’s a bit of paperwork to take care of before the full extent of the winter’s class is even known. Teams have exclusive five-day windows with their departing clients, players and teams decide to opt in or out of optional contract years, and qualifying offers are issued and routinely rejected.
This past Friday was one of the final deadlines of MLB’s early offseason, by which teams had to choose whether or not to tender contracts to players on their 40-man roster with fewer than six years of service time. Those tendered contracts will remain under team control in 2024, but those whom teams declined to offer contracts were added to the free-agent pool and will look for work elsewhere. By the end of the day, a majority of teams had at least one extra empty 40-man spot, and dozens of players — headlined by two-time All-Star Brandon Woodruff — were newly available.
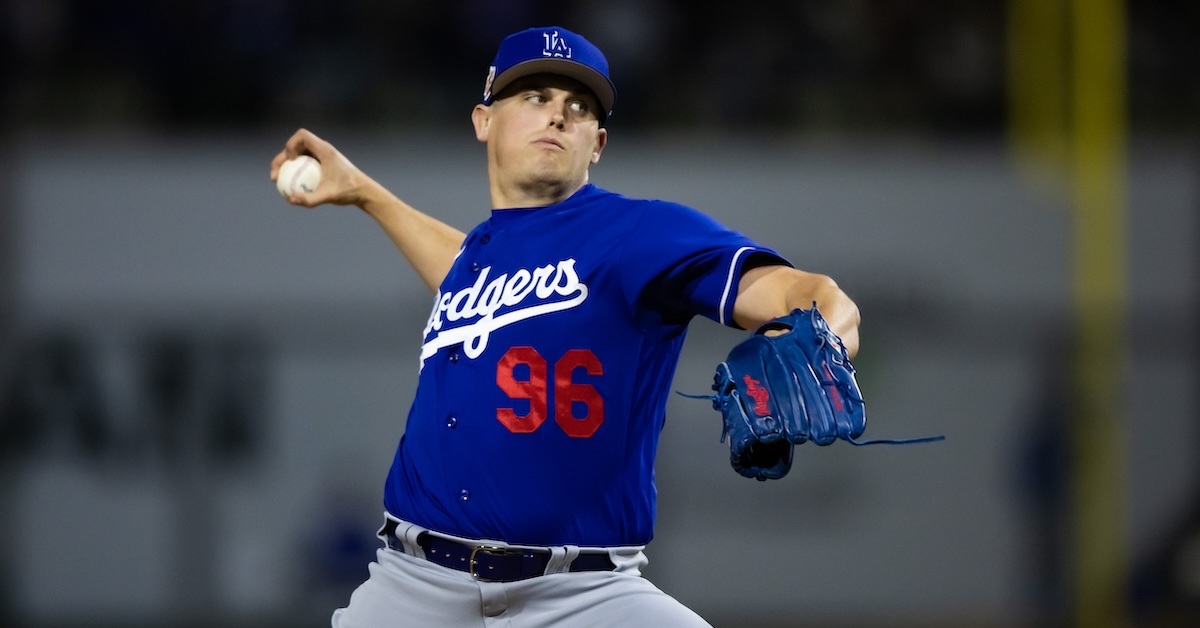
Woodruff, who is recovering from a shoulder surgery and will miss most of the upcoming season, is certainly the standout arm in this year’s cohort of non-tenders, but he’s not exactly the prototypical non-tender. In this year’s crop, there are a number of interesting low-profile arms who are looking to re-establish themselves as bullpen contributors with another big league opportunity after injuries or stretches of underperformance. Let’s take a look at a handful of guys who will be hoping to find good fits as low-risk potential contributors over the next few months. Read the rest of this entry »
Admit it: you had a feeling it might go this way. Aaron Nola is headed back to Philadelphia. After a short trip to free agency, he re-signed with the Phillies for seven years and $172 million, as USA TODAY’s Bob Nightengale first reported. He’s the first domino to fall this offseason, but this was hardly a shocking outcome. The move makes a lot of sense for both team and player, which helps explain why it came to pass so swiftly.
Let’s start with the team side of things. The Phillies are bona fide World Series contenders, and they’re built to win right this minute. Bryce Harper, Trea Turner, and J.T. Realmuto are all at or near the peak of their careers. Kyle Schwarber and Nick Castellanos are in the same boat. The Philly offense is so good right now that it would be borderline criminal not to contend, and that’s clearly been the team’s plan. They made the World Series in 2022, then went out and added Turner in the offseason to bolster their squad.
If they didn’t act this offseason, they’d be moving in the wrong direction. The Phillies’ recent regular seasons may have been built around an excellent offense, but their playoff plan has been all about pitching. Nola and Zack Wheeler have each been October workhorses; taking advantage of off days, they’ve started 19 of the team’s 30 playoff games in the last two years. Giving the ball to elite starters that frequently takes pressure off both the rest of the rotation and the bullpen, the team’s two great weaknesses. Read the rest of this entry »