All relief pitchers are failed starters. In the future, everyone will be world famous for 15 minutes. All great world-historic facts and personages appear, so to speak, twice… the first time as tragedy, the second time as farce.
Therefore: In the future, all relief pitchers will be starting pitchers for 15 minutes, twice: First as failure, then as tragedy.
This jumble of aphorisms is what plopped out of my head when I read a bit of surprising news: The Detroit Tigers are interested in Ryan Helsley — reasonable enough, since he’s been a good high-leverage reliever for several years — as a starting pitcher.
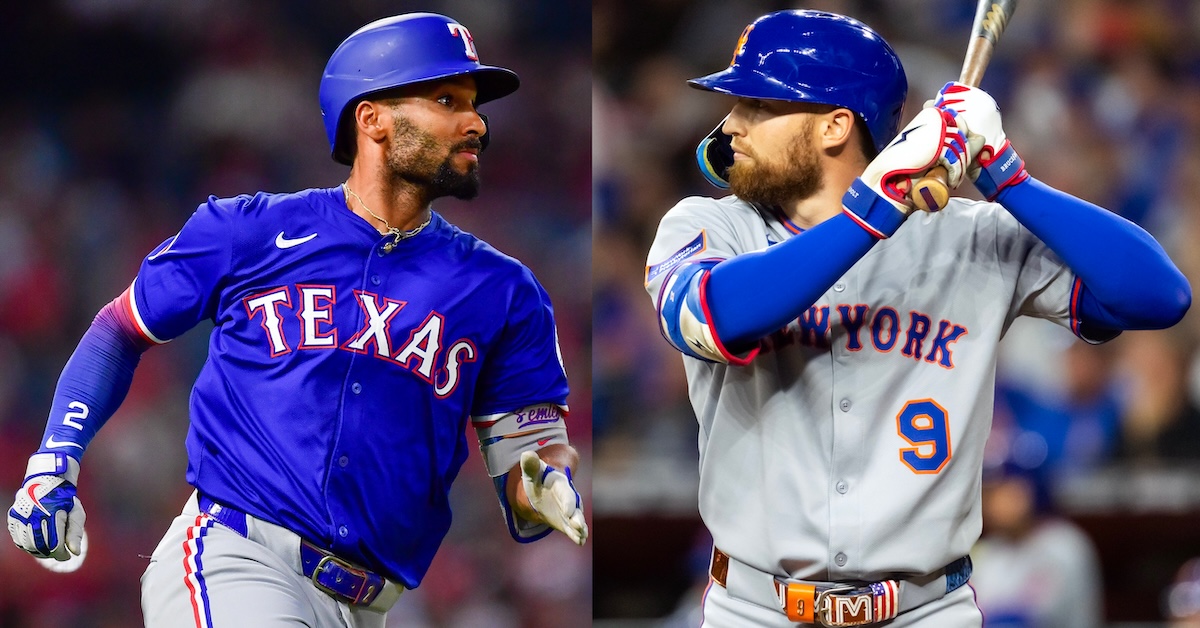
The New York Mets are trading outfielder Brandon Nimmo to the Texas Rangers in exchange for infielder Marcus Semien, ESPN’s Jeff Passan reported Sunday night. You don’t often see one-for-one trades involving two players with a combined 66.9 career WAR in their past, but this deal was made possible by the combined $173.5 million owed Nimmo and Semien in the future.
The Mets and Rangers are both top-10 payroll teams and recidivist whales in the free agent market (with the caveat that the Mets are somewhat more top-payroll than the Rangers are), so this is not a straight-up salary dump. Indeed, only a trivial amount of money — $5 million moving from New York to Texas, according to Jon Heyman — is changing hands. That greases the skids, but it’s only about 5% of what Nimmo’s owed, and less than 3% of the total remaining value of the contracts being moved.
Semien and Nimmo have both been excellent players in the recent past, as reflected in their compensation. Semien is on a seven-year, $175 million contract he signed with the Rangers before the 2022 season; Nimmo had a .385 career OBP, and was coming off a 5.5 WAR season, when he signed with the Mets a year later for $162 million over eight years. Read the rest of this entry »
Mike Lang/Sarasota Herald-Tribune/USA TODAY NETWORK via Imagn Images
How much will the ABS challenge system hurt the ability of catchers to frame pitches? That question has been bouncing around my brain for quite a while now. I’d been waiting for the offseason to really dive into the numbers, and, well, we’re here. It’s the offseason. But now that I’ve dug into all the data I could find, I think the entire premise of that question might be flawed. I thought that correcting a couple of ball-strike calls a game would erase a couple of well-framed pitches. This would no doubt hurt the better framers more than it hurt the worse ones, simply because they earn more strikes and would have more to lose. At the same time, the lesser framers would have juicier pitches to challenge, boosting their numbers a bit. As a result, the gap between good and bad framers would shrink, furthering a trend that’s been going on since we first gained the ability to quantify the value of pitch framing. It would still be valuable, just not quite as valuable as it used to be. But I’m not so sure anymore. Let’s start with the data.
I pulled all the major league framing data I could. I pulled league-wide and individual catcher called strike rates both inside and outside the strike zone for the majors and for Triple-A, which in 2025 used the same challenge system we’ll see in 2026. I can tell you that 26 catchers got a significant amount of playing time in both Triple-A and the majors last season, and their called strike rate on pitches in the shadow zone in the majors fell by an average of 1.4 percentage points within the zone and 1.7 percentage points outside it relative to what it was in the minors. So while the Triple-A strike zone may be tighter, pitch framing is still harder in the majors. But the only data about how the challenge system has actually worked in the minors and in spring training of 2025 comes from MLB press releases, and it’s extremely sparse.
Of course, that data definitely exists. Baseball Savant guru Tom Tango wrote up a bunch of interesting takeaways from it on his blog a month ago. As you’d expect, players are more likely to challenge calls in higher-leverage moments, in the later innings, and on pitches that decide the outcome of an at-bat. For that reason, they tend to be less successful in those situations; they’re not challenging because they’re sure they’re right, but because they really want the call to go the other way. Tango also broke down some catchers and batters who were particularly good or bad at challenging. Not only did he provide their stats – poor Zac Veen challenged 24 pitches and got just three overturned – but Tango showed that Savant will be rolling out challenge probability numbers next year, using the distance from the edge of the strike zone to calculate the likelihood that any particular pitch will get challenged, and that any particular challenge will be successful. From there, it’s easy to calculate how much challenge value each batter or catcher creates above the average player. Read the rest of this entry »
Friday was a key deadline in the offseason calendar: the last day that teams could non-tender players instead of offering them a contract in arbitration. It’s something of an annual tradition. Once a year, a bunch of guys whose names inspire you to think “oh, he’s not bad” nonetheless get non-tendered because their performance doesn’t measure up to their projected salary. This year, the non-tender group was larger than I’m used to, so I think it merits a recap.
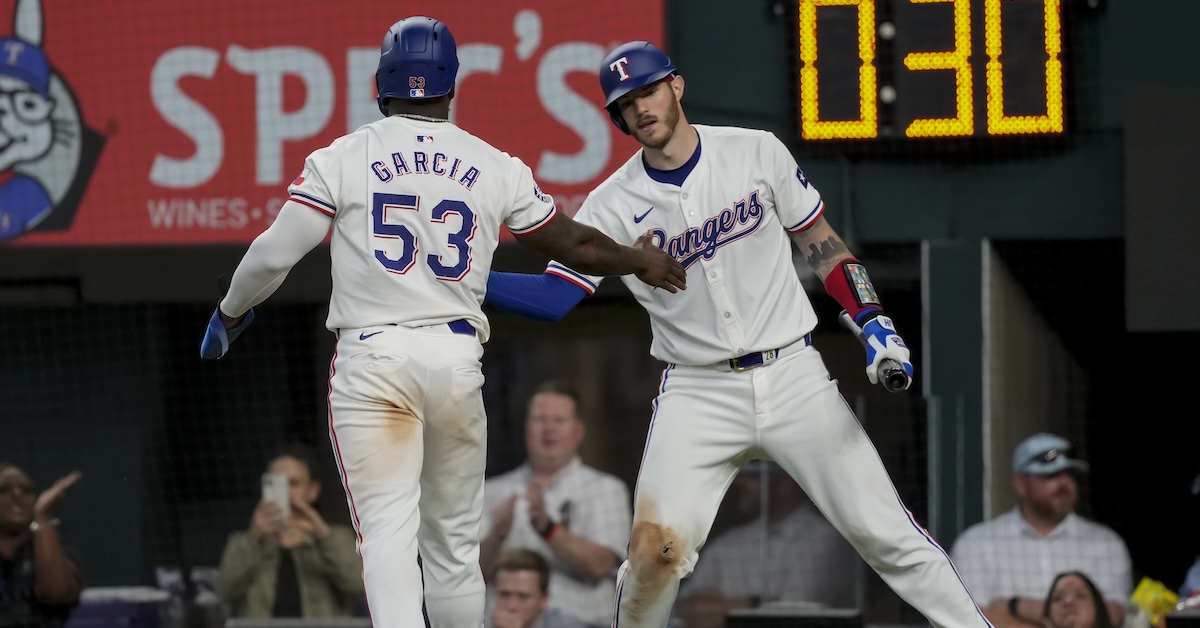
One classic archetype of the players who get non-tendered is the older breakout who then regresses toward the mean in subsequent years. An example: Adolis García, probably the most famous player in this group, burst onto the scene as a 28-year-old rookie in 2021, piling up 10.6 WAR in his first three full seasons. He starred on the 2023 World Series champion Rangers, blasting eight home runs and a record 22 RBI, and taking home ALCS MVP honors.
The next two years weren’t so halcyon, with García posting an aggregate 89 wRC+ and 0.6 WAR. Heading into his age-33 season, it’s hard to expect a return to his peak form; our projection systems think he’s more of a fourth outfielder than an everyday starter these days. The problem, from Texas’ standpoint, is that García earned $9.25 million this season in his second year of arbitration. He stood to make at least that much in his last pass through arb. The Rangers quite reasonably looked around for alternatives. Several free agent corner outfielders with similar projections were available, and probably for less. And Texas likely went into the Friday deadline with some idea that the Marcus Semien/Brandon Nimmo salary swap was on horizon, which meant fewer outfield openings; given that backdrop, García’s non-tender isn’t a big surprise. Read the rest of this entry »
When our 2025 Colorado Rockies Top Prospect list was published last January, a 24-year-old pitcher coming off of an underwhelming season ranked 14th with a 45+ FV. Over 54 innings with the Double-A Hartford Yard Goats, Juan Mejia had logged a 5.00 ERA and an equally-unhealthy 12.3% walk rate. Eric Longenhagen nonetheless remained enamored of his potential. Offering a “relatively bullish projection,” our lead prospect analyst wrote that the righty “is too freaky to slide,” because he possessed “one of the more explosive and athletic deliveries in the minors” as well as a mid-to-high-90s fastball and an “overtly nasty” slider.
Longenhagen’s faith was realized in the youngster’s rookie season. Not only did Mejia make 55 appearances, he put up a 3.96 ERA, a 3.71 FIP, and a 26.1% strikeout rate over 61-and-a-third innings. Among Rockies relievers, only Jimmy Herget took the mound more frequently and tossed more frames.
When I spoke to Mejia at Fenway Park this past summer — Colorado PR staffer Edwin Perez served as an interpreter — I learned that he has a connection with Red Sox right-hander Brayan Bello. Both were signed out of the Dominican Republic in 2017, and they were together, along with other starry-eyed hopefuls, when Mejia first caught the eye of a Rockies scout.
“When I was 16, I was doing a tryout,” recalled Mejia, who hails from Baní, roughly an hour south of Santo Domingo. “I don’t remember how many teams were there, but there were a lot of them. That’s where I met Brayan Bello, who a lot of scouts were there to see. Read the rest of this entry »
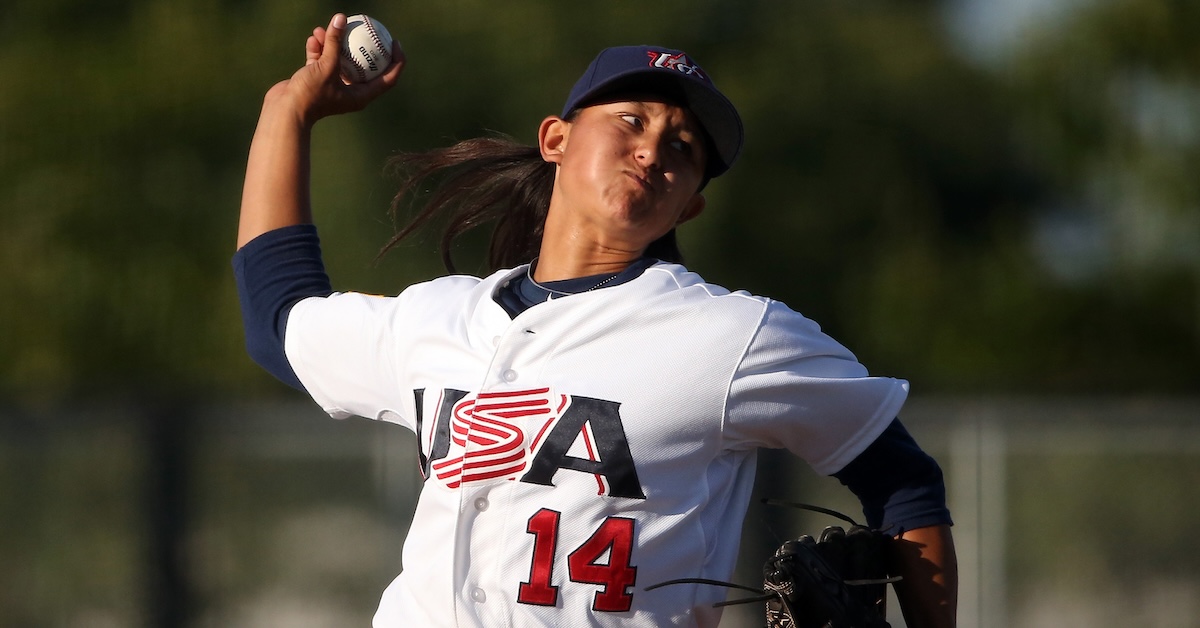
The Women’s Pro Baseball League held its inaugural draft on Thursday night. For many of the players who heard their names called, getting to play professional baseball is a dream they’ve carried since childhood, one they knew might never come true. Play won’t get underway until next August, but with the WPBL draft now in the history books, the dreams of 120 women are meaningfully closer to being realized.
Thursday night’s draft was the culmination of a busy few months for the new league. Since I last wrote about the WPBL in January, the league has announced key logistical information, such as the number of teams that will play during its first season, where those teams will play, and how much the teams will pay the players, and has also provided an update on the WPBL’s media and broadcast strategy. But despite all the new intel on how the league will be run, a few key components are still unknown. So before recapping the draft and the open tryout that determined the pool of draft-eligible players, let’s get up to date on what we do and don’t know about the WPBL so far.
If this is the first you’re hearing of the WPBL, here’s a quick primer. It’s a professional baseball league for women, the first of its kind since the All-American Girls Professional Baseball League (AAGPBL), which ran from 1943 to 1954. The WPBL was co-founded in October of 2024 by Justine Siegal — who is best known for founding Baseball For All, “[A] girls baseball nonprofit that builds gender equity by creating opportunities for girls to play, coach, and lead in the sport” — and Keith Stein, a businessman, lawyer, and member of the ownership group for a semiprofessional men’s baseball team in Toronto. Read the rest of this entry »
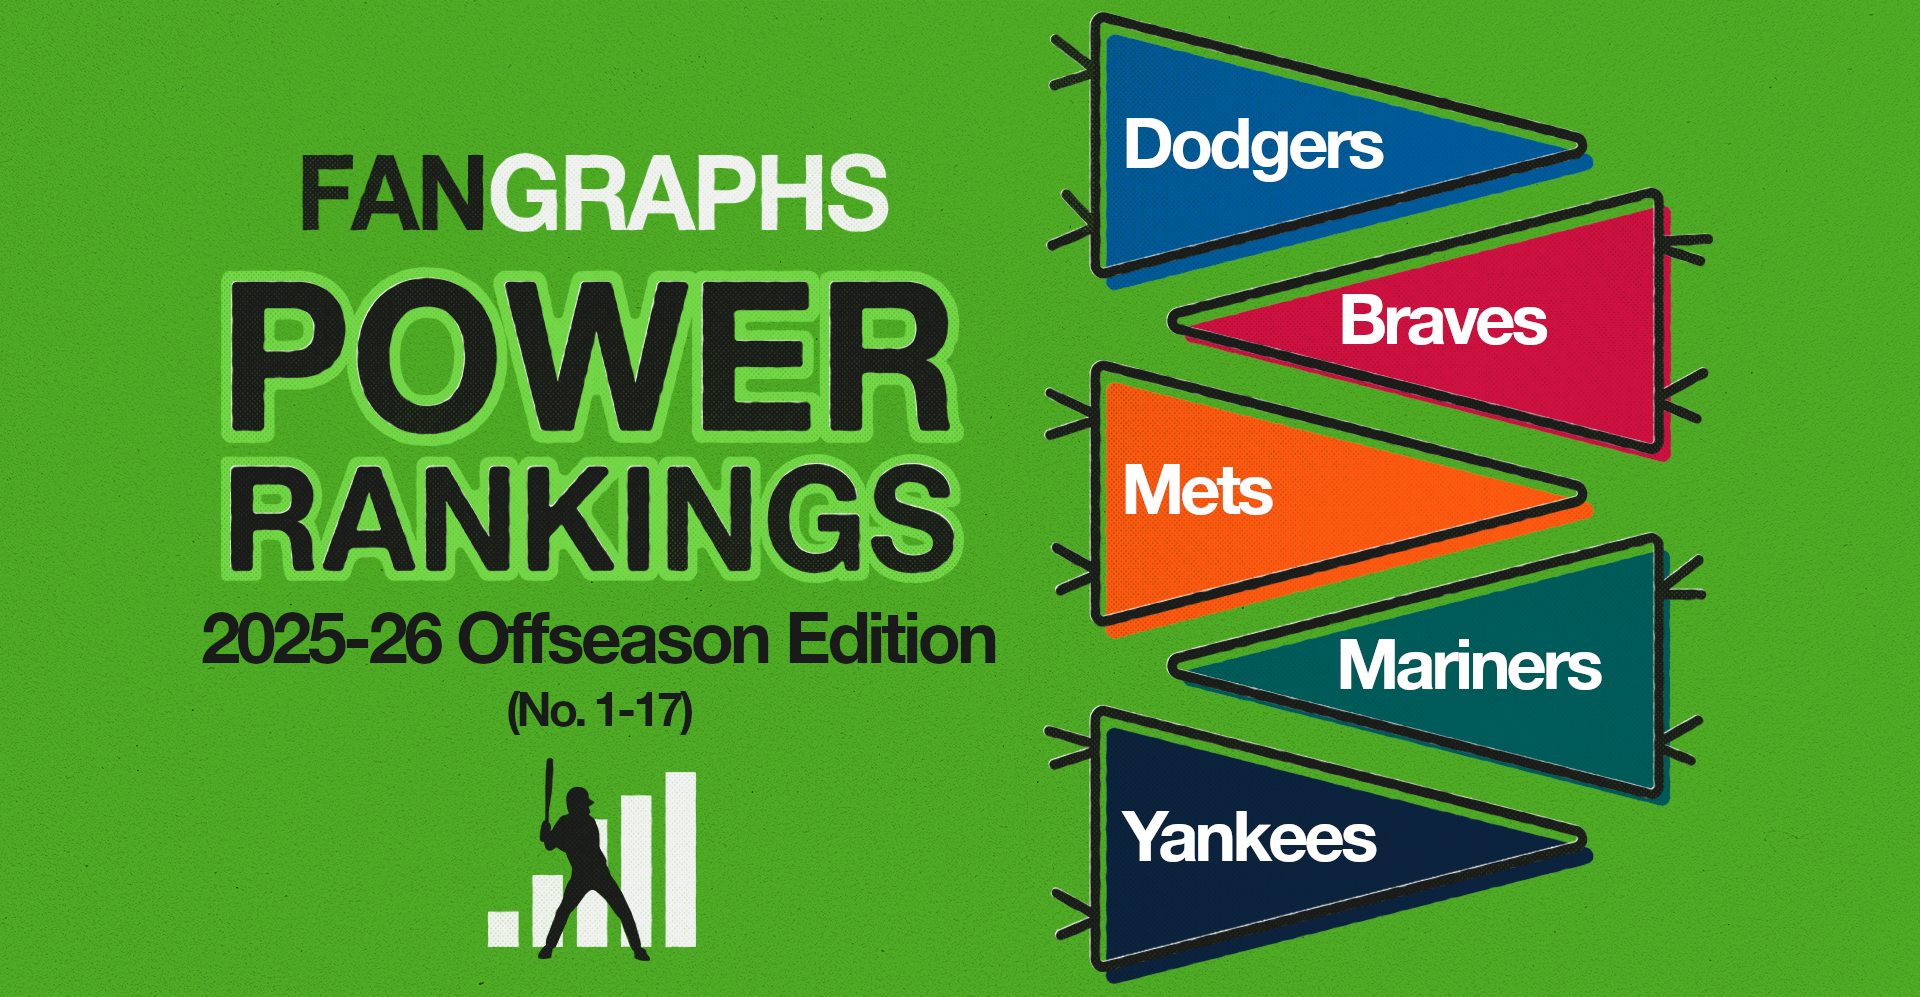
The hot stove has started to heat up, but it’s still pretty early in the offseason. On Tuesday, I took stock of how the early 2026 projections viewed the bottom 18 teams in baseball as they’re currently constructed. Today, I’ll take a look at the teams projected to finish with a .500 or better record in 2026. This exercise should give us a pretty good idea of which clubs would be ready to compete if the season started today, and which ones still have work to do this offseason.
Our power rankings use a modified Elo rating system. If you’re familiar with chess rankings or FiveThirtyEight’s defunct sports section, you’ll know that Elo is an elegant ranking format that measures teams’ relative strength and is very reactive to recent performance. For these offseason rankings, I’ve pulled the Depth Charts projections and calculated an implied Elo ranking for each team. Right now, our Depth Charts projections are powered entirely by the 2026 Steamer projections; the 2026 ZiPS projections will be folded in later in the offseason.
First up are the rankings, presented in a sortable table. Below that, I’ve grouped the teams into tiers, with comments on each club. You’ll notice that the official ordinal rankings don’t always match the tiers — there are times when I take editorial liberties in grouping teams together — but generally, the order is consistent. The delta column in the table below shows the change in ranking from the final regular season run of the power rankings. The rankings for teams 18–30 have been updated with the handful of moves that occurred around baseball since Part I was published. Read the rest of this entry »
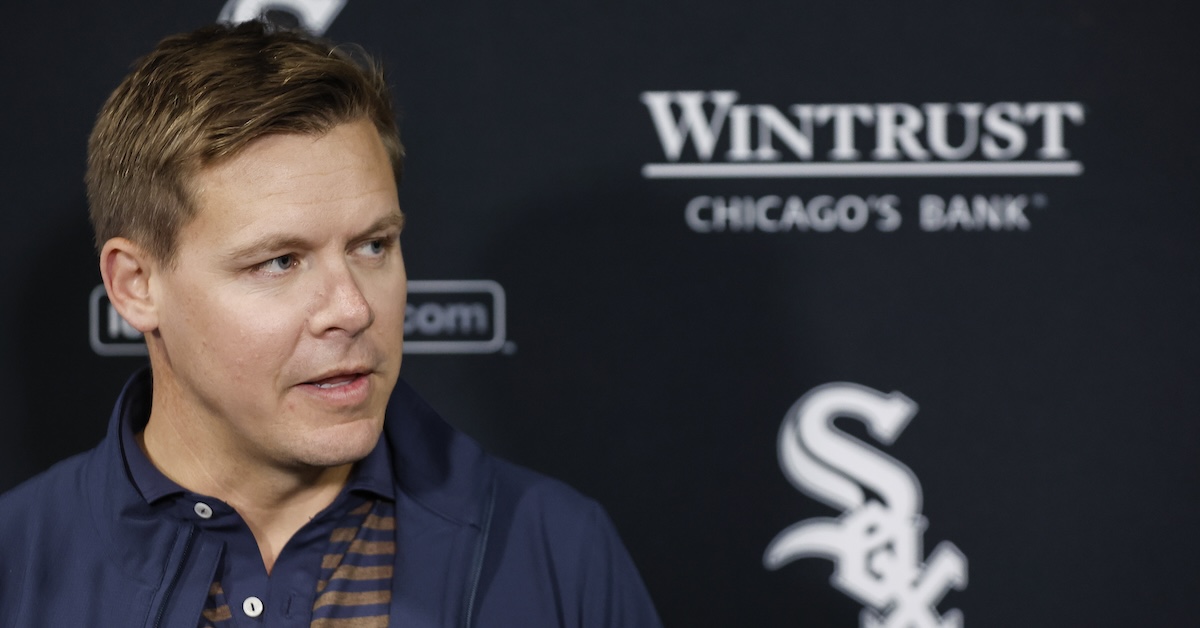
The Chicago White Sox have two of baseball’s most promising pitching prospects. Noah Schultz, a 22-year-old left-hander who was drafted 26th overall in 2022 out of an Oswego, Illinois high school is currently no. 22 on The Board with a 55 FV. Hagen Smith, himself a 22-year-old southpaw, was drafted fifth overall in 2024 out of the University of Arkansas and is no. 81 with a 50 FV. Each possesses a power arm, and both have a lot to prove in the forthcoming season — albeit for different reasons. Schultz was limited to 73 innings this year due to injury, while Smith dealt with command issues and lacks a solid third pitch.
I asked White Sox executive vice president/general manager Chris Getz about the young pitchers during last week’s GM Meetings in Las Vegas.
“For Noah, it was an inconsistent year,” Getz said of the 6-foot-10 Schultz, who struggled to the tune of a 4.68 ERA between Double-A Birmingham and Triple-A Charlotte. “Much of that was related to his knee — he had patellar tendonitis — and he needed be to shut down. He’s doing [physical therapy] and strengthening right now. I anticipate that once the knee is completely healed, once it is healthy and completely strong, we are going to get the version of Noah that made him a top prospect in our game. Read the rest of this entry »
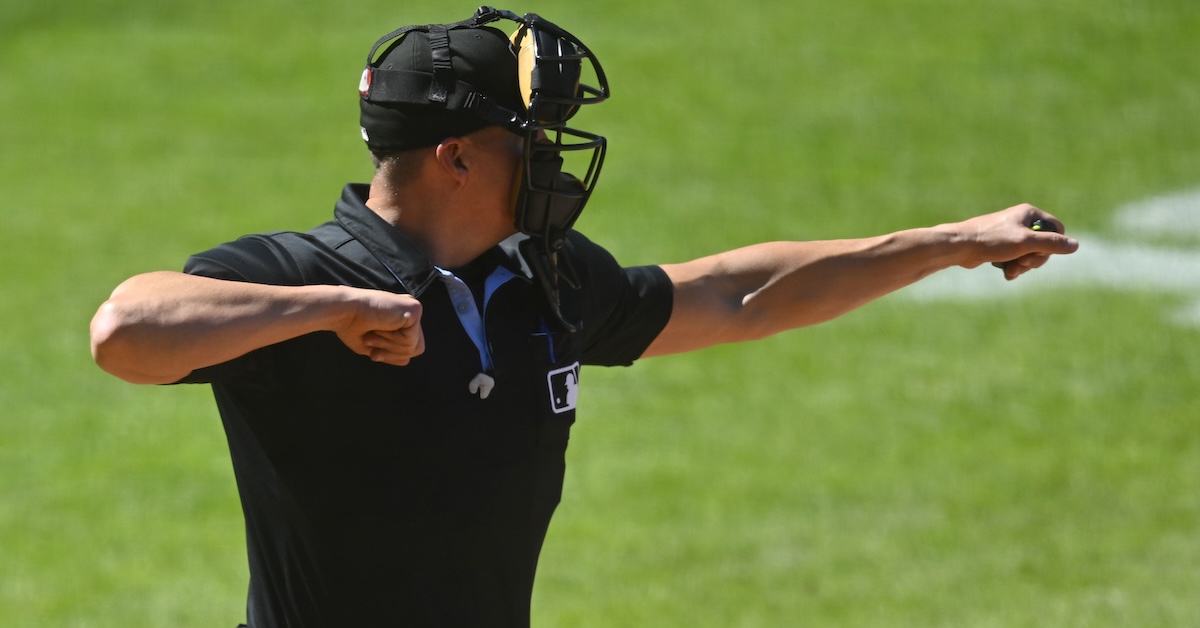
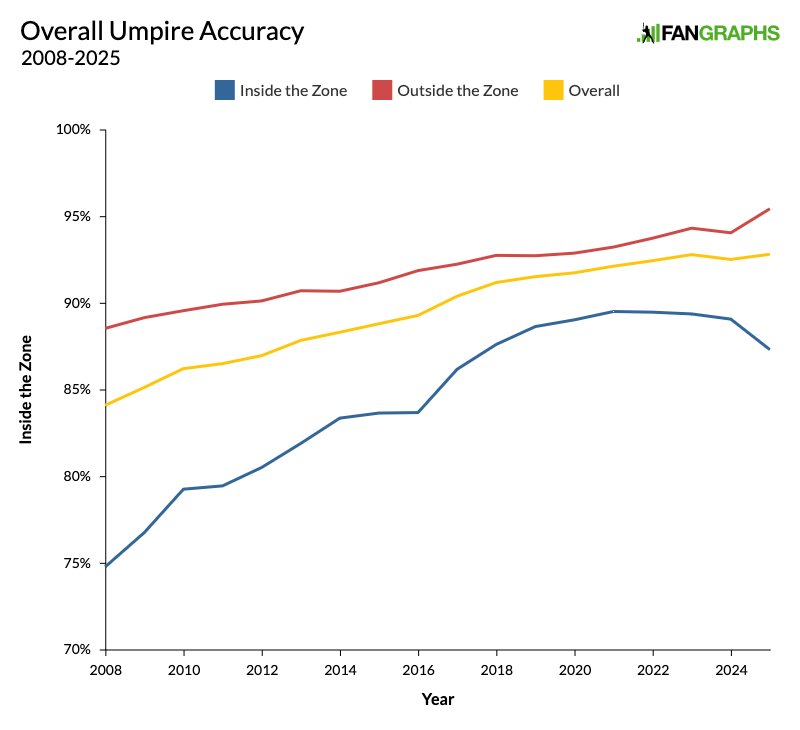
For four years now, I’ve been updatingyouonthechangingcontoursofthestrikezone. By my count, this is the 10th installment in that series and the sixth specifically about the accuracy of ball-strike calls on the edges of the zone. With the implementation of the ABS challenge system in 2026, these updates will no doubt start to look a bit different. This is our last umpire accuracy update of the pre-ABS era, so let’s take stock of where we are at the end.
After a tiny dip in 2024, umpires were back on track in 2025, posting a record-high accuracy rate of 92.83% overall. In fact, 2024 was the only year in the pitch-tracking era in which umpires didn’t set a record for accuracy. However, this latest record came with a bit of controversy. Early in the season, pitchers and catchers picked up on the fact that the strike zone seemed to have shrunk. The league tightened up the standards that it used to grade umpires, reducing the size of the buffer zone around the edges of the zone. As a result, accuracy shot up specifically on pitches outside the zone, even more specifically, on pitches just above the top of the zone, causing pitchers and catchers to complain that they were losing the high strike.
This graph reminds us of a couple facts that might just be so obvious that we rarely think about them. First, the vast majority of takes come on pitches outside the strike zone. Of course they do; those are the pitches you’re not supposed to swing at. This year, for example, 68% of the calls umpires had to make came on pitches outside the strike zone. Second, it’s easier to identify balls than it is to identify strikes. Of course it is; the area outside the zone is a lot bigger than the area inside the zone. Read the rest of this entry »
I was in Hawaii this past weekend, taking a nice vacation to wind down from the end of the baseball season, when I found myself thinking about intercept points. Weird? Overly baseball obsessed? Maybe. But in my defense, a kid at the pool kept swinging at a Wiffle ball almost hilariously late, spraying it “foul” every time. “Oh look, the next Luis Arraez,” I thought, before going back to my umbrella-adorned drink. But that stuck with me, and when I got home, a database query leapt out of my head fully formed, like Athena after Zeus’ headache.
Where is the optimal place to make contact with the ball? It depends on who’s swinging. Statcast measures every single swing’s contact point relative to a hitter’s center of mass, and that data clearly shows that there are many ways to succeed. That’s always stymied me as I’ve looked into swing path data. But that small child gave me an idea when he got off the best swing I’d seen all day, a Wiffle ball line drive that would have been a screamer down the left field foul line (he was batting lefty). Because his normal swing was so late, his best contact was ever so slightly less late. What if I bucketed hitters based on their own swings to look for swing timing clues?
I took every batter who produced 300 or more batted balls (foul balls or balls in play) in 2025. For each of those hitters, I took aggregate statistics for all of their results, then also split their batted balls into three groups: deepest contact point, middle contact point, and farthest forward contact point. You can think of it as late, on time, and early, adjusted for that player’s swing. The later you start your swing, the more you “let it travel,” the deeper your contact point relative to your center of mass. The earlier you start, the more you “get out in front,” the farther forward you make contact. Read the rest of this entry »