An eventful long weekend of baseball led to some changes at the top of the power rankings, with the teams toward the middle of the pack continuing to jostle for position.
A reminder for how these rankings are calculated: first, we take the three most important components of a team — their offense (wRC+), and their starting rotation and bullpen (a 50/50 blend of FIP- and RA9-, weighted by IP share) — and combine them to create an overall team quality metric. New for this year, I’ve opted to include defense as a component, though it’s weighted less heavily than offense and pitching. Some element of team defense is captured by RA9-, but now that FanGraphs has Statcast’s OAA/RAA available on our leaderboards, I’ve chosen to include that as the defensive component for each team. I also add in a factor for “luck,” adjusting a team’s win percentage based on expected win-loss record. The result is a power ranking, which is then presented in tiers below.
Note: All stats are through Sunday’s games.
Tier 1 – The Best of the Best
Team
Record
“Luck”
wRC+
SP-
RP-
RAA
Team Quality
Playoff Odds
Dodgers
33-14
-3
120
76
82
-6
165
98.9%
Astros
30-18
1
108
91
79
14
165
97.9%
Yankees
33-15
0
111
74
81
-4
154
97.5%
Mets
32-17
1
115
95
94
0
149
94.5%
The Dodgers have come roaring back into the top spot of these rankings with 13 wins in their last 16 games. Mookie Betts has blasted nine home runs in his last 17 games, and Trea Turner is in the midst of a 22-game hitting streak. If there’s something to be concerned about, it’s their team defense. A misplayed grounder cost them a game against the Phillies a couple of weeks ago, and it happened again last night against the Pirates.
Even though the Astros just lost a three-game series to the Mariners in which they were outscored 13–3, they’re still high up in these rankings and in the standings. The Angels’ recent struggles give them a bit of breathing room in the AL West, and Houston’s schedule lightens up over the next couple of weeks, with trips to Oakland and Kansas City before home series against Seattle and Miami.
After losing an epic, back-and-forth contest against the Giants on Tuesday, the Mets went out and swept the Phillies in three games over the weekend, then dropped 13 runs on the Nationals on Monday night. They’ve barely missed a beat after Max Scherzer hit the IL and are currently running away with the NL East. Read the rest of this entry »
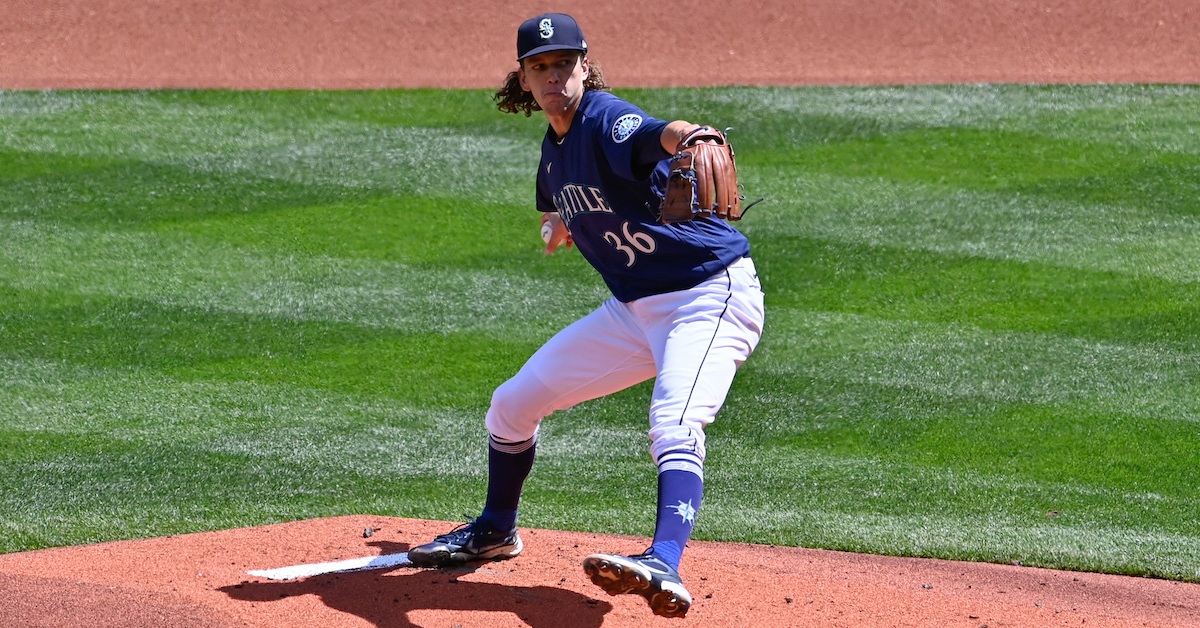
The Learning and Developing a Pitch series is back for another season, and we’re once again hearing from pitchers on a notable weapon in their arsenal. Today’s installment features a young Seattle Mariners right-hander, Logan Gilbert, and a sneaky-good San Diego Padres reliever, Nabil Crismatt, on their changeups.
———
Logan Gilbert, Seattle Mariners
“I changed the grip this offseason. I’d been throwing it a little more off my ring finger, and now it’s more of a traditional circle change. I’m also trying to throw it more like my fastball, which has helped the consistency. I obviously wanted to keep good action on it, but also be able to locate it in the zone; I wasn’t commanding the old one very well. More than anything, I was looking for something that I felt comfortable with. Read the rest of this entry »
The Los Angeles Angels can’t count clubhouse chemistry as the primary reason they entered Memorial Day weekend with the third most wins in the American League. Marquee players such as Mike Trout, Shohei Ohtani, and Anthony Rendon — not to mention Patrick Sandoval and Taylor Ward — bear a far larger responsibility for the club’s success. Which doesn’t mean that intangibles haven’t mattered. In the opinion of Angels GM Perry Minasian, they’ve actually mattered a lot.
Asked about his approach for building a winning team, Minasian responded with a rhetorical: “Do we have enough time for this?” The 42-year-old baseball lifer then proceeded to champion the value of non-quantifiable characteristics.
“Philosophically, we’re not only trying to get talented players,” Minasian told me when the Angels visited Fenway Park earlier this month. “We’re trying to get the right DNA, the right mix of guys from a makeup standpoint. That’s really important to me. Growing up around the game — I’ve been fortunate to spend a lot of time in big-league clubhouses — I really believe in mix and fit. It’s hard to quantify, but I think it has a huge impact. The room makes a big difference.”
So too does on-field talent. Identifying it — ditto projecting it — will always be an integral part of a general manager’s job. Minasian knows that as well as anyone. Read the rest of this entry »
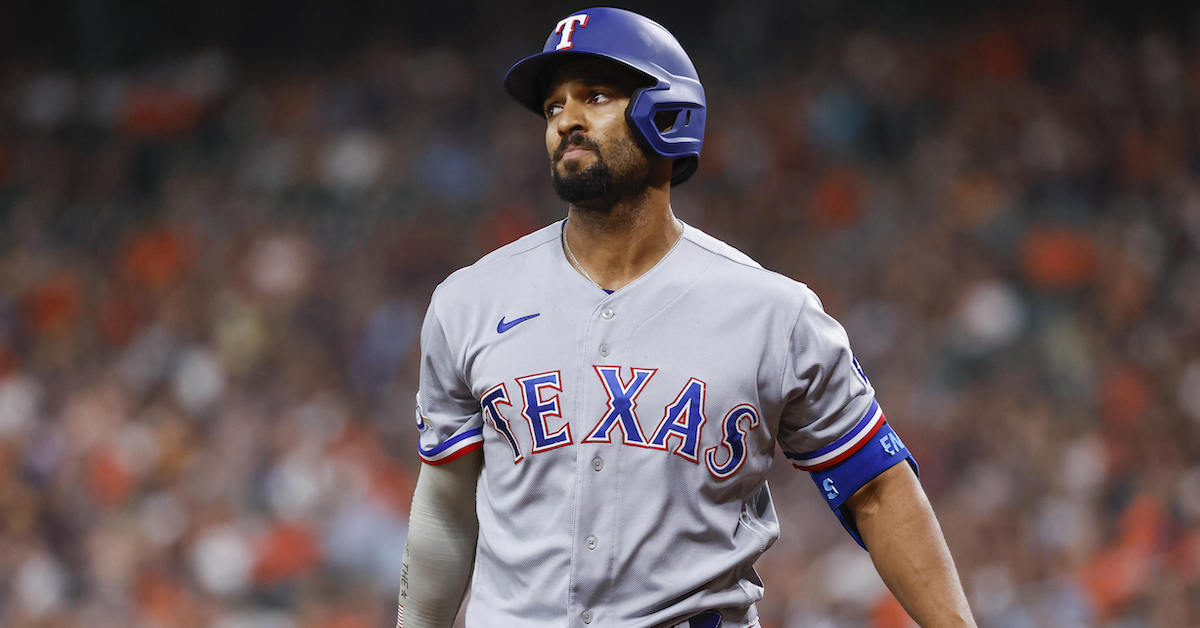
An old friend returned to the big leagues yesterday in a relatively unexpected place. After 11 seasons in the majors, all with the Cardinals, Matt Carpenter found himself searching for a new team this winter; in the end, he only managed to snag a minor league deal with the Rangers. Now, though, he’s found himself in New York with the Yankees, signing a major league deal with them that was announced on Thursday and hitting eighth in the starting lineup for their game against the Rays that same day. Does Carpenter have a second wind, or has too much time passed since he was an effective contributor?
That Carpenter found little interest in his services this winter was hardly surprising. Some players age gracefully, but he fell off a cliff after the 2018 season, dropping from a wRC+ of 140 to 96. If that had been the extent of his collapse, he’d still have a role in the majors; he still managed to collect 1.7 WAR in 492 plate appearances in 2019, thanks to not being awful at second or third base. But after hitting .176/.313/.291 combined over 2020 and ’21, even that saving grace didn’t provide quite enough grace. What rope remained after the COVID-shortened 2020 rapidly ran out of slack the following year, and his role was reduced to the extent that only 11 of his 53 games after the All-Star break were as a starter.
It strikes me as likely that Carpenter only survived on the roster because of his long history with the franchise; infielders who can’t hit are a dime a dozen, and he didn’t have an exploitable platoon split advantage the way a steeply declining Albert Pujols did. And while much has been made of Carpenter’s struggles against the shift, and while he’s been worse throughout his career relative to a traditional infield configuration, it’s not sufficient to explain the collapse. He hit just fine overall as the approach against him shifted (no pun intended) yearly toward all-shift after 2015; by the time 2018 rolled around, when he was still a dangerous offensive player, he was almost exclusively hitting against a stacked right side of the infield. Read the rest of this entry »
Shane Bieber has been one of the best pitchers in baseball in recent years. From 2019-21, he used pristine command and nasty breaking balls to rack up elite levels of strikeouts while posting an ERA- of 64 (tied for second-best in baseball over that span); he even won the AL Cy Young Award in 2020. That elite level of performance lasted until a 2021 shoulder strain cost him over three months of the season; he returned just in time to make a couple of late September starts before officially shutting it down. Coming into the 2022 campaign, Bieber said he was “100%.” Yet through his first eight starts of the season, there are warning signs all over his underlying metrics:
Shane Bieber’s Struggles
Year
IP
K%
BB%
ERA-
FIP-
SwStr%
Barrel%
FA Velo
2019-2021
388.1
33.0%
6.0%
64
68
15.2%
7.8%
93.3
2022
45.2
24.1%
7.3%
95
83
13.2%
10.8%
91.2
Bieber has still been an effective pitcher. He has an above-average ERA and an even better FIP and SwStr%, but these numbers still represent a drop in performance. For a pitcher who is just shy of 27 years old, it’s certainly notable, but we might chalk it up to a wonky eight-start rough patch were it not for the dip in velocity and the injury last season. But Bieber has lost three ticks on his heater from his Cy Young peak, when he averaged 94.3 mph. I wonder if we might be seeing the lingering effects of his shoulder injury. Just prior to the injury, Bieber’s velocity dipped to 92 mph and during his late September cameo, it was down to 91.4 mph. Throughout the season’s early going, Bieber has been asked repeatedly about his velocity dip and insisted that he feels fine and expects his velo to trend up as the season goes on. As we reach the end of May, however, no such increase has occurred:
Regardless of the cause, it isn’t a good development. And beyond just the lost velocity, there are some interesting mechanical changes that are worth taking a closer look at. We’ll start with an establishing shot of Bieber’s mechanics in 2020 and then this season. You may be able to pick up on some changes, like how this year’s windup is quite a bit faster:
Next we’ll look at his arm path. The following clip is synced to when his front foot lands, giving us a better look at his hand position at that pivotal point in a delivery. To me, it looks like his entire upper body is more closed off, giving Bieber a more circuitous hand path from his glove separation all the way through to the release of the ball. The result is an arm that needs to play catch-up as his foot lands:
These mechanical changes could mean a number of things. It’s possible this is an intentional change to try and add velocity, or to mitigate a recurrence of his shoulder issue. Or these could be subconscious changes as Bieber’s body tries to find a pain-free path to delivering a pitch. If you want to assume that this change is part of the loss in velocity and that it’s helping him stay healthy, then it could be a worthwhile tradeoff. However, if this is a less intentional tweak and it’s the result of his body subconsciously favoring his shoulder, it could lead to added stress on other areas that are currently healthy.
Given that we’re about a quarter of the way into the season, we have a pretty good sample by which to gauge how Bieber is trying to pitch through his velocity decline. It might seem like the obvious solution to a diminished fastball would be for Bieber to lean in to his two good breaking balls. Look no further than the success of Clayton Kershaw in recent years for a blueprint to mimic. Kershaw has evolved from throwing 94 mph fastballs 60% of the time to throwing a 91 mph fastball only 36% of the time. He is now a slider-first pitcher and it has allowed him to have a tremendously successful decline phase – if you can even call his 72 ERA- over the last five seasons a decline. A Kershaw-like evolution from Bieber may not be so straightforward, however, as he’s never relied on his fastball nearly as much as Kershaw did and has always heavily featured his breaking stuff. In fact, it may come as a surprise to see that Bieber hasn’t decreased his fastball usage at all; at 38.3%, it’s pretty much right in line with his 2020 season:
Shane Bieber’s Pitch Mix
Year
Fastball
Slider
Curveball
2020
37.4%
11.6%
26.3%
2021
35.3%
25.3%
31.2%
2022
38.3%
40.9%
18.0%
Bieber’s continued use of his declining fastball has come at a cost. While his wOBA allowed on his fastball is only .364 so far this season, his xwOBA has risen somewhat ominously up to .435, compared to .320 last season and .290 in 2020. Instead of throwing fewer fastballs, Bieber has opted to change his breaking ball usage, throwing more sliders in lieu of his curveball. The problem is that his slider hasn’t been that effective for him this season (.300 wOBA, 18.8% SwStr%) after being one of the best sliders in baseball last year (.207 wOBA, 24.8 SwStr%). More than just its increased usage, the movement profile of the pitch has undergone a change as well:
Bieber is getting significantly less depth on his slider while gaining a small amount of horizontal movement. These changes come from him putting more back-spin on the pitch than in years past; previously, the spin he imparted on the ball was much closer to that of his curveball. As a result, his slider has more cutter-like qualities and he’s lost about 200 rpm from last year, leading to a pitch that is generating fewer whiffs and fewer swings outside the zone than at any other time in his career. If you look closely, you can see the subtle change in his fingers, which are pushing a bit more behind the ball, giving the pitch a touch more backspin than before:
These changes to his slider have given him a bigger movement and velocity difference between his slider and curveball, which is helping to diversify his arsenal after years of having a slider and curveball that were eerily similar. But it’s hard to say whether this is a good change, especially considering that it is now his most used pitch. His curveball, on the other hand, has been his best pitch (.201 wOBA, 16.8% SwStr%) and may be benefitting from these changes to his slider.
This new movement profile coupled with the mechanical changes highlighted earlier may be creating some issues when it comes to his typically great command of the pitch. Bieber is currently leaving double the number of sliders up in the zone compared to 2020. Check out his slider heat map and you’ll get a better sense of the frequency of his mistakes this season:
There’s been a lot of doom and gloom in this piece so far, and I would like to leave things on a more optimistic note. For that, I’ll mention Bieber’s most recent start against Detroit last Sunday afternoon. Things were a bit rocky in the beginning, with Miguel Cabrera ripping a hanging slider for an RBI double, but Bieber eventually settled in to what turned out to be a dominant performance. It was the best his slider has looked since before his injury. He found success with the pitch by consistently commanding it to the low-and-away corner, earning whiffs all afternoon — he generated 11 whiffs on 39 such pitches thrown (28.2% SwStr%) with an 84.9 mph average exit velocity. On the day, he notched a season-high 10 strikeouts over seven innings.
Of course, it’s only one start and it came against the Tigers and their league-trailing offense. Bieber’s fastball velocity didn’t tick up any, and even though his slider was great, none of the underlying metrics suggest it was all that different from what it has been in previous starts this season, still lacking the spin rate and vertical bite of years past. But that doesn’t have to mean that this start is an aberration. Bieber could be finding better ways to use his slider, and his command of the pitch could be improving as he gets more used to its new movement profile. Bieber really needs his breaking pitches to carry the weight if he’s going to remain successful with below average fastball velocity, and this outing serves as a proof of concept for how he can still dominate a lineup even if his Cy Young stuff stays firmly in the rear view mirror.
Last week, I wrote an article about the influence of batted ball spin. The takeaways were simple: For one, even though confounding variables like temperature and wind speed are hard to eliminate, it’s entirely plausible that batted ball spin alone can subtract crucial amounts of expected distance. Also, while hitters may display a penchant for certain types of spin, they seemed to have little control over it on a daily basis. Potential inaccuracies aside, these findings made sense; hitting a baseball is hard, and batted ball spin is just another piece of the puzzle.
After the article ran, I didn’t expect to revisit this topic anytime soon. But two things inspired me to start exploring again. First, a Twitter mutual was kind enough to provide me with Trackman data of college baseball games that include — you guessed it — batted ball spin axis, which opened up multiple avenues of research. Second, Dr. Alan Nathan, a physics professor at UIUC, summarized his own findings on batted ball spin in the comments. Armed with new data and knowledge, it was time to dive back in. Read the rest of this entry »
As you’re probably aware, Apple TV+ has stepped onto the baseball broadcasting scene this year, airing two games every Friday. They’re stylistically different from your average baseball broadcast, even at a glance. The colors look different, more muted to my eyes than the average broadcast. The score bugs are sleek, the fonts understated. The announcers are mostly new faces. And most interestingly, to me at least, the broadcast displays probabilities on nearly every pitch.
As a big old math nerd, I love probabilities. They appeal to something that feels almost elemental. Every time I watch a baseball game, I wonder how likely the next hitter up is to get a hit – or to reach base, or strike out, or drive in a run. It’s not so much that I want to know the future – probabilities can’t tell you that – but I would like to know whether the outcome I’m hoping for is an uphill battle or a near-certainty, and how the ongoing struggle of pitcher against hitter changes that.
The Apple TV+ broadcasts gets those probability numbers from nVenue, a tech startup that got its start in an NBC tech accelerator. According to an interview with CEO Kelly Pracht in SportTechie, the machine learning algorithm at the heart of nVenue’s product considers 120 inputs from the field of play in making each prediction.
Machine learning, if you weren’t aware, is a fancy way of saying “regressions.” It’s more than that, of course, but at its core, machine learning takes sample data and “learns” how to make predictions from that data. Those predictions can then be applied to new, out-of-sample events. Variations in initial conditions produce different predictions, which is why you can think of it as an advanced form of regression analysis; at its most basic, changes in some set of independent variables are used to predict a response variable (or variables). Read the rest of this entry »
Last week, I discussed some of the young, pre-free agency players who teams should be trying to sign to long-term contract extensions. I hadn’t been planning for there to be a part two, but you guys had so many additional players you wanted to talk about, and I can’t remember the last time I got more DMs about a piece than that one — well, about a piece for which everyone isn’t mad at me, at least!
So, let’s oil up and turn the crank on the ol’ ZiPS-o-Matic and get this projection mill hopping for seven more players.
Walker Buehler, Los Angeles Dodgers: Eight years, $204 million
Buehler is currently in the second and final year of an extension with the Dodgers that pays him $4 million a year. His next deal will be a tad more pricey. Clayton Kershaw is still around in Dodger blue, but his injury history and mild decline resulted in 2021 being the year that Buehler became The Man in the rotation, reducing Kershaw to the role of deuteragonist. And while Los Angeles still has a rocking rotation, the depth isn’t quite what it was in recent years, so there should be more than slight concern that the franchise’s most valuable pitcher is unsigned. With Buehler two years from free agency, the Dodgers aren’t likely to get any massive discounts, but this is the best time to sign him if you don’t want to pay him Gerrit Cole money later. The Dodgers don’t necessarily have to stop at this figure, either; what’s the fun of being wealthy if you don’t use that cash to pay for cool things?
There may be some concern in some places about the dropoff in Buehler’s strikeout rate, but while strikeout rate changes do tend to stick very quickly, they stick far more when the underlying stats support the drop-off than when they don’t. In this case, the contact rates and swinging-strike rates haven’t worsened at all, nor has his velocity fallen off a cliff, suggesting that it’s a blip rather than a plunge. You can make a similar argument for the Dodgers signing Julio Urías to an extension, likely for a significantly lesser haul, but given the workload Buehler has shown he can handle, he’d be my priority. Read the rest of this entry »
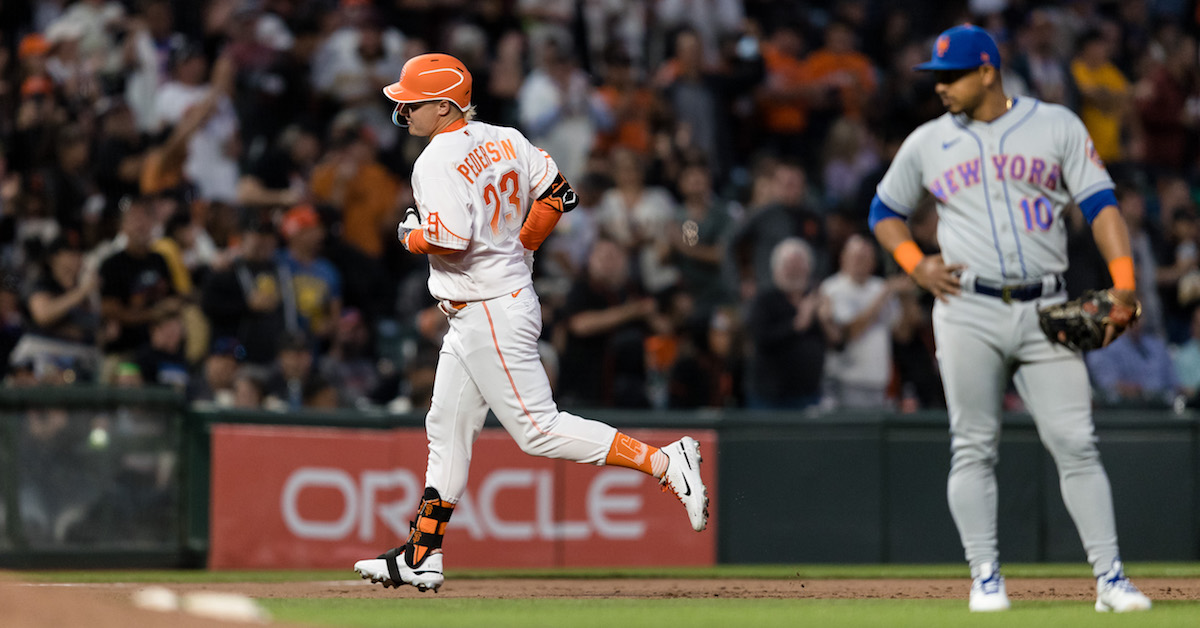
Whether or not you’ve seen it, you likely know the premise of Freaky Friday. A mother and her daughter switch bodies in a great cosmic mixup, and hijinks ensue. Hello! Welcome to FanGraphs. I’m Ben Clemens, and today we’ll be covering classic teen cinema of the early 2000s (and mid-1970s), as personified by last night’s Giants-Mets game.
Tuesday night could have been just another day at the (beautiful, well-appointed) office for the Mets and Giants. After a comfortable win by New York in Monday’s series opener, the Giants returned the favor early in last night’s game. Chris Bassitt, the steadiest starter in a rotation buffeted by injuries, had his worst start of the year, surrendering eight earned runs in only 4.1 innings thanks to three homers, two by Joc Pederson. Logan Webb, meanwhile, cruised through five innings (six strikeouts, one walk, two runs), turning what was billed as a pitching duel into an 8-2 rout.
Teams don’t come back from six-run deficits. When Pederson launched his second homer, a two-run shot that pushed the score to 8-2, the Giants’ win expectancy climbed to 98.2%. Tune into 50 games, and you might see the trailing team pull one out. The Mets behaved accordingly; they brought in Stephen Nogosek, the last reliever in their bullpen, to eat some innings.
That’s the way the game could have ended – but let’s get back to Freaky Friday. In 2021, the Giants won these games, whichever side of the 8-2 score they were on. They were both excellent and a team of destiny, and you have to win plenty of tough ones to end the regular season with 107 wins. Read the rest of this entry »
The Brewers are atop the NL Central thanks in large part to a rotation that has ranked among the game’s best, but the team’s postseason hopes took a hit this week with the news that righty Freddy Peralta will miss “a significant amount of time” due to a posterior shoulder strain. Milwaukee, which is additionally dealing with multiple injuries in its lineup, believes that Peralta will avoid surgery and return this season, but his loss is a disappointment given the 25-year-old’s recent return to form.
Peralta left Sunday’s start against the Nationals after three-plus innings due to tightness in his left shoulder. He failed to retire any of the three batters he faced in the fourth inning, and all three came around to score, the last two on reliever Brent Suter’s watch along with three others. The five runs that Peralta was charged with were as many as he had allowed over his previous five starts.
Indeed, Peralta had been on a roll. After starting the season by allowing nine runs in seven innings in his first two turns, he went on the aforementioned five-start run. In 28.2 innings, he struck out 38 (a 34.2% rate) and walked six (5.4%) without allowing a single homer, a run capped by his seven-inning, two-hit, 10-strikeout game against the Braves on May 16. Granted, the competition he faced during that strech wasn’t fierce, as the Phillies, Pirates, Reds (twice), and Braves are all below .500, and only Philadelphia has a team wRC+ higher than 94, but such is the schedule of an NL Central contender.
Peralta underwent an MRI on Monday, which revealed the strain. The Brewers expect the injury will heal with rest, but it will take some time. “He will be back this season but it’s going to be a lengthy absence,” manager Craig Counsell told reporters on Monday. “We’re confident that there’s gonna be no aftereffects to this thing but it’s going to take a while to heal and then build it back up.”
Through the ups and downs of his season so far, Peralta’s ERA is a gaudy 4.42, but among the 66 NL pitchers with at least 30 innings through Monday (the cutoff point for all stats here unless otherwise noted), his 2.10 FIP was the league’s lowest, his 0.23 homers per nine ranked third (teammate Adrian Houser was first at 0.21), his 1.3 WAR and 30.3% strikeout rate were sixth, his 22.4% strikeout-walk differential was seventh, and his 2.88 xERA was 14th.
Those peripherals are in line with the All-Star campaign he put up last season. After three years of careful workload management — a span during which he struck out 258 in 192.2 innings but never threw over 85 innings in a season — Peralta broke out with career highs of 27 starts and 144.1 innings in 2021. Among NL pitchers with at least 140 innings, his 2.81 ERA placed sixth and his 3.12 FIP was seventh. His 33.6% strikeout rate was third behind only teammate Corbin Burnes and Max Scherzer, and his 24.0% strikeout-walk differential was good for fourth behind that pair and Aaron Nola. Only a late-season bout of shoulder inflammation, for which Peralta spent 15 days on the injured list and had a few shortened starts on either side, put a damper on his strong campaign and prevented him from down-ballot consideration in the Cy Young voting. Read the rest of this entry »