Rooting for Team USA in international sports can be a little… touchy. America’s great rivals vary from sport to sport and come from every corner of the globe. Ours is a nation of vast influence and combative people, so adversaries pop up everywhere. (At one point, the U.S. women’s national soccer team had a vicious rivalry with Norway. Norway! You must really want a fight if you have beef with Norway.)
But our most intense rivalries were forged in the Cold War, when American politicians and media painted Communist nations as an unknowable other against whom we were pitted in a battle for survival. Before glasnost, the internet, and the professionalization of Olympic sports, teams from Communist countries were so mysterious they could only be feared. We did not see Soviet stars in the NBA or NHL as we do now, nor Cuban baseball players and boxers in western competition. We only encountered them as they appeared every four years to pit their mettle against that of American college athletes at the Olympics. That’s how the Miracle on Ice became such a definitive part of American mythology; rare is the scenario in which an American team — much less an American men’s team in a relatively popular sport — can credibly claim to have faced and overcome an insurmountable opponent. But what the Soviets were to hockey, Cuba was to baseball.
Hello, and welcome to an article where I’m wrong about everything. Like literally all of the things. Here’s what happened. I was thinking about the long, glorious farewell tour of Albert Pujols. After a five-year stretch during which he posted a wRC+ of 84, he put up a 151 wRC+ in 2022. That was the best he’d hit since his age-30 season. Pujols largely put up those numbers by smashing lefties. His 113 wRC+ against righties was good, but against lefties that number was 214. MVP Paul Goldschmidt was the only batter who performed better against lefties (minimum 130 plate appearances vs. southpaws).
Pujols’ resurgence really started in 2021, when he had a 145 wRC+ against lefties and a 35 against righties. That’s the season I was more interested in. As I thought about it, I started wondering whether the last part of his journey — established veteran defies the aging curve by settling comfortably into a platoon role — is happening more frequently. I had the sense that it was happening more frequently.
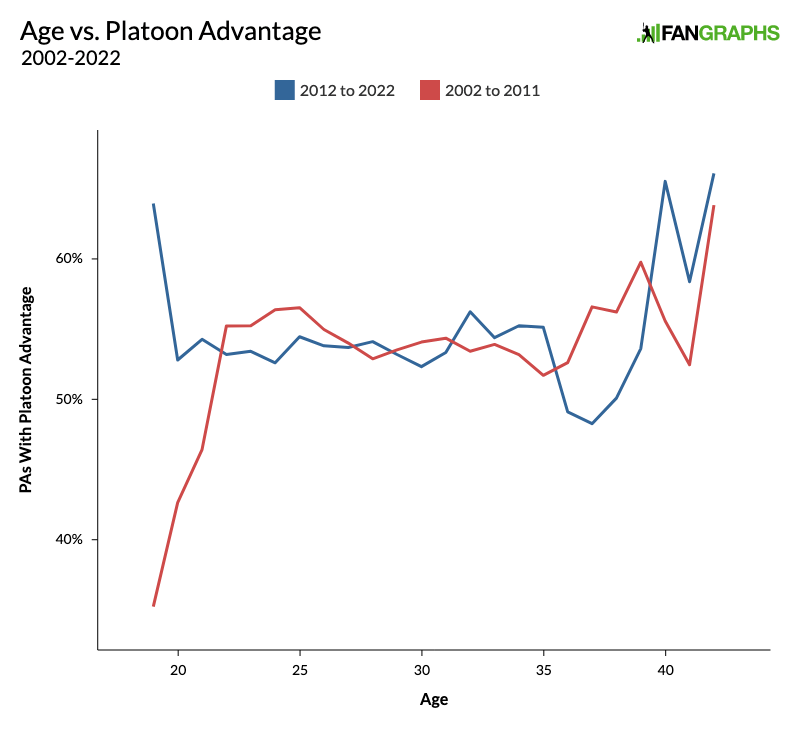
I was wrong. It is not happening more frequently. Here’s a graph comparing the last 11 years to the previous 10 years:
Chris Murphy is gaining helium. A sixth-round pick in the 2019 draft out of San Diego State University, the 24-year-old southpaw was No. 38 on our Red Sox Top Prospects list going into last season, with a modest 35+ FV. But on the heels of a 2022 campaign that saw him excel in 15 starts with Double-A Portland and then hold his own in 15 more with Triple-A Worcester, this year he will be moving up to the 14–16 range with a 40 FV, per our lead prospect analyst Eric Longenhagen. He also just participated in Boston’s Rookie Development Program, which focuses on easing the transition into MLB — an indication that Murphy could be in Boston as soon as this summer.
A self-proclaimed nerd who is well-versed in his vertical approach angle and pitch metrics, Murphy discussed his craft earlier this week at Fenway Park.
———
David Laurila: Let’s start with who are you as a pitcher. How do you get outs?
Chris Murphy: “That’s a good question. There have been times in my career where it’s very fastball heavy — come at you fastball/changeup primarily and then curveball/slider secondarily. I’ve generally been aggressive with the fastball up in the zone. I have good vertical break, good two-plane, and a pretty decent vertical approach angle. That’s why I get swings and misses up in the zone and why my changeup plays down in the zone. Using that to my advantage, being a shorter pitcher, is something that’s given me a career to this point. That and throwing from the left side.”
Laurila: How tall are you?
Murphy: “The book will say 6-[foot]-1, but I’m probably just under six feet. I weigh about 185, so I’m not the biggest guy.”
Laurila: You said that you get good vertical but also two-plane. Can you elaborate?
Murphy: “Yes, I get both ride and run. There are days where my fastball is more true and it’s just ride, but ride and run is ideally where I like it to be. And then with the changeup, it’s about killing the spin, killing the vert, and adding more horizontal. The goal this year is to be under six vertical and negative-18–19 horizontal.” Read the rest of this entry »
A few weeks ago, I regressed as a writer. I regressed a lot, actually: twenty years worth of slash line data regressed against twenty years of run scoring data in various ways. But — and this is a dangerous sentence, and usually a bad one — someone asked me a question on Twitter and I want to answer it. Namely: was batting average always the weakest correlation to run scoring among the slash line statistics, or has it only become so recently?
This is going to be a quick hitter. I broke the game down somewhat arbitrarily, using eras defined by OOTP Perfect Team. I started in 1947 and went up until 2000 (the results of the 2000s were in my previous article). Here’s what those 2000s results look like, which should both give you an idea of the correlations today and preview the format for the rest of the article:
R-Squared to Runs Scored, Various Stat Pairs
Statistic
AVG
OBP
SLG
AVG
.355
.673
.841
OBP
.673
.668
.885
SLG
.841
.885
.840
Without further ado, let’s get started.
Golden Years, 1947–1960
Now, these weren’t the golden years for me, because I wasn’t alive, but I guess that’s what some people call this era of baseball. Jackie Robinson! Ted Williams! Stan Musial! Willie Mays! Batting average mattered more, but it still didn’t matter:
R-Squared to Runs Scored, Golden Years
Statistic
AVG
OBP
SLG
AVG
.655
.762
.771
OBP
.762
.707
.908
SLG
.771
.908
.688
What do I mean by that? Well, if you predict run scoring with OBP and SLG, you get a 0.908 adjusted r-squared to actual runs scored. Predict run scoring with the entire triple slash line, and you get an adjusted r-squred of 0.91. Batting average did better, on its own, as a run scoring predictor, but using OBP and SLG was the gold standard in the golden years.
Baseball Boom, 1961–1979
This is a broad era that folds in some pitching-dominant years that led to rules changes, the early part of the speed era, and some early-60s home run mania. It’s also an era where, if you know OBP and SLG, you don’t need to know batting average to predict run scoring:
R-Squared to Runs Scored, Boom Years
Statistic
AVG
OBP
SLG
AVG
.672
.810
.856
OBP
.810
.795
.922
SLG
.856
.922
.833
Like the 1947–60 span, using OBP and SLG as predictors does just as well as using all three statistics. More specifically, OBP/SLG had a 0.922 adjusted r-squared to runs scored. The full AVG/OBP/SLG regression checks in at 0.923. Average… if you’re already 99.89% of the there, it’ll get you that last tiny bit of explanatory power. That’s not exactly a ringing endorsement.
Defensive Era, 1980–1992
Even though I wasn’t alive for a big chunk of this era and wasn’t following baseball for the vast majority of it, it’s one of my favorite eras, thanks to Ozzie Smith, my single favorite baseball player and, per my mom, the person I’ve most emulated in my life. I spent countless hours mimicking the defensive plays I saw on my “Ozzie, That’s a Winner” VHS tape, which my uncle had recorded on local access TV in St. Louis. I’m a lefty, so I was doing them backwards and they never led to me becoming a defensive wunderkind, but none of that mattered to me; I just wanted to be like Ozzie. Uh, where were we? Oh, right. Average didn’t matter:
R-Squared to Runs Scored, Defensive Era
Statistic
AVG
OBP
SLG
AVG
.542
.713
.800
OBP
.713
.705
.863
SLG
.800
.863
.784
Using the criteria from above, OBP/SLG checks in at 0.863, and an all-three-slash-stats regression checks in at 0.864. It’s interesting to note that OBP and SLG explain the lowest percentage of variation in run scoring in this era, which I attribute to the huge range in team baserunning strategy and effectiveness, but that’s not the point of this study. The point is that if you already know a team’s OBP and SLG, you don’t need to know their batting average to predict how many runs they scored.
The Power Years, 1993–2000
I cut this one off at 2000, since my previous article already covered the 21st century, but OOTP extends it to 2004. Regardless, you guessed it:
R-Squared to Runs Scored, Power Years
Statistic
AVG
OBP
SLG
AVG
.655
.830
.839
OBP
.830
.821
.912
SLG
.839
.912
.811
This time, the adjusted r-squared is the same whether you look at OBP/SLG or AVG/OBP/SLG. So there you have it: throughout the eras, the correlations have remained the same. If you’re trying to predict a team’s run scoring and already have their on-base percentage and slugging percentage, you can stop there. Batting average won’t add anything to the equation.
If I asked you to visualize the prototypical stolen base, you’d probably picture a runner taking off for second. Conversely, if I asked you to conjure up the most thrilling stolen base you could imagine, you’d pick a play at the plate. Stolen bases at third, then, are the neglected middle child — too infrequent to warrant much conversation or analysis, but not unusual enough to drum up excitement. But third is more than just the base between second and home, and stealing third regularly and efficiently is a distinct skill.
For one thing, steals of third base make for a faster showdown between catcher and runner. The average pop time on a throw to second last season was 1.97 seconds; on a throw to third, it was 1.55 seconds — nearly half a second quicker. The distance between bases, however, is the same all around the diamond, which means a runner needs a much better jump when he’s going for third. Thus, stealing third is less of a race and more of a mind game. Pure speed is less important, but the perfect lead and a well-timed jump are invaluable. Read the rest of this entry »
The Rays front office has more than earned the benefit of the doubt in terms of talent evaluation, particularly when it comes to pitching. At this point, they have a long history of player development and evaluation success, from homegrown prospects to reclamation projects to the trade market. With that reputation preceding them, Wednesday’s agreement with reliever-turned-starter Jeffrey Springs to a four-year, $31 million contract extension feels more like an assertion of his future than a bet on it.
Still, to negotiate an extension with a 30-year-old player who had yet to reach 50 innings in a major league season entering 2022, the Rays have to feel pretty good that his season was a sign of more good things to come. The agreement has some uncertainty built in; while the Rays guaranteed him $31 million over four years, it includes a $15 million club option for a fifth year and a series of incentives tied to innings and Cy Young Award voting placement that could more than double the deal’s total value by the end of its course. For the Rays, it’s a relatively modest investment on the low end; on the other end, having to dole out the full $65.75 million would in all likelihood be a good problem to have. For Springs, it’s nothing short of hard to believe. Read the rest of this entry »
The one constant this offseason is that Bryan Reynolds is probably going to get traded. We all knew this, because he’s a good player on a bad team that doesn’t look like it’s going anywhere anytime soon. Players like that get traded, or at least they get talked about as trade candidates. In December, Reynolds turned circumstantial evidence into an actual news story by requesting a trade.
A month and a half later, there’s still no movement, which isn’t really a surprise. Reynolds is under team control through 2025, and the Pirates — if they decide to move on from Reynolds at all — shouldn’t be in any rush to get rid of their best player. A couple weeks ago, Jon Heyman cited a rival executive who compared Pittsburgh’s ask for Reynolds to what the Padres gave up for Juan Soto last August.
If you’ve been around baseball, followed it, watched it, or even become generally aware that there’s a sport behind cultural idioms like “ballpark figure” and “getting to second base,” you know how this dance goes. Player requests a trade, team negotiates with rivals both privately and through leaks to reporters, a price is eventually agreed upon, and the trade is executed.
But I find this process particularly intriguing for Reynolds, because it involves determining a public consensus over how good he actually is. Read the rest of this entry »
Earlier this week, I wrote up a side project I’ve been working on recently: looking through exit velocity distributions to find interesting hitters. You can read that if you’d like (obviously, that’s how the internet works), but as a refresher, I looked through 2022 batted ball data for hitters whose 95th-percentile exit velocity was high but whose average exit velocity was low, as well as hitters who hit the ball hard consistently but didn’t have the results to show for it.
With a little more time to monkey around with the data, I’ve come to a few conclusions about this line of analysis. If you just want to read the article for those conclusions, no sweat: just search for the words “phenomenal cosmic power.” It’s been too long since I’ve used an Aladdin reference in an article, so I promise to shoehorn that one in somehow just before I explain my conclusions.
Okay, great, now that we’ve dispensed with the casuals, let’s talk through a bunch of procedure. You nerds (I say this with affection) love the procedure, I know. First things first: I took Baseball Savant data for all batted balls and grouped them by player and season. I skipped 2020 due to sample size issues and last season because we don’t have subsequent-year data. That left me with approximately 3,000 player-seasons of at least 50 batted balls. Read the rest of this entry »
Zack Gelof doesn’t profile as a boom-or-bust prospect. Coming off of a season that saw him reach Triple-A at age 22, the University of Virginia product is a near lock to perform on the big stage — not as a headliner, but rather as a solid contributor to a lineup that is currently patched together with Band-Aids. The low-budget Oakland Athletics need all the help they can get, so getting Gelof — ditto the higher-ceilinged Tyler Soderstrom — to the big leagues is an organizational priority.
Drafted 60th overall in 2021, Gelof slashed .270/.352/.463 with 18 home runs this past season, with the bulk of his action coming with Double-A Midland. The right-handed-hitting infielder added three more homers in the Arizona Fall League, and it is his power potential that most stands out for our lead prospect analyst. When I asked Eric Longenhagen for a snapshot scouting report on Gelof, he told me that “it is definitely a power-over-hit profile at this point,” adding that while his 70% contact rate wasn’t great, his “peak power and barrel rates were very encouraging.”
When I asked Gelof for a self-scouting report, he chose not to cite specific strengths, but rather his all-around skillset and desire to get better.
“I’d say I’m a really athletic infielder who likes to compete,” the Delaware native told me during his stint in the AFL. “But I try not to think about who I am and what people scout me to be. I just worry about working on basically every area that I can. I want to perform on the field and be the best player that I can be.” Read the rest of this entry »
Last week, what felt like months of Pablo López trade rumors finally came to fruition, as he was sent to Minnesota (along with two prospects) for reigning batting champion Luis Arraez. (For an in-depth breakdown of the trade, check out Ben Clemens’ summary here.) In theory, the trade should help both rosters: the Twins needed pitching depth, and the Marlins needed offensive help. For this piece, I’m going to focus on how López can recover the best version of himself that we saw in 2021 before he missed much of that season’s second half.
López established himself as an above-average starting pitcher in the shortened 2020 season, when he threw 57.1 innings with a 3.61 ERA and 3.09 FIP. The main reason for his success: he bought into the idea of throwing your best pitches more often, throwing his four-seamer and changeup over 60% of the time for the first time in his career. That success carried over into 2021, when he threw 102.2 innings with a 3.07 ERA and 3.29 FIP, followed by a hot start to 2022. But from the middle of June through the rest of the season, he kept tossing up clunkers.
López Performance by Month
Month
FIP
K%
BB%
Ch Whiff%
April
1.66
27.10
4.70
46.9
May
3.73
26.20
7.60
40.3
June
4.65
22.00
7.30
37.6
July
3.92
24.00
8.50
30.9
August
4.43
19.70
8.50
31.1
September
3.55
23.40
5.80
20.0
The short story is that hitters stopped whiffing at López’s changeup. He had a slight recovery in the final month, but as you can see in that pitch’s whiff rate and his strikeout rate, that wasn’t him at his best. His repertoire hinges on both righties and lefties swinging at and whiffing on changeups. It’s the key to his success, and it will need to be the focus if he hopes to return to his 2021 form.
So why did hitters swing and miss less at López’s changeup as the season went on, and is it directly related to the pitch itself?
To answer that, it’s worth considering first what a changeup is: a deception. And in order to deceive, you have to make the hitter believe something else is coming. To do that, you must throw your complimentary pitch regularly and in an ideal location. In the case of the changeup, you usually pair it with a four-seamer or sinker; for López, it’s the four-seamer. The success of those pitches goes hand in hand; if one is off, then the performance of the other could be in jeopardy. To go into more detail: if the shape of one changes and no longer tunnels as well with the other, then the combination isn’t as deceptive.
That seems to have been the case with López. Below is a table of his four-seamer/changeup metrics from the last few seasons:
López 4-Seamer/Changeup Specs
Year
Pitch
Active%
Measured Axis
Inferred Axis
2020
4-seamer
80.5
1:25
12:56
2020
Changeup
85.5
1:59
2:48
2021
4-seamer
80.2
1:32
12:58
2021
Changeup
90.5
2:08
2:50
2022
4-seamer
66.2
1:19
12:31
2022
Changeup
83.7
2:02
2:50
SOURCE: Alex Chamberlain’s Pitch Leaderboard
The difference is jarring. López didn’t have pure backspin on his four-seamer to begin with, but a change in shape from the low-80s in Active% (also known as spin efficiency) to 66.2% completely alters a pitch’s shape and, as a result, its effectiveness. Even though his changeup metrics were relatively the same from 2021, the change in the fastball negatively impacted the entire arsenal. If a hitter can distinguish between those two pitches because of shape and/or location, they are less likely to be fooled by either one.
This negative development for López can be traced directly to an injury suffered when he took a liner right off the right wrist on June 10. After that, his performance was sporadic, and more importantly, his release point and pitch location changed:
López 4-Seamer Release and Location
Month
Avg. Horizontal Release
Avg. Vertical Release
Avg. Horizontal Location
April
-2.14
5.5
0.02
May
-2.09
5.5
0.05
June
-2.06
5.48
-0.05
July
-2.13
5.34
-0.01
August
-2.15
5.37
0.02
September
-2.09
5.48
0.17
During his rough patch in July and August, his release point moved down and closer to third base. This slight change perfectly tracks with a loss in active spin. By getting further around the ball, your finger and seam orientation at release are less on top of the ball and more on the side. To get more backspin, you ideally release the ball closer to the top of your fingertips. A change in grip strength that could be the result of a wrist contusion would have a direct impact on these components and cause compensations that take time to realize and adjust to. And while López felt healthy enough to throw 180 innings last year, that doesn’t mean he wasn’t compensating.
When combing through the video, it’s easier to see the change in release. Below are four total clips; the first two are from April, and the two after are from July and August.
There are a few things I want to address. First, López’s altered release point can be traced back in his delivery to a slight change in the use of his glove side. Comparing his throws in the spring to those in the summer, you can see that he’s altered the way he turns his glove over at peak lead arm extension. Early in the year, he only had a slight quarter turn in his glove; in the second half, he progressed into a full turnover.
That subtle difference creates two different reciprocal movements. A reciprocal movement is one that is a direct result of another; if you throw a ball up, it must come down. The same principle works for the body. A change in direction of the glove turn affects the direction of torso rotation, which then affects the angle or position of the throwing arm at release. (The kinetic chain!) That’s an area where he and his coaches can look at when discussing how he can make the proper mechanical adjustments to recover his fastball shape.
It’s important, too, to note how important that recovery will be for López’s tertiary pitches as well. When you lose one of your primaries, hitters can more easily sit on the pitches that aren’t as effective in the arsenal. For López, that pitch was his cutter. After two seasons with a wOBA under .325, the pitch was wrecked in 2022: a .447 wOBA and .321 batting average against. Its downfall can also be traced to his four-seamer, as the pitch went from the mid-50s in spin efficiency to the mid-30s. He may only throw it 10% of the time, but it was still a huge liability. Hopefully whatever mechanical adjustments López makes to recover his four-seamer can filter down to that pitch as well.
Injuries in general can be tough to overcome in the middle of a season. For a pitcher, that difficulty increases with anything related to their arm. A contusion may not be a long-term health concern, but López’s second half shows how something that looks insignificant can lead to detrimental short-term compensations. Luckily for him, this is the type of thing that shouldn’t take any drastic adjustments to fix, and he already has a blueprint for success from his 2020 and ’21 campaigns. With the help of a new coaching staff in 2023, his two-pitch combo should give him and the Twins an above-average starter for the next couple of seasons.