Oakland’s Prospect Snowball Grows with Matt Olson Trade
Today, the Oakland Athletics traded star first baseman Matt Olson to the defending champion Atlanta Braves (analysis of the Braves’ side of the deal, courtesy of Dan Szymborski, can be found here) for a sizable package of prospects, including two from baseball’s Top 100. Coming back to Oakland is catcher Shea Langeliers, center fielder Cristian Pache, power-armed relief prospect Ryan Cusick, and polished teenage righty Joey Estes. All four new A’s prospects have been added to the team’s prospect list, both in the article and over on The Board.
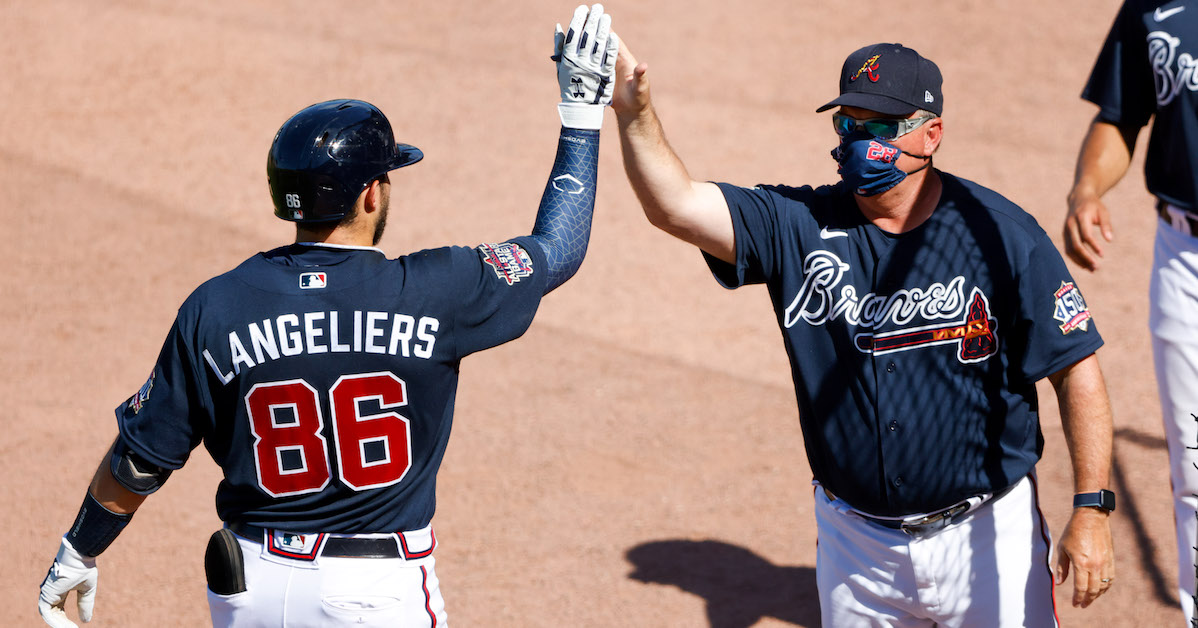
In our opinion, the best of that group is 24-year-old Shea Langeliers. Ranking 70th overall and eighth among the catching prospects on our recently published Top 100, Langeliers combines plus or better defense with a power-over-hit game when he’s at the plate as opposed to behind it. His raw power blossomed into game power during the 2021 season, and while Langeliers isn’t an especially instinctual hitter (he projects as a sub-50 bat with contact issues), he has the potential to deliver 20-plus home runs per year. He has Gold Glove potential, with great hands and mobility to go with a strong, accurate arm that shuts down the running game. He also earns raves for his catching intangibles in terms of managing the game and working with pitchers. Theoretically, he’s lined up to start the year at Triple-A, be added to the 40-man after the season, and debut in 2023. His future in Oakland is tied closely and directly to that of incumbent star Sean Murphy, who reaches his first year of arbitration in 2023. We think Langeliers’ presence makes it more likely that Murphy is traded in the next 18 months.