Archive for Featured Photo

Long Gone Summer Refuses to Bury McGwire, Sosa, and the 1998 Home Run Race

In 2001, HBO Films aired a made-for-television movie called 61*, about the 1961 race between Yankees sluggers Mickey Mantle and Roger Maris as they attempted to topple the hallowed single-season home run record held by Babe Ruth. The movie opened with footage of Mark McGwire hitting his 60th home run in 1998, as actors playing Maris’ sons paged through a scrapbook their mother kept of their late father’s accomplishments. Soon enough, the movie delved into a dramatization of the 1961 race, with a script that reflected upon the question offered by 61*’s tagline: “Why did America have room in its heart for only one hero?”

Nineteen years later, Long Gone Summer, an ESPN 30 for 30 documentary that premiered on Sunday night, looks back at that 1998 race between McGwire and Sammy Sosa, and the brief stretch when the baseball world carried the two rival sluggers in its collective heart as the pair challenged a record that had stood for nearly four decades. While subsequent allegations about both players’ use of performance-enhancing drugs have dulled the luster of their achievements and astronomical home run totals — 70 for McGwire, 66 for Sosa — director A.J. Schnack’s movie is far less interested in scolding anyone than it is in reliving the excitement of the race and the mutual respect and camaraderie of the two rivals. That’s not to say that the topic of PED usage goes unaddressed, but it does take a back seat to what was, at the time, a feel-good story in a sport that was still recovering from the impact of the 1994 season-ending players’ strike.

I was one of more than three dozen people interviewed for Long Gone Summer, nearly all of whom were otherwise connected to the race as players, coaches, managers, executives, club employees, family members, broadcasters, or print media; to my eye, Effectively Wild’s Ben Lindbergh and MLB.com’s Jennifer Langosch were the only other participants besides myself who were outsiders at the time. It was a unique opportunity, and while my time onscreen was limited, I’m glad that the final product — which I only viewed for the first time late last week — turned out well while taking a lighter tack than we’ve seen over the past two decades. It’s not hard to find people, inside baseball or beyond, willing to rebuke McGwire, Sosa, and MLB itself for the game’s drug problem, as the annual Hall of Fame voting reminds us. Schnack, a native of Edwardsville, Illinois — about half an hour from St. Louis — and an award-winning documentarian whose previous credits include films covering They Might Be Giants and Kurt Cobain, chose a different route. In doing so, he secured the cooperation of both McGwire and Sosa, both of whom offer a generous share of recollections and introspection regarding that season 22 years ago.

Read the rest of this entry »


A Look at the Gains and Losses by Team of a Season Without Fans

On the heels of another weak offer by team owners, it’s worth re-examining their claims of losses on a per game basis in the regular season. While most of the discussions about MLB’s gains and losses in 2020 have been on a more global scale, individual teams are going to have vastly different financial outlooks this season. Those outlooks could be shaping the negotiations among the owners as they continue to present proposals to the players that try to satisfy all the owners at once.

It’s possible you’ve heard the claim that owners will lose $640,000 on every regular season game played. While there are a lot of issues with that claim given that national television money as well as other revenue from MLB’s central office like MLB.TV is not included, we can use the data from that assertion as a starting point in examining MLB’s finances. MLB’s claim of losses comes from taking a pro-rated share of local television money and then subtracting player pay based on the March agreement that dictated pro-rated pay. Then, around $55,000 is added per game for other revenue minus the cost to put on a game. For the television estimates, I used the data from this piece, added the MLB average for Toronto, and then made a 2% adjustment based on the figures in this Jeff Passan piece. That same piece also provided the salary rate of $1,674,800 per game. Based solely on that data, here’s the team-by-team look at gains and losses per game:

Read the rest of this entry »


Beyond Round 5: The Best Later-Round Draftees, Part 2

Picking up where I left off from Part 1, this is my round-by-round look at the best players drafted in each round beyond the fifth since the amateur draft was instituted in 1965. It’s an exercise intended to highlight the numerous quality major league players who might slip through the cracks with a shorter draft, not only this year’s absurdly curtailed five-rounder but also future years, particularly with minor league contraction looming.

With the database help of Ben Clemens, we’ve assembled top-five WAR rankings for rounds six through 25, plus a top-10 ranking for those chosen in later rounds. I’ve attempted to summarize the career highlights of each player in concise fashion (hat-tip to Baseball America’s Ultimate Draft Book for some of the tidbits on why draftees slipped to later rounds). Additionally, I’ve highlighted one active player who may or may not have cracked the leaderboard yet, but who’s also noteworthy. Read the rest of this entry »


Peering Back at the 2019 Season Through a 50-Game Window

It stands as a threat rather than an official proposal — heaven forbid the owners actually engage the players directly instead of attempting to negotiate through the media — but MLB’s latest thought balloon regarding a 2020 season centers around a 50-game schedule. In the wake of the players’ formal proposal that they receive the full prorated share of their salaries for a 114-game season that would begin on June 30 and end on October 31 (with a postseason to follow in November), the owners have let it be known that they’re not enthusiastic about that idea. Per ESPN, The Athletic, and other outlets, they’ve discussed a 50-game slate as a last-resort option.

The wee season would begin in July, and for it, the players would receive the full prorated share of their salaries, though those would amount to just 30.8% of their full-season salaries. Here it’s worth noting that the 50-game schedule is the same distance from the central 82-game proposal as the 114-game one is; if the two sides were to meet exactly in the middle, we’d be back at the number that’s been floating around since the owners voted to propose a 50-50 revenue split on May 11.

As Dan Szymborski illustrated in his latest round of ZiPS projections, a lot of strange stuff can happen in just 50 games, including a 28.1% chance of the Dodgers — projected as the best team in baseball over a full 162 games back in March — missing the playoffs and a 0.6% chance of the Marlins winning the World Series. “At 50 games, the ability to meaningfully differentiate between the great and the good, the mediocre and the bad, starts to fade significantly,” wrote Szymborski. “There’s a one-in-five chance that the winner of the World Series will be a team believed to be .500 or worse.” Read the rest of this entry »


Chi Sung Pil: A Trailblazer in Korean Baseball

Chi Sung Pil was born in Korea around 1900. His mother, Sun Sin So Kim, was a longstanding Presbyterian missionary. Sometime around 1909, Kim’s husband died. Thanks to the efforts of Christian missionaries in Honolulu, who assisted Korean Christian widows and divorcees in relocating to the United States, Kim moved to Hawai’i shortly thereafter, bringing young Chi Sung with her. Kim continued her missionary work with the other devout Korean immigrants she met, and soon remarried within the thriving community, having two more children.

In Roberta Chang and Wayne Patterson’s The Koreans in Hawai’i: A Pictorial History, 1903-2003, a photo from 1920 shows Kim and the family she built in Hawai’i. The photo is taken against an elegant forested backdrop, and both parents and children are dressed to the nines: mother and daughter in light dresses, father and son in suits — the son, Harry Kim, sporting a jaunty polka-dot button-up and bow-tie. Chi Sung, who would then have been around 20, is not pictured.

Only a few years later, Chi Sung’s photograph would be featured in newspapers across the country. There is one in particular that kept cropping up: an action shot, with Chi Sung’s left arm raised high behind his head, his right arm extended outward and down — the classic, instantly recognizable pose of the submariner. In the Los Angeles Times on April 5, 1923, this photo appeared alongside other images of other people making world news that day — Haran Elkuta, leading a revolution in Albania; a group of Hawai’ian legislators; the U.S.S Pennsylvania at sea.

The caption box beside Chi Sung’s picture reads: “Only Korean ball player is demon pitcher! Chi Sung Pil, now attending the University of Oregon, plans to organize a team of Koreans to tour the Orient.” Read the rest of this entry »


Roberto Ramos’ Youth and Power Stand out in the KBO

While the NC Dinos bolted from the gate by winning 17 of their first 20 games — the best start in the history of the Korea Baseball Organization — the LG Twins have been the league’s hottest team of late. After starting the season 2-4, the Twins have won 14 of 18; through Tuesday, they stood just two games behind the Dinos (18-6). This run has been largely powered by first baseman Roberto Ramos 라모스, who recently homered four times in five games, and leads the league with 10 dingers overall.

Ramos, a 25-year-old lefty swinger who spent 2014-19 in the Rockies chain, began his latest jag with a walk-off grand slam against the KT Wiz’s Min Kim 김민 김민 on May 24, turning a 7-5 deficit into a 9-7 win :

Two days later, in a 3-0 shutout win over the Hanhwa Eagles, he put the Twins on the board first with a solo shot off reliever Yi-hwan Kim 김이환:

https://twitter.com/AlexMicheletti/status/1265315036630827009

Read the rest of this entry »


MLB’s Latest Proposal Caters to Its Richest Teams

Much of the focus regarding baseball’s potential return has centered on whether the players and owners can come to a financial agreement both parties feel works for them. The two groups may negotiate as cohesive units, but they are comprised of distinct individuals and entities that often have diverging interests. The league’s proposal appears to have been an attempt to drive a wedge between the highest earners in the sport and those making closer to MLB’s league minimum. And while Rob Manfred needs to find a solution that players will agree to, before he can even make such an offer, his proposal has to fly with his 30 bosses, the MLB owners. Those owners don’t always have the same goals or ideas about how the business of baseball should be run – the league’s latest proposal reflects those differences, as big-market teams received the biggest benefit.

A few weeks ago, Ken Rosenthal and Evan Drellich reported in The Athletic that baseball’s traditional revenue sharing was at risk in 2020. Local television money is big for teams in this era, and the gap between the top 10 teams in television revenue and the bottom 10 is, on average, $67 million even before accounting for network ownership. Attendance and stadium-related revenue tends to further exacerbate that gap. Revenue sharing, where each team pools together 48% of local revenue and divide it equally, shrinks the gap some, but still provides the big-market, high-revenue teams a significant advantage. With most stadium-related revenue potentially gone, the divide gets a bit skinnier. From the Drellich and Rosenthal piece:

“The discrepancy between the Rays and the Red Sox this year is not that dramatic,” the executive said. “It’s still money. It’s tens of millions of dollars. But it’s not hundreds of millions of dollars. And if you’re going to share that, it’s not going to move the needle enough this year.”

MLB’s presentation to the players regarding team losses had some fairly significant holes, but it did show the traditional big moneymakers like the Yankees and Dodgers suffering the biggest losses. Lost stadium revenue drives some of that, but high payrolls contribute as well. Those high payrolls are normally easily justified by massive revenues, but if team revenues were the same, the higher payroll clubs would be more likely to lose money. MLB’s latest proposal attempted to do those clubs a huge favor.

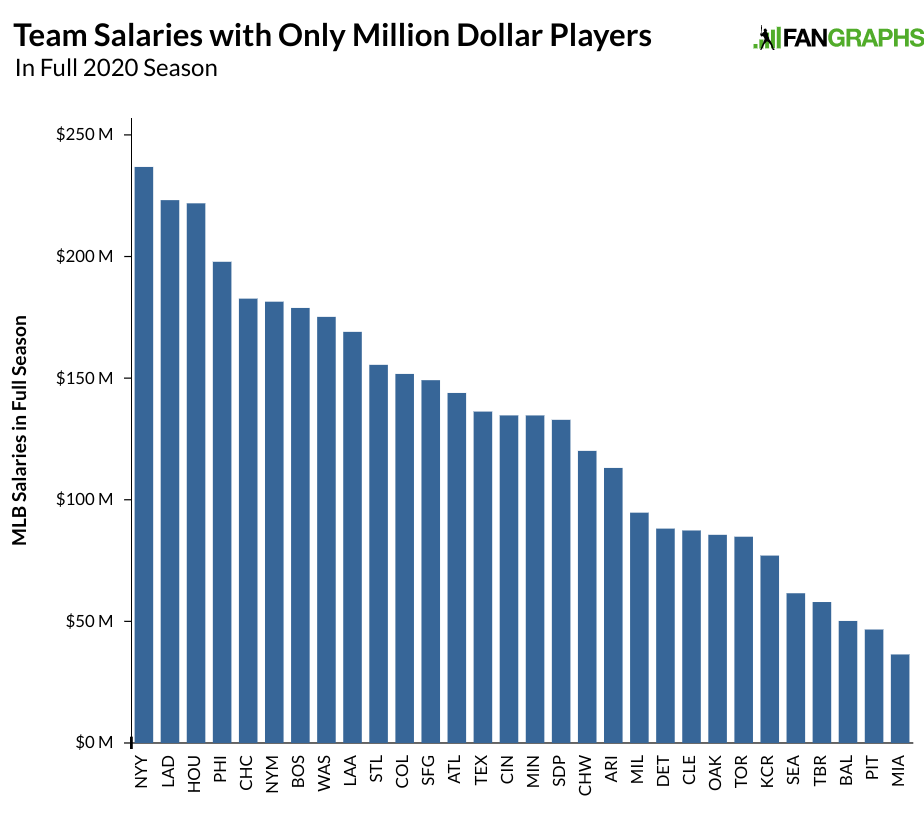
To provide some sense of the typical payroll gap between teams, the graph below shows only salaries of $1 million or more projected in the original 2020 season:

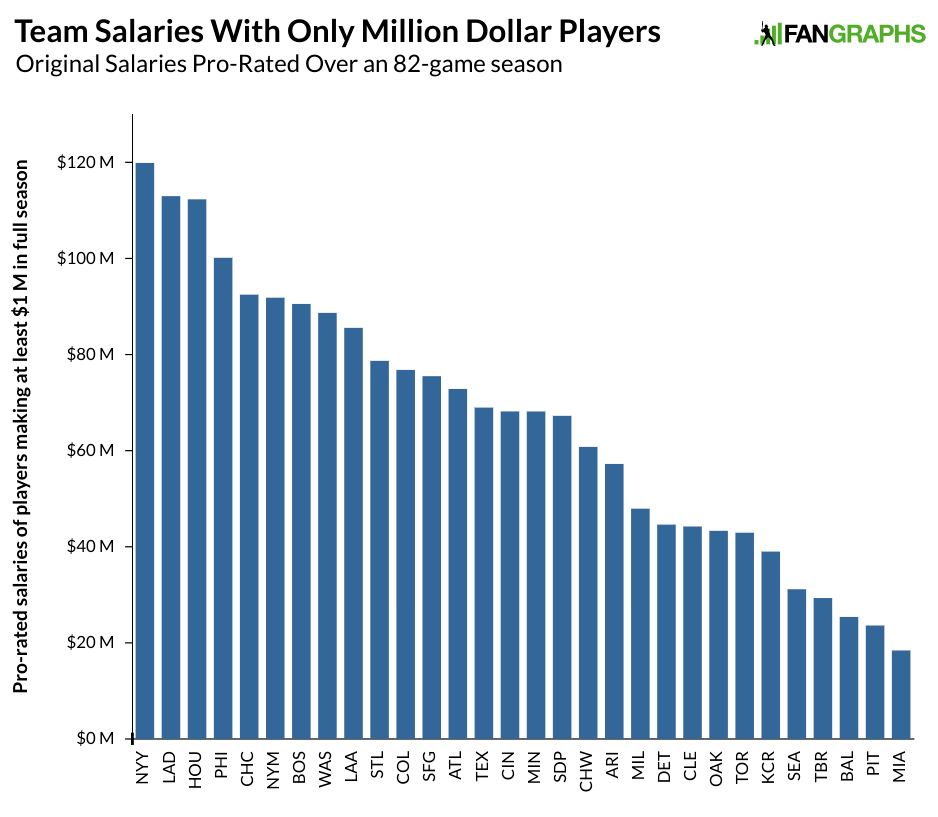
We see a huge spread between the top and bottom teams, which is fairly typical over the last few years. Here’s what the same graph looks like with pro-rated salaries over an 82-game season:

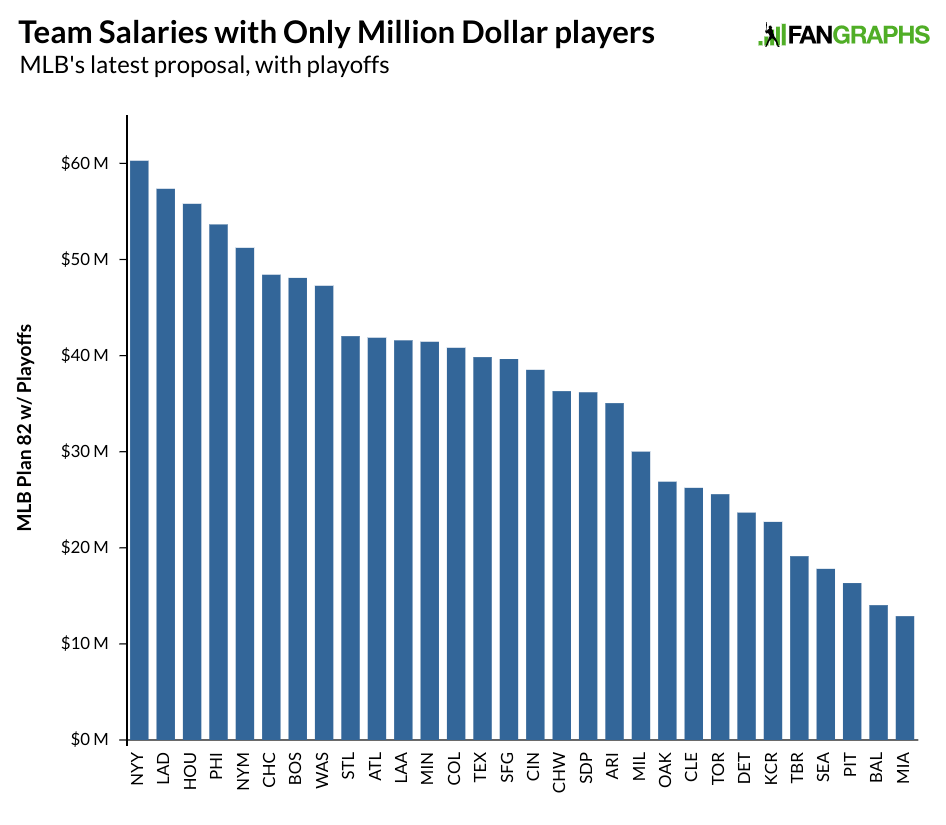
The second graph is basically the first one divided in half. These aren’t full payrolls because we’d need to add in all the minimum-salaried players, but the differences you see are pretty close to the total numbers. MLB’s latest proposal hits the highest-salaried players the hardest, and the teams that pay the higher-salaried players tend to have the larger payrolls. Here’s what would happen to team payrolls under MLB’s latest offer, including only players originally scheduled to make $1 million or more in a full season. The $200 million for playoffs is included in the figures below:

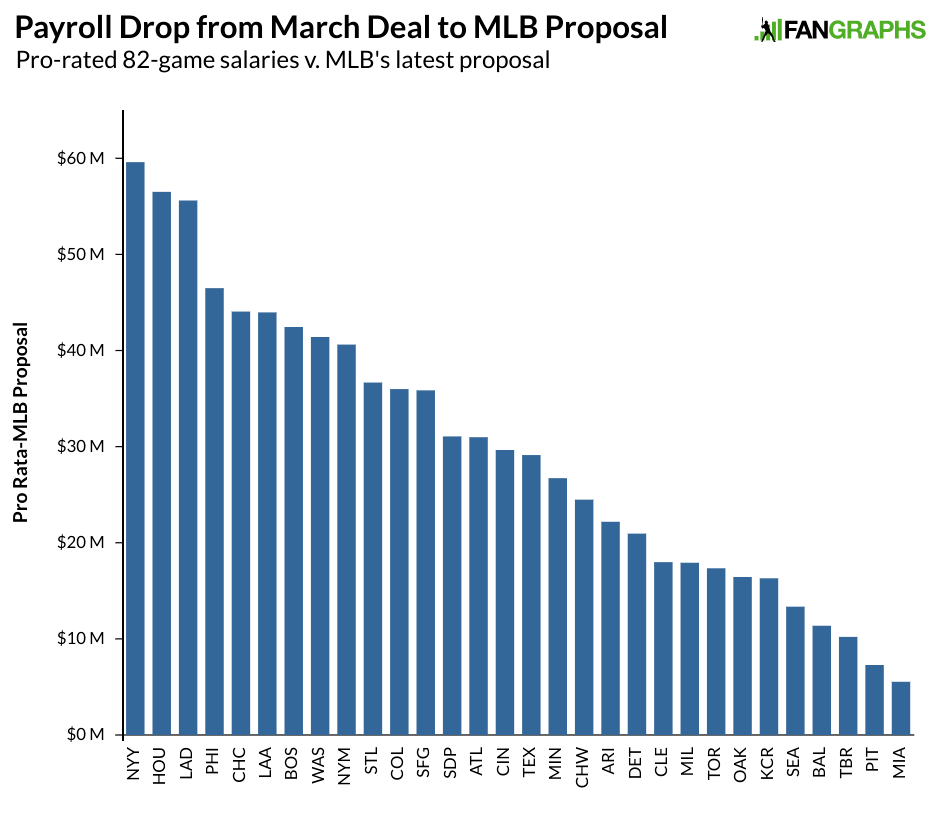
We see these salaries bundled more in the middle. MLB’s proposal dropped these players’ salaries by 45% compared to a pro-rated 82-game season, but the standard deviation of these salaries dropped by 53%. The graph below shows the changes in each team’s payroll from the March agreement with pro-rated salaries to MLB’s latest proposal:

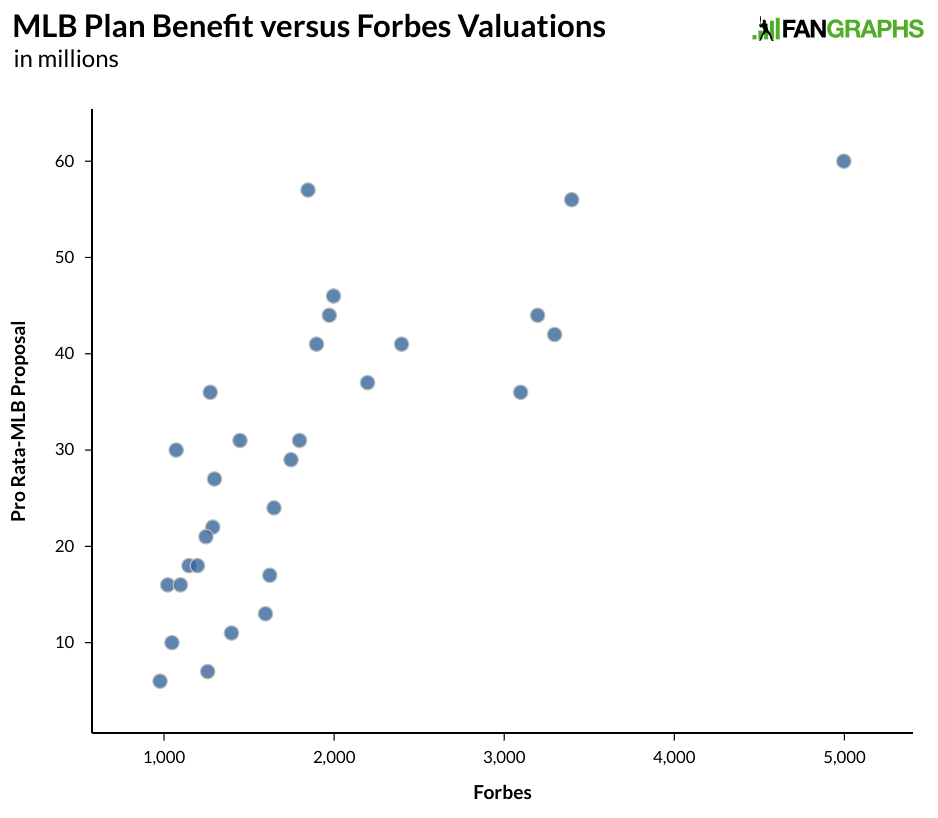
Those teams on the left have the most to gain under MLB’s latest proposal, while those teams on the far right barely see any change to payroll at all. It’s not hard to identify the types of teams in each group. We have the Yankees, Astros, Dodgers, Phillies Cubs, Angels, and Red Sox leading the way with salary cuts while the Marlins, Pirates, Rays, Royals, and A’s are all near the bottom in terms of change. To illustrate the change a little more, here’s a scatter plot showing the change above with Forbes valuations:

There’s a pretty strong relationship here (the R-squared =.57) and a lot of that is because rich teams spend more. In MLB’s latest proposal, those same rich team receive the biggest benefits. It’s the owners’ of trying to share the lost revenue, except instead of doing it amongst themselves, they are hoping that the players will do it for them. It’s a way that prevents some potentially difficult conversations between Rob Manfred and the owners. If the union response is any indication, the owners are going to need to have some of those difficult conversations in the coming days if they want to have a 2020 baseball season.


From Castoff to Hero: Another Note on the Blues

In 1936, Alfred Lovell Dean, better known by his nickname Chubby, decided to take his baseball career into his own hands. He was all of 20 years old, a native of Mount Airy, North Carolina, and a valued pitcher on the Duke baseball team — until he quit, that is.

Maybe he left due to the lack of run support offered by his collegiate teammates — a 16-strikeout game in the 1935 season ended in a loss on his record. That same year, “renowned” baseball statistician J. Gaskill McDaniel rated Dean the most valuable player of the Coastal Plains League, which might have increased Dean’s perception that his talents were being wasted where he was. At any rate, in cold early days of the year, Dean packed up his things and headed north to find his fortune. His sights were aimed no lower than the New York Yankees.

But the New York Yankees didn’t see what J. Gaskill McDaniel saw. They saw a 20-year-old with a wild arm and limited hitting ability. These were the Yankees of Ruth and Gehrig, whose every season began with an expectation of a World Series title. So they turned Chubby Dean down. There was no place for him there.

***

There was a place for him, though, a little to the southwest. Connie Mack was looking to bolster a last-place Philadelphia Athletics team that had been on a steady decline since their seven-game World Series loss to the Cardinals in 1931. He was willing to take a chance on almost anyone who showed talent. On February 10, Duke baseball coach John W. Coombs confirmed from his hospital bed in Palestine, North Carolina, that his erstwhile pitcher had signed with the A’s. Read the rest of this entry »


Half a World Away and Right at Home: Sciambi and Perez on Broadcasting the KBO

It’s 1 AM on a Saturday night in mid-May, and in his otherwise quiet New York City apartment, Jon Sciambi is getting ready for work. As his neighbors snooze, Sciambi, a veteran TV and radio announcer for ESPN, goes over box scores and lineups in his home broadcast studio ahead of the upcoming LG Twins-Kiwoom Heroes game in the KBO, Korea’s professional baseball league. With MLB – Sciambi’s regular assignment – on hold due to the coronavirus pandemic, his job now is to do play by play for games featuring teams and players that, a few weeks prior, he barely knew (if he knew them at all), doing so from thousands of miles away while stuck at home like so many other Americans. For both him and viewers around the country, the KBO is the only game in town, and one that Sciambi and the rest of his ESPN counterparts are learning more or less on the fly.

“This is our baseball window, is the way I’m looking at it, and we’re trying to sort it out,” Sciambi says. “We’re trying to get as much information as we possibly can and put it out there and get good stories and talk baseball and have some fun, man. Smile and have some fun.”

Ordinarily during this time of year, Sciambi and ESPN would be working their way through the early part of the MLB season, traveling from coast to coast and bringing viewers big games from the biggest teams. But COVID-19 has upended both lives and leagues, leaving sports networks scrambling to fill slots that ordinarily would’ve gone not just to MLB, but also to the other major North American professional leagues, which also find themselves on hiatus. ESPN, which normally airs a handful of MLB games a week and spends countless hours parsing transactions and takes, was no exception, suddenly finding itself without any baseball at all as every league on the planet came to an indefinite halt.

The solution came in the form of the KBO. Thanks to a rigorous program of testing and contact tracing, South Korea was able to contain COVID-19 more quickly and effectively than other countries, allowing its citizenry to resume a semblance of normal life. That included its professional league, which had been forced to stop spring training in mid-March and delay its Opening Day. A month later, though, the KBO announced that it would return at the beginning of May, albeit in stadiums without fans and with social distancing measures, such as no handshakes, high fives, or spitting. Aside from Taiwan’s CPBL, it would be the only professional league in action — and as the highest-caliber baseball available, it became an immediate draw for ESPN. Read the rest of this entry »


FanGraphs Prep: Strikeouts, ERA, and the Relationship Between Variables

This is the latest in a series of baseball-themed lessons we’re calling FanGraphs Prep. In light of so many parents suddenly having their school-aged kids learning from home, we hope is that these units offer a thoughtfully designed, baseball-themed supplement to the school work your student might already be doing.

Overview:

A four-day unit that uses strikeouts, walks, and home runs to describe relationships between variables and predictive logic.

Many statistics in baseball are inter-related. We examined the relationship between runs and wins a few weeks ago. Today, we’ll learn about a few more of these relationships and how to think predicatively about them.

Learning Objectives:

  • Make a hypothesis about the relationship between two variables
  • Create a scatter plot using a dataset containing multiple variables
  • Estimate and calculate a trend line
  • Evaluate a hypothesis using data
  • Describe the relationship between variables

Target Grade Level: 7-9

Daily Activities

Day 1
ERA, or earned run average, measures how many runs a pitcher gives up per nine innings. It’s measured in runs — the only thing this statistic cares about is how many innings a pitcher throws and how many earned runs they surrender. But we can look at other statistics as well: what percentage of opposing batters a pitcher strikes out, what percentage they walk, and what percentage of opposing batters hit home runs.

Come up with a hypothesis about how these three statistics relate to ERA. Do you think that pitchers who strike out more batters allow fewer runs on average, or more? Why? Do the same for each of strikeout rate, walk rate, and home run rate. Read the rest of this entry »