Archive for Research

Are Plate Discipline Breakouts for Real?

Earlier this month, I noted that hitters are chasing fewer pitches and seeking out fastballs in the zone. It’s one thing batters can do to fight back against the rising pitching talent and increased strikeouts. It seemed to me that every time I looked into a hitter potentially breaking out this season, I saw the same pattern: fewer swings on pitches outside the zone and a rising wRC+.

There comes a point when writing about the same thing over and over again becomes presumptuous if we can’t quite be sure that the benefits will last. To that end, I first went through plate discipline numbers from this season to determine if chasing fewer pitches seemed to help batters like I think it should. First, I looked at all hitters with at least 300 plate appearances in 2018 who were also qualified for the batting title as of May 13 of this year. While we can presume that taking pitches outside the strike zone is a skill, and one that stabilizes pretty quickly based on previous research, here’s how the numbers from last season and this one match up as of Tuesday’s data. Read the rest of this entry »


Further Adventures In Starting vs. Relieving

Last week, I investigated the changing performance of starters relative to relievers. There’s nothing too crazy about that — FanGraphs is a baseball analysis website, after all, and the starter/reliever divide is a rich topic for analysis. I have to confess, though, that the reception of the article was pretty exciting for me. You see, I got into baseball statistics when a friend recommended The Book to me, and there was Tom Tango, writing about my piece.

Aside from making me feel validated, Tango went over a few methodological improvements I could make to strip a little more noise out of the data. That, in essence, is what all of this analysis is doing — removing noise piece by piece, hoping to find the sweet, sweet signal underneath it all. In my initial article, I covered three topics: pitchers the first time through the order, starters vs. relievers but only using good pitchers, and swingmen. Today, I’d like to look at each of the three with a slightly different aim.

First, let’s talk about performance the first time through the order. Focusing on this consistent set of data (first time through the order, batters 1-7) for both starters and relievers lets us strip out distributional effects from starter workload changes. Merely looking at these splits, however, left out one key factor: home vs. away performance. Mitchel Lichtman has found that home field advantage isn’t a constant — it’s highest in the first inning. Road batters have a pronounced disadvantage relative to home batters in the first inning, which fades away somewhat afterwards. Credit it to having to hit cold, or go the other way and say that road starters are off their game in the first inning, but it’s worth exploring home and away splits to see if there’s anything there. Read the rest of this entry »


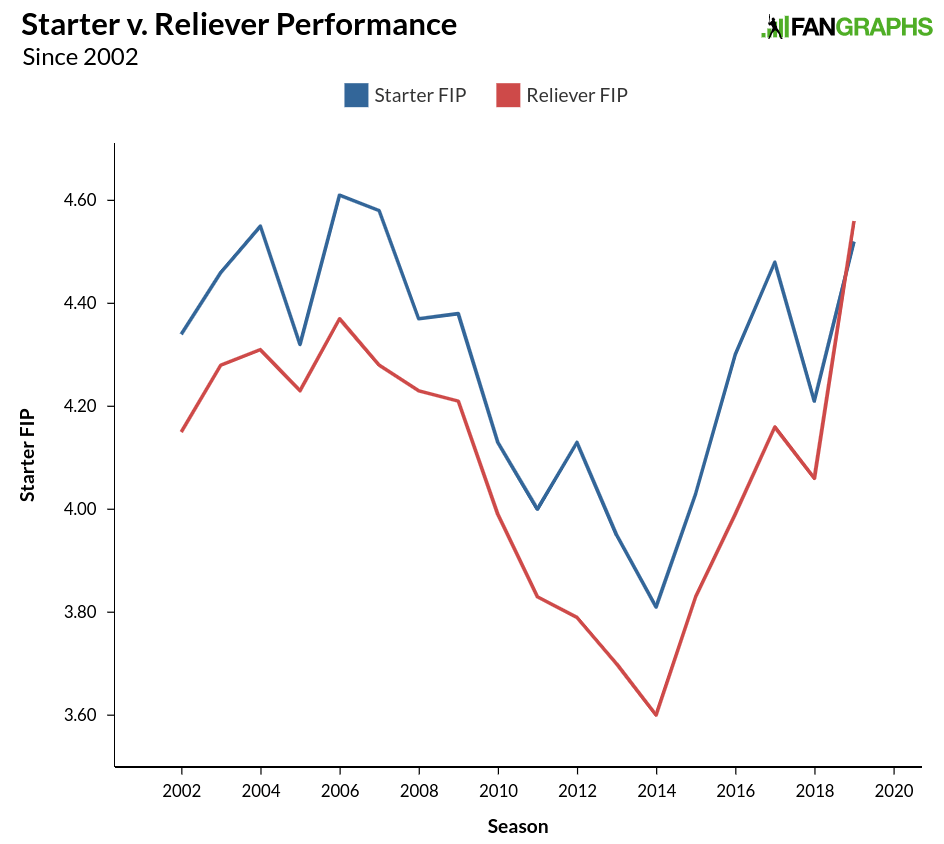
Are Starters Improving Relative to Relievers?

If you read about baseball on the internet these days, it’s tough to miss pieces on the changing relative skill levels of relievers and starting pitchers. As Sam Miller pointed out on Effectively Wild, relievers have a higher ERA this year than starters. Not only that, but the strikeout rate advantage relievers have traditionally had over starters is plummeting. Look at almost any statistic, and the historical edge relievers have had over those in the rotation has diminished.

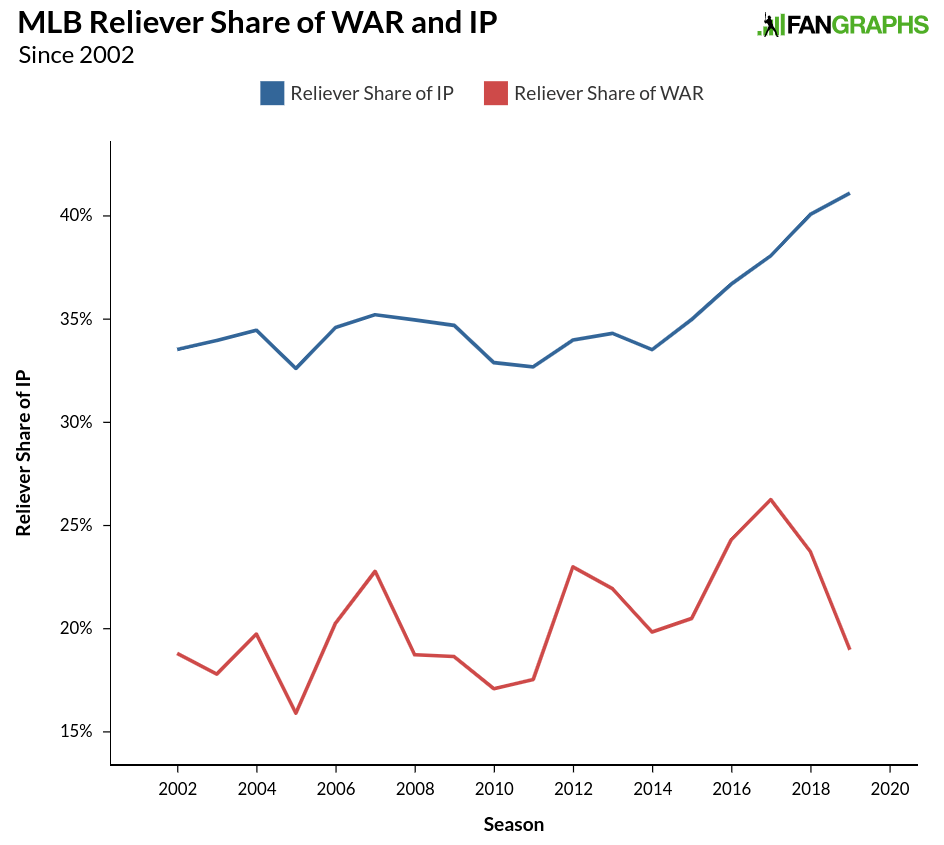
At the same time, relievers are setting volume records left and right. For five straight years, relievers have set a new record for largest share of pitches thrown. In 2012, Rockies relievers struck out more batters than Rockies starters for the first time in baseball history, and you could convince yourself that it was a Coors field oddity. In the next six years, however, four more teams did it. From a bulk perspective, relievers are pitching more and more innings, carrying ever more of baseball’s pitching workload.

Clearly, these two effects are correlated. You’ve undoubtedly heard of the times-through-the-order penalty, the concept that starters fare worse each time through the batting order. In tandem with the innings spike by relievers, the number of pitches starters throw their third time through the order is plummeting. It’s not rocket science — the third time through the order is the time when starters are weakest, and those weak points are disappearing. Of course starters’ stats look better!

Given the changing roles of starters and relievers, it’s probably not right to look at unmodified splits to figure out whether starters are actually getting better relative to relievers. Even if the talent level of every pitcher remained exactly the same, cutting out a chunk of third-time-through plate appearances from starters’ cumulative totals will change their statistics. To actually see whether relievers are getting better relative to starters, we’ll need to do something a little fancier. Read the rest of this entry »


We Got Ice: The Math of Being Drilled

On May 17, 2018, Paul DeJong stepped to the plate in a tense situation. The Cardinals were down 4-0 in the eighth, but were rallying — two on, nobody out. On a 2-2 pitch, DeJong saw a pitch inside, and he didn’t exactly get out of the way:

After a replay review, DeJong went to first base. Then, he went to the doctor. The diagnosis: a broken hand. DeJong sat out nearly two months, and when he came back, his power lagged. At the time of his injury, he’d slugged his way to a 125 wRC+ and .213 ISO. The balance of the year, he compiled a 90 wRC+ and a .182 ISO, and the first month back was particularly dire: 59 wRC+ and a Hamiltonian .090 ISO.

Clearly, getting hit by that pitch wasn’t worth it. DeJong is one of the best players in baseball this year, and he was off to a solid start last year before getting hit. If it weren’t for that power-sapping injury, we might be talking about him as a consistent star rather than an out-of-nowhere surprise. At the time, though, it surely made sense to take one for the team. Reaching base there was huge — it increased the Cardinals’ chances of winning the game by almost 10%.

In a full season, a league-average baseball player (think Kevin Pillar or DJ LeMahieu’s 2018) is worth around two wins above replacement. That’s over 600 plate appearances — each trip to the plate adds infinitesimal value. DeJong had a chance to get 1/20th of that value in a single plate appearance, and he didn’t even have to do anything. As the saying goes, “We got ice.” Accepting a hit by pitch to get on base is a time-honored tradition. But is it worth it?

While this question seems pretty straightforward, it’s a thornier problem than it first appears. For example, if a career minor-leaguer, who is only up for the day, is at the plate, it almost doesn’t matter how likely it is that he’ll be injured; it probably makes sense to lean into one. If Mike Trout is at the plate, on the other hand, he should probably be exceedingly cautious. I don’t have all the answers. I do, however, have a theoretical model that should help you know how to feel about any given player taking one for the team.

To start, we’ll need an idea of the likelihood of injury. Anecdotes are great and all, but to judge the likelihood of injury we’ll need more. The DeJong example above is great, but he’s been hit by 18 pitches in his career. Cherry-picking one or two is no way to study this. Luckily, The American Journal of Sports Medicine published an excellent study on HBP injuries last year, and we can use their data.

Between 2011 and 2015, the study counts 361 HBP’s that caused injury in MLB, averaging 11.7 days missed per injury. That gives us a rough baseline for days missed per injury, averaging over the bruised ribs that might result in a precautionary day of rest and the broken hands that linger. Add in the total number of HBP’s from 2011-2015 (7838), and we can work out how likely an injury is to occur each time a batter is hit.

Armed with this data, let’s take our first naive pass at estimating the net benefit of letting yourself get hit. For this example, we’ll use Trout. Trout’s projected 2019 wOBA is .432, while being hit by a pitch clocks in at .720. Through the magic of wOBA, we can work out the run value of that single event — in this case, about a quarter of a run. In other words, every time Trout gets hit by a pitch, that plate appearance is worth .25 runs more to the Angels than a random Trout plate appearance. Not bad!

Next, let’s turn to the dark side. In the study data, about 5% of HBP’s resulted in injury. The average time missed per injury was roughly 11.7 days. In all, getting hit by a pitch costs around half a day lost due to injury, though most HBP’s have no lasting ill effects. For ease of calculation, we’ll assume Trout gets replaced by a replacement-level player and gets 4.5 plate appearances a day, basically his career average.

Sticking with projections, Trout is worth about 8.4 WAR per 600 PA. Do the math, and a half-day absence costs Trout just under a twentieth of a win above replacement. By substituting in this year’s run value for a win, we get that Trout’s absence costs the Angels a third of a run. Whoops! Given that the initial event was worth about a quarter of a run, every time Trout gets hit, the Angels lose expected value.

Well, we’ve established one extreme. Mike Trout shouldn’t lean into a pitch — his continued health is too valuable. Let’s run this again for a 100 wRC+, league-average WAR player. Joe Average has a .316 wOBA, so getting hit by a pitch is more valuable to him — he picks up a full third of a run by hanging an elbow out there. At the same time, Joe’s team doesn’t miss his absence nearly as much — he costs them a tiny fraction of a win through his expected absence. That said, that still works out to .12 runs. Joe Average should lean in, but he doesn’t benefit his team all that much by doing so.

To find a player who should really consider stocking up on body armor and going full Brandon Guyer, we need to get into the fringes of a major league roster. A perfectly average player is a valuable commodity, after all. How about a utility infielder, though? Consider Hernan Perez, the do-everything Brewer who played every position except catcher last year, but hit quite poorly while doing so.

Perez has a .288 career wOBA, so let’s use that in our equation. He projects to be worth about 1 WAR in a full season of games, but he doesn’t play every game. In fact, he has averaged about two-thirds the plate appearances of a regular, so we can ignore one-third of the plate appearances he misses as times when the team already wasn’t planning on using him. Perez’s lean grants him .36 runs over his normal output, a significant upgrade. He then misses fewer at-bats, and his value is easier to replace — in all, his absence costs the team only .03 runs. We’re slicing things thin here, but if Hernan Perez has a chance to get hit, it looks like he should take it.

These examples lack context, though. Trout might pick up .25 context-neutral runs every time he’s hit, but plate appearances don’t come without context. If the Angels are up 10, those runs are meaningless. If they’re in a tie game, they’re incredibly valuable. Let’s redo the analysis, but this time consider how many expected wins being hit adds, rather than how many runs.

To start, consider an extreme situation. It’s the bottom of the ninth, and the Angels are locked in a tie game. The bases are loaded, with two outs, when Trout steps to the plate. Get on base, and the game ends. Make an out, and we’re headed to extras. This is the situation where getting hit is most valuable — if you get hit, you literally win the game.

In a normal plate appearance, Trout is already a great player to have at the plate in this situation. His OBP projection for the balance of the year is .446. Thus, you can think of the chances of the Angels winning the game as .446*1 (he gets on base, they win) plus .554*.5 (he makes an out, the game goes to extra innings and the Angels are 50% to win). This makes the Angels 72.3% likely to win the game at the moment Trout steps into the box. Getting hit increases the chances of a win to, well, 100% — a 27.7% pickup.

In the Trout section above, we worked out that Trout’s expected absence costs the Angels about a twentieth of a win. It looks like it might make sense for any hitter, even Mike Trout, to accept a HBP in the highest-possible-leverage situation. We’ve defined the boundaries — in a normal plate appearance, you need to be a below-average backup for accepting a base to make sense. In the most dramatic possible situation, everyone should do it. What about the spaces in between, though?

Well, this section is going to veer into bad math, but given the speculative nature of this article, I think I’m okay with that. Rather than work out the exact win probability change for each outcome, as we did for the Trout example, let’s just use leverage index. In essence, leverage index measures how important a plate appearance is in terms of swinging the outcome of the game. Average is 1.0, so a plate appearance with a leverage index of 2.0 means that the result of this plate appearance will, on average, change win expectancy twice as much as a random at-bat.

Now, leverage index isn’t perfect. In some situations (like my hypothetical above), a home run is the same as a walk. In others, say second and third with two outs when your team is down by two runs, hits are incredibly valuable and free passes much less so. Still, it gives us a template. Let’s revisit Joe Average using LI.

Joe steps up to the plate to start the bottom of the ninth inning, down 2-0 (LI 1.97). Rather than compute the exact change in win probabilities for each outcome, let’s just multiply his run value by the leverage index. From above, being hit is worth .34 runs. Multiply that by the leverage of the situation, and it’s the equivalent of .68 runs in a context-neutral situation. Since his absence costs his team about .12 runs, the calculus is clear — in high leverage spots, Joe Average should accept a hit by pitch if he wants to help his team win.

Let’s rewrite this as a formula. If you want to know whether it makes sense for any player to take one for the team, you can roughly use this:

(.720- wOBA) / 1.194 * LI – 10.026 * PA/Game * .54 * WAR/PA

A quick breakdown: .720 minus the player’s wOBA gives the extra wOBA accrued by being hit, and dividing it by 1.194 (wOBA scale) puts it into run terms, where it can be multiplied by the leverage of the situation. At 10.026 runs a win and .54 days of expected absence per hit-by-pitch, you can work out the expected run cost of an injury by plugging in the hitter’s playing time and skill level.

There’s still one thing left to cover. Should Paul DeJong have been trying to get hit? Let’s plug it into the formula and find out. When DeJong got hit, the Leverage Index was exactly 2.0. ZiPS projected his 2018 wOBA as .320 before the season (2.1 WAR/600 PA), so we’ve got all the values we need. DeJong earned .67 context-neutral runs by being hit, and his expected absence cost the team a mere .09 context-neutral runs. It was worth it, ex ante, to get hit there.

Now, all of this said, this model isn’t the last word on the subject. It’s extremely approximate, for one. It doesn’t cover any reduced effectiveness that doesn’t involve missing games, a notoriously difficult problem to study. Lastly, it treats getting hit as a binary act that doesn’t interact with the rest of the game. Anthony Rizzo needs to get hit to be Anthony Rizzo — he’s made a career out of standing with two-thirds of his body hanging over the plate to hit outside pitches. Accepting a hit by pitch might sometimes be optional and independent of the rest of the game, but sometimes you can’t disentangle it.

Still, having a rough guess of the benefits and costs of a free trip to first base beats having no idea. Should you get hit by a pitch? Maybe! It depends who you are, and it depends on the game state. The next time you hear an announcer say “We got ice,” know that it’s not that simple. It might be a baseball truism, but without knowing the context, you can never say for sure. There are situations where Mike Trout should get hit by a pitch, and situations where a below-average player should shy away from contact. Nothing in baseball is ever black and white.

Note: The initial version of this article incorrectly included instance of hit by pitch in both the major and minor leagues; is has been updated to correctly reflect the likelihood of injury due to being hit by a pitch.


Shortstops Are Hitting Like Never Before

Take a look at a 2019 WAR leaderboard and you’ll see some familiar names at the top. Cody Bellinger is having a whale of a season. Christian Yelich is hitting like Barry Bonds and is somehow second in the majors in baserunning runs as well. Mike Trout — well, you know Mike Trout. Look a little closer though, and you might notice something strange. There are four shortstops in the top 10 for WAR this year, and they’re not the usual suspects. Paul DeJong, Elvis Andrus, Jorge Polanco, and Javier Báez are all having great seasons so far, and if you had them as the four best shortstops in baseball this year, you’re a better prognosticator than I am.

Cast your eyes a little further down the board and you might see an interesting trend. Marcus Semien is 11th in WAR. Tim Anderson, Trevor Story, Xander Bogaerts, and Adalberto Mondesi are in the top 25, and Fernando Tatis Jr. isn’t far behind. Perennial stalwarts Andrelton Simmons, Corey Seager, and Carlos Correa are off to good starts. Shortstop, in fact, has produced more WAR than any other position this year.

Now, to some extent, that’s a referendum on how important shortstop is defensively. Only catcher has a higher positional adjustment than shortstop, and as a result only catchers have been worth more defensive runs this year. However, dismissing the prevalence of shortstops atop the WAR leaderboard as a defense-based illusion sells this current crop short. We could very well be looking at the best-hitting shortstop season of all time.

Let’s start at the very top with wRC+. This year’s shortstop class has produced a 107 wRC+ so far. That isn’t the actual best in baseball history, but it’s second only to 1874, and hoo boy are stats from 1874 weird. In that season, shortstops walked .9% of the time, struck out 1.2% of the time, and delivered a batting line of .305/.311/.372 in only 660 games. Let’s be reasonable here and throw out everything before the turn of the century. Cut those out, and the leaderboard looks like this:

Best Shortstop Offensive Seasons, 1901-2019
Year wRC+
2019 107
1904 101
1908 96
1909 96
2018 95
1905 94
1917 93
1910 93
1907 93
2016 93

2019 shortstops are on top, and it isn’t particularly close. Strip out everything pre-integration, and the recent rise of slugging shortstops jumps out even more:

Best Shortstop Offensive Seasons, 1947-2019
Year wRC+
2019 107
2018 95
2016 93
1947 90
2007 90
1964 90
1949 89
2005 88
2017 88
2002 88

Ask most baseball fans for the best shortstop-hitting season in history, and they’ll point to 2002. This was indeed a year of great shortstop hitters — Alex Rodriguez hit .300/.392/.623 on his way to a 10-WAR season, and Derek Jeter, Nomar Garciaparra, and Miguel Tejada all had sterling years. That’s all well and good — it was a top 10 season on the above leaderboard, after all — but 2002 also had 585 plate appearances of Neifi Perez’s .236/.260/.303 line, as well as a shockingly low-offense season from Rockies shortstop Juan Uribe, who hit .240/.286/.341 while playing half of his games at Coors.

This season has its fair share of laggards (Brandon Crawford is slugging .212), but it also has 16 shortstops with a batting line at or above league average. Freddy Galvis is hitting .297/.317/.485 and is the 14th-best-hitting shortstop this year. That 114 wRC+ would have been sixth-best in 2002. The depth of shortstop right now is simply stunning. Read the rest of this entry »


How Hitters Are Fighting Back Against Rising Strikeouts

Over the last decade, hitters have been fighting a losing battle against incredibly talented pitchers who throw at higher velocities with even more effective offspeed and breaking pitches. Faced with the increase in talent and velocity on the pitching side, position players have done their best to adapt. The emphasis on launch angle, so as to hit balls harder and farther to get an extra base hit, is a fight against hitters’ inability to take the ball the other way or string together rallies, which are increasingly blunted by the strikeouts. Hitting an 89 mph fastball on the outer edge of the plate to the opposite field is a strategy that might work well. Unfortunately, those 89 mph fastballs aren’t as prevalent as 89 mph sliders that dart away from the outside corner and the fastballs that are routinely in the mid-90s. Hitters are continuously adapting to changes in pitching in order to be successful, and this season, they are getting better by not swinging.

Hitters tend to get some blame for their role in there being fewer balls in play, what with the proliferation of strikeouts and homers and three true outcome players who seek walks and power and have a willingness to swing and miss, but much of what hitters do is simply react to what pitchers do. The increase in strikeouts over the years isn’t due to hitters actively choosing to strike out, but to pitchers who have gotten much better at striking hitters out. When I looked at the issue last season, the rise in strikeouts was due to primarily two factors: the increase in the number of pitches at 95 mph or greater, and the increase in the use of non-fastballs to get hitters out. It’s hard to catch up to velocity, and it’s really hard to lay off breaking and offspeed pitches. This season, pitchers are still throwing hard, and as Ben Clemens demonstrated, they are throwing even fewer fastballs.

To go along with the increased use of non-fastballs is an accompanying decrease in pitches in the strike zone. The graph below shows the number of fastballs and non-fastballs in the strike zone over the past few years. Read the rest of this entry »


Pitching Is Winning Baseball’s Latest Tug of War

If you want to paint with an extremely broad brush, you can think of the last twenty years of analytical advances in baseball as waves, alternately benefiting hitters and pitchers. First came the Moneyball years, when sabermetric advances brought offense into the game. It wasn’t just that teams started playing more beefy guys who could hit for power and take a walk. They also encouraged their existing players to be more patient — that’s how you got the iconic four-hour Yankees-Red Sox games of the mid-2000s, in which both teams seemed to make a personal challenge out of who could take more pitches. This coincided with the beginning of the end of the sacrifice bunt, yet another boost to offense.

If it first seemed like every analytical advance increased offense, however, the tables quickly turned. First the Rays realized that newly offense-minded front offices were undervaluing defense. Then they turned to infield shifts. Before long, the Pirates were using data to optimize pitch selection and every team was hunting high and low for pitch framing. If the early 2000s were all about using math to find better ways to hit, 2008 to 2014 was about using data to strangle offense from every angle.

Things have started moving more quickly since then. Batters reacted by trying to lift the ball more, helped out by a livelier baseball. Pitchers tried throwing higher in the zone to counter that, and at the same time teams started working with pitchers to tailor arsenals to their innate spin rates and pitch shapes. It’s not stopping here — batters are going to work to counter pitchers’ new arsenals, and defenses are going to work to find new and better shifts.

For all this back and forth though, I think that the long game favors pitching. The reason is that, to my mind, batting is a game of picking on weaknesses. Teams don’t get their offense against the aces and the tough part of the bullpen, or in lefty-lefty matchups. They pick on tiring pitchers, righties pitching to lefties, or relievers pitching their third game in three days. It’s always been this way — offense spikes in expansion years when the pitching pool gets diluted, and the times-through-the-order penalty has always existed.

If that’s where offense has always been generated, however, then batters are in trouble. Pitching staffs across baseball are shoring up weak points like never before, and there’s not much offenses can do about it aside from just hit better. It’s still April, but it’s almost a guarantee that two pitching trends are going to reach all-time extremes this year. You’ve probably heard of the first one: starters will face batting orders for a third or fourth time less than ever before. The second one is more subtle, but it’s affecting offense just the same. So far in 2019, batters have faced opposite-handed pitching only 51% of the time, a record low.

Let’s handle the times through the order trend first. The effect isn’t novel — I learned about it from The Book, but the general concept has existed much longer than that. Ted Williams talked about it in The Science of Hitting, and it’s not some deep secret. The more looks a batter gets at a pitcher, the better he sees the pitches. It’s not clear whether pitcher fatigue adds to the penalty, but either way it’s not a small effect. In 2018, starting pitchers allowed a .304 wOBA the first time through the order and a .336 wOBA the third time through. That 32-point wOBA swing is about the same as the difference between the 2018 Yankees offense and the 2018 Royals offense. It’s a big deal, in other words. Read the rest of this entry »


Fastballs Are Faster (and Rarer) Than Ever

The bottom of the eighth inning of last Wednesday’s Brewers-Angels game was, at first glance, fairly uneventful. Down 4-2, the Brewers called on converted starter Junior Guerra to keep the game in reach. He delivered — two strikeouts sandwiched a groundout, and the team went to the ninth down only two. Guerra is the fourth or fifth option out of the Brewers bullpen; he’s also a perfect embodiment of modern pitching. He threw 16 pitches in the inning, and less than half were heaters — six fastballs, four breaking balls, and six splitters. When he did throw fastballs, though, he put some mustard on them — two hit 96 on the gun, and he’s averaging about 95 mph so far this year.

These two trends — fewer and faster fastballs — are spreading like wildfire across the game. Sometimes it happens in jumps, like the Twins hiring a progressive pitching coach this offseason. Sometimes it happens organically, like Junior Guerra leaning on his splitter and slider a little more out of the bullpen. It’s a game-wide trend, though, and it seems likely to continue. This year, starters and relievers are both throwing their lowest share of fastballs since we’ve had pitch-level data. When they do throw fastballs, though, both groups are throwing them harder than ever before.

Without looking at a single piece of data, you could have convinced me that those two trends were likely true, but I wanted to look into the numbers to know for certain. First things first — we’ll need a consistent sample across years. Taking this year’s stats and comparing them to previous full-year averages won’t work, because pitchers consistently throw at lower velocities in March and April than they do in the year as a whole. In 2018, for example, March and April four-seamers were .2 mph slower than the year as a whole. Thus, we’re going to use data only through April 10th for every season to properly account for this systematic bias. Let’s take a look at that data, shall we? A quick methodological note: I’m excluding cut fastballs, as classification systems have real trouble differentiating them from sliders:

Read the rest of this entry »


An Update on How to Value Draft Picks

In November, I published the results of my research attempting to put a value on minor league prospects. It seems only natural that a similar study on draft picks should follow.

As with prospect valuations, considerable work has preceded mine in the area of valuing draft picks. Sky Andrechuk, Victor Wang, Matthew Murphy, Jeff Zimmerman, and Anthony Rescan and Martin Alonso have all done similar studies.

The work below is less a replacement of the work already done and is more of a continuation of, and addition to, the study of the subject matter. As to why we might want to know this information, creating an expected value for a draft pick helps us to understand and manage our expectations of draftees’ performance. More practically, teams regularly give up draft picks to sign free agents, receive extra draft picks when they lose free agents or reside in a smaller media market, and drop slots when they exceed the highest competitive balance tax payroll threshold, not to mention that some picks can be traded. Determining a value for these picks helps us better understand the decisions teams make regarding those picks.

In some ways, determining draft pick value is a little more complicated than figuring out prospect value. When determining prospect value, players are placed within the constraints of the current CBA, which provides for a minimum salary for roughly three seasons and suppressed arbitration salaries for another three years after that before a player reaches free agency. Draft picks are confined to the same system, but there is also a signing bonus to consider, not to mention slotting rules that are often manipulated in order to move money around to different picks.

Due to signing bonuses and bonus slots, to arrive at an appropriate value for a draft pick, it isn’t enough to determine the present value of players’ WAR in the majors without getting to a dollar figure. We also have to account for the present value in dollars and then subtract the expected bonus.

Before explaining the methodology for draft picks, we can look at the very similar framework used to get to the present value of minor league prospects. From my “Update to Prospect Valuation”:

To determine surplus value for players, I used WAR produced over the first nine seasons of a career, including the season in which a prospect was ranked. Why nine years? In today’s game, most players don’t hit free agency until after their seventh major-league season. By examining nine seasons, it’s possible to account for prospects who were still a couple years away from the majors when they appeared on a top-100 list — as well as late-bloomers who might have bounced up and down between the majors and minors for a full season.

Of course, not all prospects continue to develop in the minor leagues after appearing on a top-100 list. Some debut in the majors right away. Due to the methodology outlined above, such players might be in a position to receive greater credit for their first nine seasons simply because they were closer to the majors when they were ranked. To accommodate this issue, I’ve spread out a player’s WAR over the final seven seasons of the period in question, distributing 10% of it to years three and four before slightly gradually increasing that figure up to 20% by year nine. To calculate surplus value, I’ve discounted WAR by 3% in years No. 3 through 5 (to approximate the impact of the league-minimum salary) and then 15% in year six, 32% in year seven, 48% in year eight, and 72% in year nine. Spreading out the WAR in this way not only mimics a sort of generic “development curve” but also ensures that arbitration discounts aren’t too heavy.

After that, I applied an 8% discount rate for present value. For players immediately ready to play, the extra value they get from the eighth and ninth year is minimized by removing value they actually provided from the first two years and spreading into later seasons. This similarly ensures that the controllable years of players who take longer to develop or reach the majors aren’t treated the same way as those produced by players who contribute right away. A two-win season in 2019 is more valuable than a two-win season in 2021; and this method helps to strike that balance.

Draft picks aren’t as close to the majors as most minor league prospects are. To combat this problem, I used 10 years for college draftees and 11 years for those drafted out of high school, but kept the rest the same as above.

The other difficult issue for draft picks is one of sample size. When I looked at 15 years of prospect lists, it meant we were looking at hundreds of prospects at nearly every single prospect grade. If we did the same for draft picks over 15 years, we only have 15 players at every pick, which isn’t much of a sample. To compensate for this issue, I took a large percentage of the pick in question, and then a smaller percentage on a sliding scale of the next 12 picks. After all, having the third pick in the draft isn’t just an opportunity to take the third-best player; it is the opportunity to choose between a whole host of players. The Astros taking Mark Appel ahead of Kris Bryant doesn’t make the second pick in the draft better than the first. The Astros could have had Kris Bryant, and factoring in the picks that follow helps represent that challenge.

Smoothing things out a bit helps make sure a small sample doesn’t create a bias around a pick. For example, in the years I studied (1993-2007), the third overall pick often performed poorly, but Eric Hosmer, Manny Machado, and Trevor Bauer were taken with the third pick in the three of the four drafts that followed. It wasn’t bad to have the third pick from 1993-2007. It just happened that those picks didn’t work out well.

First round picks were then adjusted upwards slightly so that the actual WAR of the picks and the adjusted value using the method above matched. The values were then smoothed out to ensure the value of the picks moved downward. The smoothing stopped mattering after the second round. After finding the present-value WAR for each pick (I used $9M/WAR), I then subtracted the slot amount for each pick to come up with a current value.

This is what the first 70 picks look like:

Draft Pick Values for 2019
Pick Present Value of Pick ($/M)
1 $45.5 M
2 $41.6 M
3 $38.2 M
4 $34.8 M
5 $31.9 M
6 $29.3 M
7 $27.4 M
8 $25.9 M
9 $24.5 M
10 $23.3 M
11 $22.2 M
12 $21.1 M
13 $20.2 M
14 $19.2 M
15 $18.4 M
16 $17.6 M
17 $16.8 M
18 $16.1 M
19 $15.4 M
20 $14.8 M
21 $14.1 M
22 $13.6 M
23 $13.0 M
24 $12.5 M
25 $12.0 M
26 $11.5 M
27 $11.1 M
28 $10.7 M
29 $10.3 M
30 $10.1 M
31 $9.8 M
32 $9.5 M
33 $9.3 M
34 $9.0 M
35 $8.8 M
36 $8.5 M
37 $8.3 M
38 $8.1 M
39 $7.8 M
40 $7.6 M
41 $7.4 M
42 $7.2 M
43 $7.0 M
44 $6.9 M
45 $6.7 M
46 $6.6 M
47 $6.4 M
48 $6.3 M
49 $6.1 M
50 $5.9 M
51 $5.8 M
52 $5.7 M
53 $5.5 M
54 $5.4 M
55 $5.3 M
56 $5.2 M
57 $5.0 M
58 $4.9 M
59 $4.8 M
60 $4.7 M
61 $4.6 M
62 $4.5 M
63 $4.4 M
64 $4.3 M
65 $4.3 M
66 $4.2 M
67 $4.1 M
68 $4.0 M
69 $3.9 M
70 $3.8 M

The values at the very top of the draft are going to be context heavy. Sometimes, the top pick is a solid 55, like Casey Mize was a season ago. Other years, it might be Bryce Harper. For context, here is how the first round played out last season in terms of bonuses and slots for the pick.

2018 MLB Draft First Round
Pick 2018 Player 2018 Slot Signing Bonus Present Value of Pick
1 Casey Mize $8.1 M $7.5 M $45.5 M
2 Joey Bart $7.49 M $7.0 M $41.6 M
3 Alec Bohm $6.95 M $5.9 M $38.2 M
4 Nick Madrigal $6.41 M $6.4 M $34.8 M
5 Jonathan India $5.95 M $5.3 M $31.9 M
6 Jared Kelenic $5.53 M $4.5 M $29.3 M
7 Ryan Weathers $5.23 M $5.2 M $27.4 M
8 Carter Stewart $4.98 M NA $25.9 M
9 Kyler Murray $4.76 M $4.7 M $24.5 M
10 Travis Swaggerty $4.56 M $4.4 M $23.3 M
11 Grayson Rodriguez $4.38 M $4.3 M $22.2 M
12 Jordan Groshans $4.2 M $3.4 M $21.1 M
13 Connor Scott $4.04 M $4.0 M $20.2 M
14 Logan Gilbert $3.88 M $3.8 M $19.2 M
15 Cole Winn $3.74 M $3.2 M $18.4 M
16 Matthew Liberatore $3.6 M $3.5 M $17.6 M
17 Jordyn Adams $3.47 M $4.1 M $16.8 M
18 Brady Singer $3.35 M $4.3 M $16.1 M
19 Nolan Gorman $3.23 M $3.2 M $15.4 M
20 Trevor Larnach $3.12 M $2.6 M $14.8 M
21 Bruce Turang $3.01 M $3.4 M $14.1 M
22 Ryan Rollison $2.91 M $2.9 M $13.6 M
23 Anthony Seigler $2.82 M $2.8 M $13.0 M
24 Nico Hoerner $2.72 M $2.7 M $12.5 M
25 Matt McLain $2.64 M NA $12.0 M
26 Triston Casas $2.55 M $2.6 M $11.5 M
27 Mason Denaberg $2.47 M $3.0 M $11.1 M
28 Seth Beer $2.4 M $2.3 M $10.7 M
29 Bo Naylor $2.33 M $2.6 M $10.3 M
30 J.T. Ginn $2.28 M NA $10.1 M

The draft reveals just how important it is for teams to receive a compensation pick the following season when they fail to sign a pick in the current year. While there is certainly lost developmental time and opportunity in losing a pick for one year, losing that pick permanently would be a major loss, and provide considerably more leverage to the players when negotiating contracts.

Moving down, this is what the picks in the third round and below are worth. For the 11th round and below, the median value is used instead of the average given the potential for a few really good picks out of thousands to distort the value beyond what would be a reasonable expectation for that pick.

Draft Pick Values for 2019
Round Present Day Value
3rd $3.8 M
4th $2.8 M
5-7 $2.5 M
8-10 $1.5 M
11-20 $1.0 M
21-30 $390,000
31-40 $250,000

In practical terms, that means that for the picks in round 20 or later, you might come up with one average player every three years. For picks in rounds 11-20, a team can expect an average player every two or three seasons. The same is true for rounds three and four combined. It’s hard to find good players in the draft after the first round. There’s as much value in the first 100 picks as in the entire rest of the draft. Teams might opt to pay a third round pick a $3,000 bonus to save money and use it elsewhere. That doesn’t mean that we should expect the same performance from that pick as we would a typical third rounder, but we should expect that the slot money the team uses elsewhere will have a value somewhere close to $4 million.

When considering how teams sometimes shift money around from the second or third round to the sixth and seventh round (and vice versa) or use money to sign players above $125,000 after the 10th round, it helps to know how to properly value every dollar spent. For the first 100 picks, where the bonuses are the highest, every dollar spent generally yields five dollars in value. In rounds 4-5, every dollar should yield about six dollars in value, and in rounds 6-10, every dollar spent should yield 10 dollars in value due to the talent available and the small signing bonuses. Given this information, it appears teams might be better off paying slightly less money in the first few rounds while still getting good talent, and shifting some of that money elsewhere in the first 10 rounds. If teams are shifting money from the first 10 rounds to the back of the draft, they need to feel pretty confident in that player’s ability.

In terms of comp picks in this year’s draft, the Arizona Diamondbacks will receive a pick at the end of the first round for losing Patrick Corbin to the Nationals. That pick is worth something close to $10 million. The six small-market teams will receive picks between rounds one and two that are worth $8 million to $9 million each. The other eight small-market picks after the second round are worth around $4 million each, and the same is true for the free agent compensation picks like the one the Dodgers will receive for losing Yasmani Grandal.

Teams signing free agents who have received a qualifying offer generally lose their second pick, and that pick is worth somewhere between $4 million and $10 million depending on where in the draft the team is picking. The Red Sox’s top pick drops down 10 spots this year because they were more than $40 million over the competitive balance tax. That penalty is only worth around $2 million.

There’s further analysis to be done based on whether a player is coming out of high school or college, as well as whether he is a position player or pitcher, but that work will be left to a later date. For now, I hope this is a useful starting point for further study, and for gaining a greater understanding of draftees’ expected production and teams’ decision making.


What’s an Opt-Out Worth?

After Manny Machado and Bryce Harper signed their gargantuan free agent deals, dominos began to fall left and right across baseball — if you’re of sound body and mind, you probably recently signed a multi-year extension with a major league franchise. When a star signs a new contract of any type, articles analyzing the contract’s value are never far behind, and this recent extension spree has been no exception. I wanted to get in on the action, but the analysis has already been done for the most part. Search for a player who recently signed a contract, and you’ll find FanGraphs analysis of it, likely with some dollars-per-WAR analysis. Chris Sale? Jay Jaffe’s got you. Kiley McDaniel covered Eloy Jimenez’s extension. Justin Verlander? Jaffe again. You get the idea. Craig Edwards even wrote about Harper vs. Machado in an exhaustive level of depth, down to figuring out state taxes.

What’s an author to do? Well, there’s one angle that hasn’t been covered for a while, believe it or not. More accurately, it’s been covered by a combination of shrugs and mathematical hand waves: the value of the opt-out in Machado’s (and Nolan Arenado’s) contract. The reason these haven’t been sufficiently covered is simple — they’re difficult to value. If we want to figure out how many wins a player projects for, a methodology exists for that exercise. Sprinkle in a little of the aging curve and the dollar value of the contract, and there’s one level of analysis. If you want to put everything in present-day dollars, it’s just more arithmetic, but the basic shape remains similar. Introducing opt-outs, however, is a step in a wholly different direction.
Read the rest of this entry »