Archive for Site News

FanGraphs Pitch Framing

In 2008, when Dan Turkenkopf was the first to quantify the value of pitch framing, he noted that it appeared to be alarmingly important. Bill Letson was similarly astounded when he calculated the size of the effect in 2010. Max Marchi and Mike Fast each took a turn in 2011, finding large and highly correlated catcher values despite using different methods. Other sabermetric luminaries have contributed sophisticated methods and sanity checks, some of which I’ll touch on below. And yet, this terrifically important, seemingly well-established, and impressively repeatable defensive skill has been left out when calculating FanGraphs player WAR and ignored when Steamer forecasts pitchers and catchers. . . until now.

In what follows, I’ll briefly lay out a series of steps for calculating how many framing runs each catcher contributed as well as and how many extra strikes each pitcher was granted (or, in some cases, earned). This much has all been done and clearly described before thanks to Dan Brooks and Harry Pavlidis; that research was updated and expanded upon by Pavlidis and Jonathan Judge. I’ll then compare the values I’ve obtained to the ones created by Baseball Prospectus, StatCorner, and Sports Info Solutions and demonstrate (I hope) that those extra strikes really do result in extra strikeouts and fewer walks. Lastly, I’ll discuss what this means for Steamer forecasts.

Modeling the Strike Zone

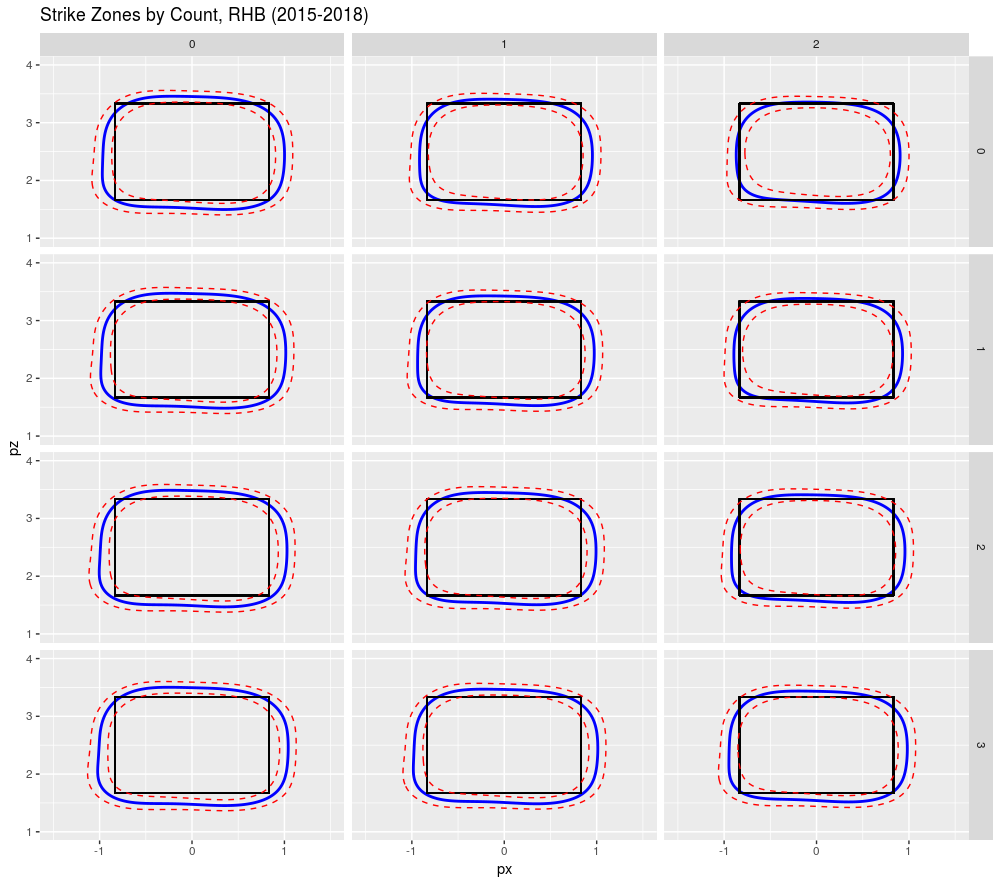
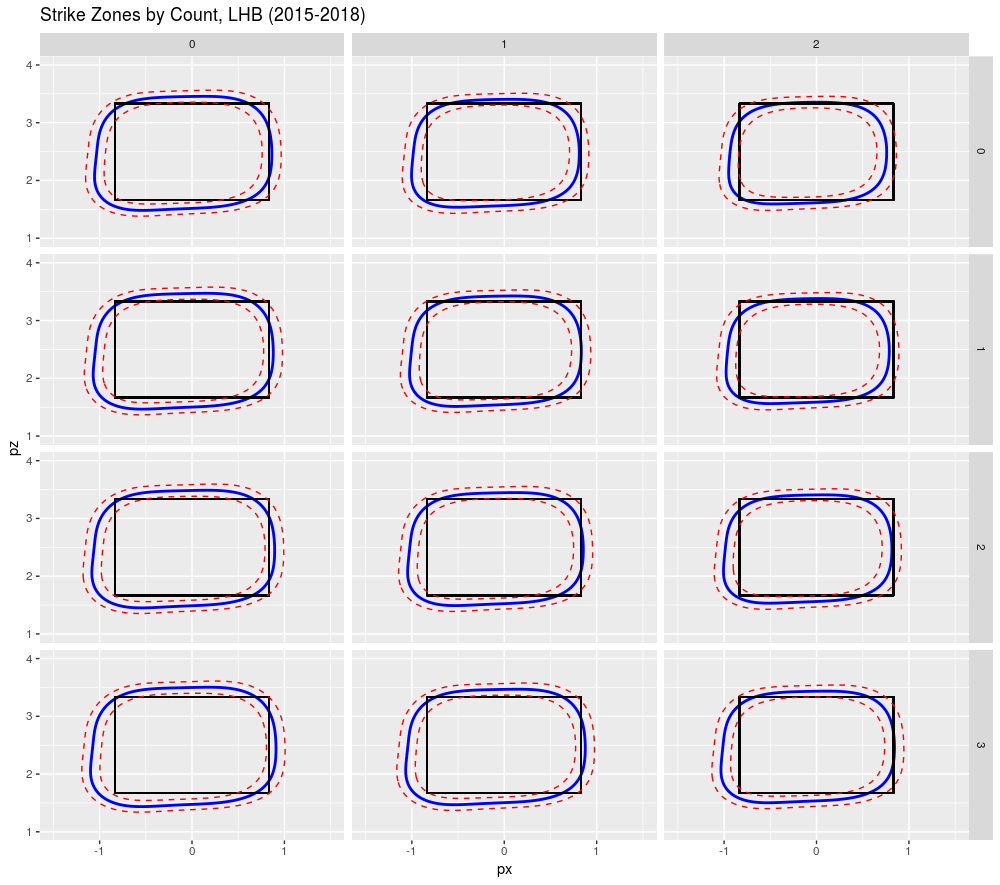
It all starts with the strike zone and I started by using generalized additive models to estimate the probability of a strike in any count, to either left-handed or right-handed batters at each location in and around the plate. On the first pass (shown below), I created strike zones averaged across seasons and, on the second pass, looked for changes in the strike zone by season. The blue contour lines in the images below show where strike calls are a coin flip and the red dashed lines show where we’d expect a 25% or 75% chance of a strike. If you’re read Matt Carruth or Jon Roegele, you’ll be unsurprised to see a small 0-2 strike zones (shown in the upper right facets) and large 3-0 strike zones (in the lower left).

Read the rest of this entry »


WAR Update: Catcher Framing!

Update: An earlier bug that impacted updated pitcher WAR has now been resolved. The pitcher tables below have been updated to reflect that. Thanks to everyone who pointed out the issue!

I’m very pleased to announce that FanGraphs has finally added catcher framing data to the site, with full thanks to Jared Cross, who you may know as the co-creator of the Steamer projections. We’ve also incorporated catcher framing into WAR.

Including catcher framing in WAR has been a topic of internal debate at FanGraphs for the past half-decade. The problem has never been with the inclusion of framing numbers on the catcher side of things. That’s a fairly simple addition. The problem has always been what to do with the pitchers. For instance, the 2011 Brewers were some 40 runs above average in catcher framing. When you add those 40 runs to catchers, do you subtract 40 runs from pitchers? As it turns out, you do, but those runs are not attributed equally to each pitcher:

2011 Brewers Starting Rotation
Player IP Catcher Framing Framing per 9
Randy Wolf 212.1 -0.45 -0.02
Yovani Gallardo 207.1 7.79 0.34
Shaun Marcum 200.2 7.47 0.34
Zack Greinke 171.2 5.95 0.31
Chris Narveson 161.2 5.12 0.29
Positive framing numbers for pitchers indicate a pitcher was helped by the catcher’s framing ability; negative numbers indicate a pitcher was hindered by the catcher’s framing ability.

While most of the pitchers on the 2011 Brewers benefited from Jonathan Lucroy’s otherworldly framing, Randy Wolf was stuck with George Kottaras most of the time. In this instance, the entire Brewers pitching staff, with the exception of Randy Wolf, was a little bit worse once catcher framing is taken into account than their previous, non-catcher framing inclusive WAR would indicate.

Exactly how do you add catcher framing to WAR you ask?

For catchers, you take the catcher framing runs above average, divide by the runs to wins converter, and add it to your existing WAR total.

WAR = (Batting + Base Running + Fielding + Catcher Framing + Replacement Level) / Runs to Wins

On the pitcher side, we adjust FIP by the catcher framing runs above average per 9 innings. If Zack Greinke’s 2011 FIP was 3.00, and he was helped to the extent of 0.31 framing runs per 9 innings, we now use 3.31 in the WAR calculation instead of the original 3.00 FIP. We also adjust the pitcher’s dynamic runs to wins converter. In Greinke’s case, this would increase his personal run environment and also increase the runs to wins converter.

WAR = (((League FIP – (FIP + Catcher Framing / 9)) / Dynamic Runs to Wins Converter + Replacement Level) * IP / 9) * Game Start Leverage / 2

The RA9-WAR calculation has been adjusted in the exact same way.

Let’s take a look at how the inclusion of catcher framing has changed things:

Largest Career WAR Increases (2008 – 2018)
Player Catcher Framing Old WAR New WAR Difference
Brian McCann 181.9 30.4 49.2 18.8
Russell Martin 165.6 29.5 46.7 17.2
Yadier Molina 151.6 34.8 50.5 15.7
Jose Molina 140.4 0.6 15.2 14.6
Jonathan Lucroy 126.8 22.6 36.2 13.6
Miguel Montero 127.0 15.6 28.9 13.3
Yasmani Grandal 119.6 15.1 27.6 12.5
Buster Posey 118.0 38.7 51.1 12.4
Tyler Flowers 89.4 8.6 17.8 9.2
David Ross 80.7 10.0 18.3 8.4
Ryan Hanigan 79.2 8.8 17.1 8.3
Martin Maldonado 69.2 4.6 11.7 7.2
Jeff Mathis 69.1 -1.1 6.0 7.1
Chris Stewart 66.2 2.9 10.0 7.1
Mike Zunino 49.5 7.7 13.0 5.3
Hank Conger 48.1 1.7 6.9 5.2
Rene Rivera 48.1 3.9 9.1 5.1
Largest Career WAR Decreases (2008 – 2018)
Player Catcher Framing Old WAR New WAR Difference
Ryan Doumit -156.6 5.7 -10.4 -16.1
Gerald Laird -109.1 4.0 -7.2 -11.2
Nick Hundley -90.7 11.3 1.9 -9.4
Chris Iannetta -89.5 17.7 8.3 -9.3
Kurt Suzuki -86.1 18.1 9.0 -9.1
Carlos Santana -78.6 14.7 6.4 -8.3
Salvador Perez -79.9 17.8 9.5 -8.3
A.J. Ellis -77.1 8.2 0.1 -8.1
Carlos Ruiz -68.9 21.2 14.0 -7.3
Dioner Navarro -65.4 5.6 -1.2 -6.8
Lou Marson -57.6 2.5 -3.5 -6.0
Welington Castillo -52.1 13.2 7.6 -5.6
John Buck -52.4 7.2 1.7 -5.6
John Jaso -51.9 8.0 2.5 -5.5
Rob Johnson -48.4 -1.5 -6.5 -5.0
Robinson Chirinos -47.7 8.3 3.4 -5.0
Largest Single Season WAR Increases (2008 – 2018)
Player Season Catcher Framing Old WAR New WAR Difference
Jonathan Lucroy 2011 42.4 1.4 5.9 4.5
Brian McCann 2008 37.5 5.1 8.9 3.7
Brian McCann 2011 34.1 3.8 7.4 3.6
Jonathan Lucroy 2013 31.8 3.4 6.8 3.4
Jonathan Lucroy 2010 32.4 0.6 4.0 3.4
Jose Molina 2008 32.1 0.4 3.6 3.2
Tyler Flowers 2017 31.9 2.4 5.6 3.2
Brian McCann 2009 31.6 3.7 6.9 3.2
Jose Molina 2012 27.1 0.8 3.6 2.8
Buster Posey 2012 27.0 7.5 10.4 2.8
Yadier Molina 2010 27.2 2.2 5.1 2.8
Russell Martin 2011 26.6 2.5 5.3 2.8
Russell Martin 2008 28.1 4.8 7.6 2.8
Brian McCann 2012 26.4 1.5 4.2 2.8
Buster Posey 2016 26.7 3.8 6.5 2.7
Jonathan Lucroy 2012 26.1 3.4 6.2 2.7
Y Grandal 2016 25.7 2.8 5.5 2.6
Miguel Montero 2014 23.8 1.1 3.7 2.6
Hank Conger 2014 22.9 0.3 2.8 2.5
Mike Zunino 2014 22.8 1.7 4.2 2.5
Largest Single Season WAR Decreases (2008 – 2018)
Player Season Catcher Framing Old WAR New WAR Difference
Ryan Doumit 2008 -57.8 2.9 -2.8 -5.8
J Saltalamacchia 2014 -31.8 1.5 -2.0 -3.5
Gerald Laird 2009 -32.3 1.6 -1.6 -3.2
Carlos Santana 2011 -30.3 3.4 0.2 -3.2
Carlos Santana 2012 -27.6 3.0 0.1 -2.9
Chris Iannetta 2008 -26.6 3.1 0.5 -2.7
Jorge Posada 2010 -24.2 1.5 -1.0 -2.5
Kurt Suzuki 2014 -22.8 1.9 -0.6 -2.5
Ryan Doumit 2009 -24.6 0.6 -1.9 -2.5
Chris Iannetta 2013 -22.8 1.9 -0.5 -2.5
Dioner Navarro 2014 -22.0 2.0 -0.4 -2.4
Gerald Laird 2008 -23.9 1.4 -1.0 -2.4
Ryan Doumit 2012 -22.2 1.0 -1.4 -2.3
Dioner Navarro 2008 -22.6 1.9 -0.3 -2.3
Miguel Olivo 2011 -21.2 0.2 -2.0 -2.2
Jonathan Lucroy 2017 -22.1 1.1 -1.1 -2.2
Lou Marson 2011 -20.4 1.0 -1.2 -2.2
Lou Marson 2010 -20.3 0.5 -1.6 -2.1
Rob Johnson 2009 -20.8 -0.1 -2.2 -2.1
Dioner Navarro 2016 -20.2 -0.2 -2.3 -2.1
Wilin Rosario 2012 -19.5 1.2 -0.8 -2.0
John Buck 2010 -19.1 2.8 0.8 -2.0
W Castillo 2013 -18.3 3.2 1.2 -2.0

And the Pitchers, where the differences are considerably smaller:

Largest Pitcher WAR Increases (2008 – 2018)
Player Framing Old War New War Difference
Felix Hernandez -23.3 42.7 45.4 2.7
Justin Masterson -20.7 14.2 16.4 2.2
Jason Vargas -21.0 12.9 15.0 2.1
Justin Verlander -17.6 57.0 59.0 2.0
Ricky Nolasco -12.4 23.6 25.0 1.4
Mike Pelfrey -13.6 11.8 13.2 1.4
Kevin Correia -12.3 5.5 6.8 1.2
Cole Hamels -11.1 41.4 42.6 1.2
Anibal Sanchez -11.7 25.7 27.0 1.2
Zach Duke -12.4 8.3 9.5 1.2
Ubaldo Jimenez -10.8 26.6 27.8 1.1
Ian Snell -11.9 1.6 2.7 1.1
Derek Holland -10.5 13.2 14.3 1.1
Danny Duffy -10.2 11.7 12.8 1.1
Luke Hochevar -10.1 8.0 9.1 1.0
Paul Maholm -10.2 11.4 12.4 1.0
Edwin Jackson -10.1 16.1 17.2 1.0
Jeff Karstens -9.6 3.2 4.2 1.0
Roberto Hernandez -9.7 4.2 5.1 1.0
Largest Pitcher WAR Decreases (2008 – 2018)
Player Framing Old War New War Difference
Yovani Gallardo 25.6 21.3 18.4 -2.9
Bronson Arroyo 28.6 8.9 6.1 -2.8
Madison Bumgarner 23.4 30.7 28.0 -2.7
Tim Hudson 24.5 14.5 12.0 -2.6
Kyle Lohse 21.7 14.9 12.6 -2.3
Adam Wainwright 18.6 35.3 33.2 -2.1
Jair Jurrjens 19.2 9.7 7.7 -2.0
Derek Lowe 19.0 12.4 10.5 -2.0
Ryan Vogelsong 18.4 5.8 3.9 -1.9
Tommy Hanson 17.2 9.5 7.6 -1.8
Johnny Cueto 16.9 29.5 27.7 -1.8
Marco Estrada 16.6 13.3 11.6 -1.7
Matt Cain 15.7 21.1 19.4 -1.7
Ian Kennedy 14.7 16.3 14.6 -1.6
CC Sabathia 14.7 40.3 38.7 -1.6
Zack Greinke 13.8 50.7 49.1 -1.6

Now you know everything there is to know about how we added catcher framing to WAR. Please note the following:

  • Catcher Framing (abbreviated as FRM) is available on the leaderboards and player pages in the fielding sections.
  • WAR has been updated with catcher framing data everywhere WAR is available on the site.
  • Catcher Framing data is available in batter and pitcher sections of the leaderboard as a custom stat.
  • Fielding (the WAR component) now includes Catcher Framing runs above average.
  • Steamer projections and depth chart projections both include projected catcher framing for catchers and pitchers.

We Added Minor League Level to THE BOARD!

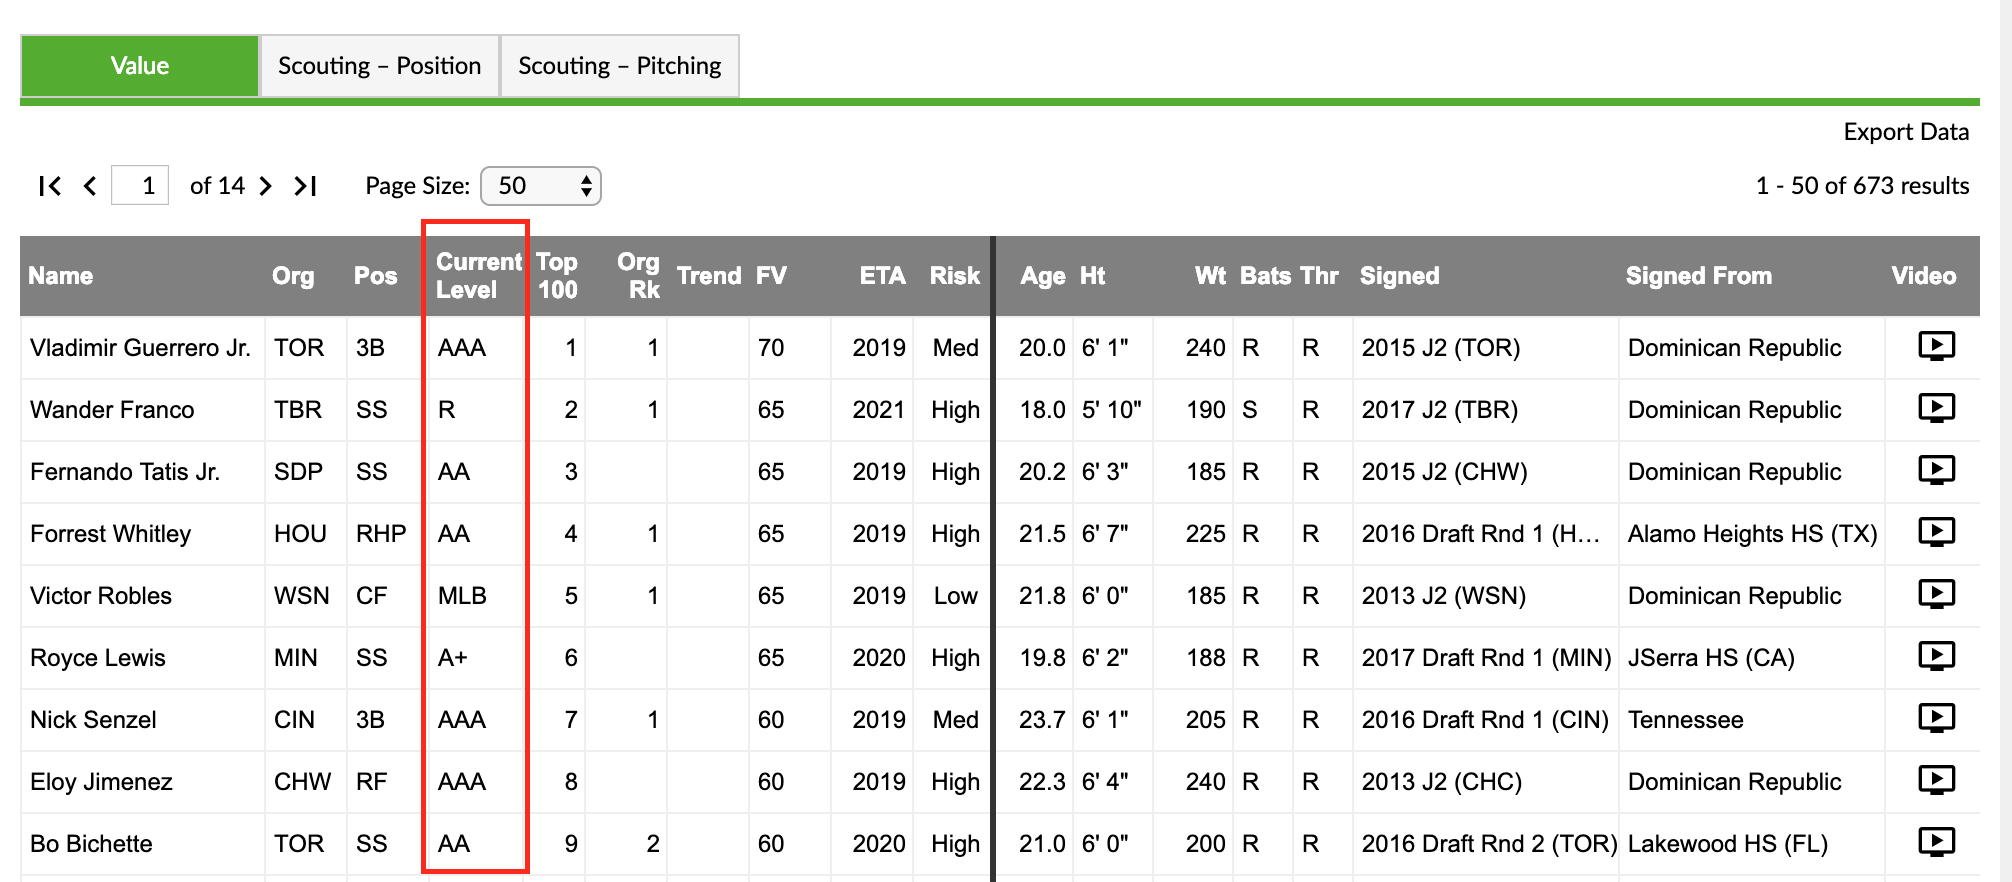
We’ve added a column on THE BOARD called “Current Level” displaying the most recent minor league level the prospect has played at or has been transacted to.

The process of programmatically determining a prospect’s current level is slightly less straight forward than it might seem. For example, Vladimir Guerrero Jr. is currently a Blue Jays non-roster invitee, so his Minor League Baseball stat page has him listed as Blue Jay, but he hasn’t played a MLB game.

To mitigate problems like this, we are using a combination of our game logs and MLB’s transaction list, along with some logic to determine the prospect’s level. Here’s the summary of the logic:

  • If the prospect hasn’t played in the majors, he cannot have the majors as his level.
  • We look at the most recent minor and major league games the player has played and find the game with the most recent date.
  • We look at the most recent transaction MLB has listed.
  • We compare the transaction and last game to determine which is more recent and use that for level, with consideration of the MLB debut.

This logic will prevent prospect non-roster invitees in Spring Training from displaying as being at the major league level. The transaction and game log approach will provide some robustness against any errant transaction data. Since this is programmatic, there isn’t any judgement on whether an assignment is temporary, like a rehab stint would be.

If you notice any errors, there could be a delay because the data processing runs overnight, but if it persists, please let us know.


Introducing Our New Contributing Writers

In January, we put out an open call for contributing writers. The response we received was overwhelming. Over 500 people submitted applications, and we are very grateful that so many smart, passionate baseball writers wanted to be a part of what we do here. It made for some really difficult decisions (and a rather long hiring process), but we are very excited to welcome six new contributors to our ranks.

A quick note to those who applied but weren’t hired: please keep writing. A number of people who have come to work for the site weren’t hired on their first go, but kept getting reps elsewhere on their way to making us regret having passed them by initially. Just because there wasn’t a home for you at FanGraphs this time around doesn’t mean that there won’t be one later, and in the meantime, public baseball analysis will be made better by your good words and good work.

And so, without further ado, allow me to briefly introduce the writers whose work will be debuting on these electronic pages soon.

Rachael McDaniel
Rachael has written at Baseball Prospectus, Vice Sports, and The Hardball Times, authoring work encompassing a whole range of baseball topics past and present. Rachael is currently in the creative writing program at the University of British Columbia in Vancouver, and following the conclusion of the academic year, will assume the role of managing editor of The Hardball Times in addition to writing at FanGraphs as a contributor.

Twitter handle: @rumhamlet

Devan Fink
Devan has spent the last two years as a featured writer at Beyond the Box Score and the previous four years blogging for his own website, Cover Those Bases. He loves analyzing the latest current events and trends in baseball, ranging from the most minute aspects of the game to the largest, most impactful tendencies league-wide. Outside of baseball writing, Devan is currently a senior at James Madison High School, where he serves as an editor-in-chief of the school newspaper, The Hawk Talk, and as the captain of the debate team. He will be attending Dartmouth College next fall, where he plans to study quantitative social science. Devan resides in Northern Virginia with his parents, brother, and his four-year-old cockapoo, Ike.

Twitter handle: @DevanFink

Sung Min Kim
Originally a broadcast journalism student at Maryland, Sung Min took a sports writing class as a fun elective and went from there. Since his debut at The Hardball Times, he has been writing about the Yankees at River Avenue Blues. He has also written about Asian baseball for publications like VICE Sports, The Sporting News, Baseball Prospectus, and The Athletic. Sung Min will explore different aspects of Asian baseball while also writing about major league subjects.

Twitter handle: @sung_minkim

Ben Clemens
Cardinals fans may recognize Ben as a writer from Viva El Birdos. He always wanted to play baseball and be a famous writer growing up — he got ‘baseball’ and ‘writer’ at least, though he’s still working on ‘play’ and ‘famous.’ Working in financial markets made him interested in the decision-making and game theory aspects of baseball; he’s now answering the truly important questions, like whether Matt Carpenter should swing more on 3-0. He lives in New York but will soon be moving to San Francisco.

Twitter handle: @_Ben_Clemens

Audrey Stark
Audrey attended her first MLB game in June 2003 with her Girl Scout troop. While watching Albert Pujols through binoculars from an upper section of Busch Stadium II, she realized that baseball was the best sport on the planet. Audrey began writing for SBNation in 2016 at Beyond the Box Score; she has also contributed to Viva el Birdos and Federal Baseball. She has a degree in political science.

Twitter handle: @HighStarkSunday

Octavio Hernandez
Once a beat writer in the Venezuelan Winter League before becoming the assistant GM for Leones del Caracas in that same league, Octavio currently works for Diablos Rojos del Mexico as the chief of the Advanced Metrics department. Now he’ll return to his roots as a writer, focusing on Latin American major league players along with providing some insight into what’s going on in the Mexican League and the Caribbean Winter Leagues. He is a man with a mission: to help Latin American baseball get on board with advanced metrics. He hopes you will join him on his ride.

Twitter handler: @octaviolider

You’ll begin to see work from these six writers appearing at FanGraphs soon. We hope you’re as excited for them to get going as we are.

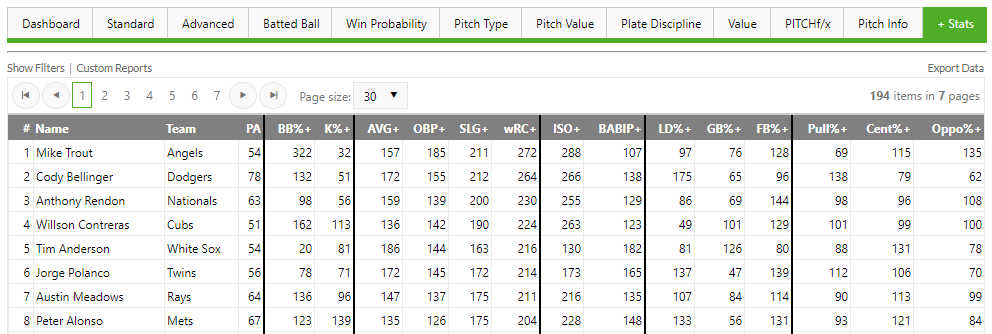
Why Not Both? THE BOARD: Scouting + Stats!

We decided to make a leaderboard that combines THE BOARD! with our Minor League Leaderboards. There are a ton of new features to review, but if you are the type of person that attempts to assemble furniture without reading the instructions, here’s the link:

https://www.fangraphs.com/prospects/the-board-scouting-and-stats

If you are still with us, we have a lot to cover. This combined leaderboard is similar to a feature we tested on our prospects landing page where the prospect list that Eric and Kiley have compiled is joined with our minor league stats.

Here’s a list of the new features:

  • THE BOARD: Scouting + Stats!
  • Revamped Minor League Leaderboards
    • Added the ability to select multiple seasons
    • Added the ability to filter by organization
    • Added three new league filters: Upper (AAA/AA), Mid (A+/A), and Low Levels (A-/R)
  • Revamped Custom Reports
    • Your custom reports can be displayed as a tab (blue instead of green) on the leaderboard.
    • The interface to add and change stat columns is all-new.
    • You can choose to include row numbers in your report.

THE BOARD: Scouting + Stats!

You can think of the combined leaderboard as a Venn diagram or a SQL inner join. Minor league players who are not in the selected prospect list will not appear on the combined leaderboards. Likewise, players without any minor league stats (Shohei Ohtani) are not available on this leaderboard.

Unforunately, you also can’t mix batting and pitching stats on the same leaderboard; these are still different data sets (pictured in the above data join diagram). The scouting report data is position agnostic, but the stats data still behaves like our traditional leaderboards, so you can only combined one stat data set with the scouting data set.

The filters are organized by the source of data they control. For example, scouting grade filters are on the scouting tab, while the playing time filter appears on the stats tab.

Since there is the possibility of duplicate filters for position and organization, we have those two filters located under common filters. Both filters use data from the scouting data set, so you could look at the stats of a traded prospect regardless of what system he accrued those stats. The position filter uses Eric and Kiley’s classification, instead of what position our leaderboards have for a player. This might change in the future if we deploy more advanced control options.

Important Notes:

  • A leaderboard can only contain either batting or pitching stats.
  • Right now, we are only including scouting information from prospect lists. There are plans to include draft and international players in the future.

Minor League Leaderboards

The Minor League Leaderboards have been redesigned, and we added a few new features. We added the ability to select multiple seasons and either aggregate them (default option) or have them split into multiple years. The “Split Seasons” option splits the player’s stat line by both season and team. An organization filter has been added so you can group stats across levels by the MLB organization instead of just being able to filter using the affiliate teams. We also included a few new league filters that groups tiers of levels: Upper (AAA/AA), Mid (A+/A), and Low Levels (A-/R). These will allow you to aggregate stats across those tiers.

We don’t always carry legacy tools, but we are keeping the old minor league boards around at least for a bit. These will be available in the leaders menu, but they won’t be the main link. You should be aware these might not always exist, and we are not going to continue developing them. If you are using them as a data source for research, please considering migrating to the new Minor League Leaderboards.

Custom Reports

The Custom Reports for the combined leaderboard and the Minor League Leaderboards are all-new. While FanGraphs has well-established stat groups: Standard, Advanced, and Batted Ball, combining scouting and stats data left us with too many combinations to include everything; this is where the new custom reports come in.

Like the old custom reports you are able to create a leaderboard with your choice of stat columns, filters, and players, but now they can be displayed as blue tabs on the leaderboard for quicker access. You can create a new report by clicking the plus button.

All of your reports for the specific leaderboard are housed in the Custom Reports dialog box accessible from the Custom Reports button on the data grid. In that dialog box, you can manage your reports including loading them into the tab bar and making them load in to the tab bar by default.

The interface to change the stat columns on the table is also completely new. You can either double click (long press on mobile) or drag/drop stats to customize your report. The columns are organized by the default tab they appear in. Once again, you can’t mix batting and pitching stats, but mixing scouting columns is cool.

Important notes:

  • Each report has an owner.
  • The owner is the only one who can modify, save, or delete that report.
  • You also must be signed into your FanGraphs account to modify, save, or delete any report.
  • However, every report is viewable by anyone if you have the URL with the report id in it.
  • You can create a copy of a report by viewing it and clicking to create a new report.
  • “Edit Table” allows you to choose different columns on the table.
  • Turning off the “Include Filters” button allows you to create a report that is agnostic to filters including custom players. This can be used if you want to create a tab with certain stats acting like native tabs.
  • Your older minor league reports are still available, though you won’t be able to save them.

Future Notes

  • We are in the process of determining how to handle the “current” level for prospects. It’s an addition we want to add to THE BOARD, but it’s not ready for this update.
  • While these tools are conceptually connected, they don’t share data between them, so going from the Minor League Leaderboards to THE BOARD: Scouting + Stats! won’t retain settings and filters.
  • Custom Reports “belong” to the tool you created them in, so you can’t make one in the leaderboards and use it with the combined leaderboard. This might change in the future, but it’s a restriction for now.

FanGraphs is Hiring! Seeking Site Contributors

Update: The submission deadline for applications has been extended to Friday, February 8.

As the 2019 season approaches, I’m pleased to announce that FanGraphs is now accepting applications to join our staff as a contributing writer.

Contributors typically write three times a week. Familiarity and comfort with the data here on FanGraphs is a requirement, but just as importantly, we’re looking for writers who can generate their own ideas and questions while providing interesting analysis or commentary on the game of baseball. From free agent signings to statistical analysis, teams’ top prospects to in-game strategy, we endeavor to cover it all, highlights to lowlights. Sometimes we do that with a bit of silliness; other times, we’re more serious. But what all of our work has in common is a commitment to asking interesting questions and using rigor, creativity, and the latest analytical tools to find the answers for our readers.

This is a part-time, paid position. Prior writing experience is strongly preferred, though the bulk of that experience doesn’t necessarily have to be of the baseball variety. We know baseball analysis is more interesting and complete when diverse perspectives and voices are brought to bear on the questions and trends in today’s game, and encourage writers of all backgrounds and identities to apply. When applying, please include samples or links to work you’ve published previously, or some new, original content you feel best demonstrates your writing abilities and interests. You may also include a resume, but it is not required for the initial application. Please send us an email at wanted@fangraphs.com with your application materials, using the subject line “FanGraphs Writer Application – 2019.” The subject line is important, as it helps us keep all of the applications organized and ensures that yours does not slip through the cracks.

If for some reason you are unable to submit your application using the wanted@fangraphs.com e-mail address, simply fill out a contact form with the same subject (“FanGraphs Writer Application – 2019”), and you will be provided an alternate e-mail address for submission.

However you send us your application, please do so by Friday, February 8.

If you feel like you’d be a good fit as a contributing writer for FanGraphs, please drop us a line. We cannot promise to respond to every application we receive, but we’ll make sure every applicant receives serious consideration.

We look forward to hearing from you.


2019 SABR Analytics Awards: Voting Now Open!

Here’s your chance to vote for the 2019 SABR Analytics Conference Research Award winners.

The SABR Analytics Conference Research Awards will recognize baseball researchers who have completed the best work of original analysis or commentary during the preceding calendar year. Nominations were solicited by representatives from SABR, Baseball Prospectus, FanGraphs, The Hardball Times, and Beyond the Box Score.

To read any of the finalists, click on the link below. Scroll down to cast your vote.

Contemporary Baseball Analysis

Contemporary Baseball Commentary

Historical Analysis/Commentary

Voting will be open through 11:59 p.m. MST on Monday, February 11, 2019. Details and criteria for each category can be found here. Only one work per author was considered as a finalist.


Create your own user feedback survey

Mobile or Safari users, click here to access the survey


Results will be announced and presented at the eighth annual SABR Analytics Conference, March 8-10, 2019, at the Hyatt Regency Phoenix in Phoenix, Arizona. Learn more or register for the conference at SABR.org/analytics.


2019 FAN Projections!

The 2019 FAN Projection ballots are now open!

Before you can project any players, you’ll have to select the team you follow most closely towards the top of the screen. If you don’t really follow a team, just pick one. You’ll only have to do this once.

After you’ve selected a team, you can begin projecting players. There are nine categories of interest for pitchers and 10 categories for position players. Pick the values in the drop-down boxes closest to what you think the player will do in 2018. Hit the submit button and you’re done! If you made a mistake, you can always go back and change your selection at any time.

Please note that everything is a rate stat. You’re projecting 2B+3B, HR, SB, and Fielding as a measure of 150 games (basically a full season). The player’s previous stats are shown per 150 games in the projection ballot, too. This will make changing playing-time projections much easier, as you’ll only have to change the games played portion.

That’s really all there is to it. You can filter players by team or, if you go to the player pages, you can project players individually. If you want to see all the players you’ve projected, you can click on the “My Rankings” button, which will show you only what you specifically projected a player to do.

FAN Projections will appear on a player’s page after five ballots have been submitted for him.

If you do notice any issues, please let us know.


We Upgraded Our Site’s Search Bar

At last week’s Winter Meetings, we redesigned our search bar functionality, and we are launching it today. The search bar location and the main function haven’t changed. The search bar is in the same place, and by default has the most-viewed players. It allows you to search players and blog articles. We did a pretty significant under-the-hood update that returns more relevant results, and while we were at it, we made some interface updates.

If you are interested in the details:

  • Players results are weighted by a combination of name match and the number of recent views.
  • Active players are in bold. The partial match of a search term is also underlined the player’s name.
  • Articles can be searched in a separate window. They are weighted by term matching, number of views, and recency.
  • For now, we’ve only included main page articles, not articles from all of our the blogs. The other blogs will be added in the future.
  • We included Team Pages in the results!
  • The search is also available as a full page: fangraphs.com/tools/search

We’re Relaunching the Community Blog

If you have ever wanted your writing to appear on the pages of FanGraphs, do we have good news for you!

After a brief hiatus, we are relaunching the Community Research page, a blog that features articles from our readers. This means you, your friends, your grandma, basically anyone with a (free) FanGraphs account can submit some baseball words to be run here on the site.

There are a few rules, of course. There are always rules:

  • Every article is subject to approval. While submitted works represent a range of topics and exhibit varying degrees of polish, they do need to be appropriate, and meet a baseline of readability and relevance.
  • Your submission must be your original work. Please only send us pieces that you have written.
  • That said, your article does not necessarily have to be exclusive to FanGraphs. Have a piece from your own blog that you think would fit well here? Send it on over for approval. Just let us know where else it has appeared.
  • You may submit a maximum of one article per week. We’d love to run every worthy article we receive, but realistically, we can’t. We appreciate your understanding.

That’s about it. If you have submitted pieces in recent months while the blog was on hiatus that did not run, and you still feel they are relevant, feel free to submit them again. We are starting with a fresh slate of submissions going forward.

If you don’t have a FanGraphs account (seriously, it’s free), you can register here.

Once you have an account, you can submit a post here.

We’re looking forward to sharing your research.