Welcome to another edition of Five Things I Liked (Or Didn’t Like) This Week. By now, you surely know the drill. I credit basketball genius Zach Lowe for creating the format I’m using, make a few jokes about how much baseball I get to watch to write this column, and then give you a preview of what you can read about below. This week’s no exception! I get to watch a ton of baseball, and this week I watched a lot of birds and a lot of bunts. I also watched a lot of the Pirates, just like I do every week. Let’s get right into it.
1. Reversals of Reversals of Fortune
For most of the 21st century, no one would bat an eye if you told them the Cardinals swept the Orioles. The Cards have been good pretty much forever, and the O’s went through a long dry period. But starting last year, things have changed. The Orioles last got swept in early 2022, and they’ve been one of the best teams in baseball since then. The Cardinals fell on tough times after 2022’s Molina/Pujols swan song season. Coming into their series this week, the O’s had the second-best record in the AL, while the Cardinals languished near the bottom of the NL at 20-26. Read the rest of this entry »
Amid all the (mostly Gunnar Henderson-related, as I understand it) Orioles hoopla, John Means has a chance to do something unusual in his start later today against the Cardinals. Means is the only starting pitcher this season to make it through his first three outings without walking a batter.
That might not sound like much to all you folks who walked barefoot in the snow — uphill, both ways — to see Christy Mathewson shut out the Louisville Trench Foots every three days, way back when. But it’s pretty impressive by modern standards. Only four other starters — Mitchell Parker, Sonny Gray, Corbin Burnes, and Shota Imanaga — even made it through their first two starts without giving up a free pass in 2024. And if Means continues according to form this afternoon, he’ll join a surprisingly small group of pitchers. Read the rest of this entry »
During spring training, I asked 10 current big leaguers how they followed the game growing up, and how that has changed since they began playing professionally. As expected, all of them noted significant differences. No longer fans following their favorite teams and players, they consume baseball in a distinctly different way, even as the mediums through which they take in the game remain much the same.
Following up on that March 8 piece, I asked a new subset of baseball professionals much the same question. Four are former players who are now managing, while two are former players who are now broadcast analysts. In each case, how they consume the game has evolved not once, but twice.
Here is what they had to say. Their answers have been edited and condensed for clarity.
“For me, it’s always been similar. That maybe sounds funny, but whether it was as a fan, player, coach, or manager, I’ve always been interested in the strategy of the game. Being a catcher, you kind of look at a game that way naturally. What most fans want to see is their favorite players — you want them to hit home runs, things like that — and then as a manager, you’re always wondering what strings another manager might pull, or at least try to pull. So, it’s similar for me, but at the same time obviously a little different. Read the rest of this entry »
Welcome to another edition of Five Things I Liked (Or Didn’t Like) This Week. After taking a week off to recharge and travel, I was itching to watch some baseball this week, and the sport delivered. After spending last week in New York, I had the city on my mind, and the Mets delivered with some exciting series against the Braves and Phillies. There was good rivalry action out west, too, with the Dodgers and Giants squaring off. And of course, there’s that classic rivalry, Tommy Pham against the concept of ever taking a single play off. As always, thanks to Zach Lowe for the inspiration for this series. Let’s get right into it.
1. Max Effort Every Time
Tommy Pham is my favorite baseball player. To be clear, I don’t think he’s the best baseball player. I’m not sure that I, personally, would want him as a teammate, even. He’s too intense for my laid back view of the world. But his maniacal drive is absolutely delightful to watch, and it’s particularly delightful now that he’s on a team that is absolutely not competing for a playoff spot this year. Read the rest of this entry »
Welcome back to Top of the Order, where every Tuesday and Friday I’ll be starting your baseball day with some news, notes, and thoughts about the game we love.
When I think about openers, I think about Ryne Stanek. His statistics as a Ray in 2018 and 2019 were comical: Before he was traded to the Marlins in 2019, he made 100 appearances over those two seasons; 59 of them were “starts.” In those opening appearances, he never threw more than 37 pitches, recorded more than six outs, or faced more than nine hitters. But since leaving the Rays, despite appearing in 234 games, he’s pitched for more teams (three) than he’s made starts (zero). In fact, he’s averaging less than one inning per appearance.
I searched my brain to figure out who is today’s version of Stanek circa 2018-19, only to realize that there isn’t one. I turned to Stathead and confirmed my inkling: The opener has gone by the wayside in 2024.
In my query, I set a couple of filters as guardrails. First, I limited my search to pitchers who were on, at most, three days of rest. That way, I could eliminate the true starters who got hurt or blitzed out of games from this sample. I also capped the number of batters faced at nine. Facing the leadoff man twice goes against the spirit of the opener, where the aim is to prevent batters from seeing any one pitcher too many times.
Openers Used by Season
Season
Openers Used
2024
9
2023
154
2022
80
2021
84
2020
34
2019
165
2018
91
2017
2
SOURCE: Baseball Reference
It doesn’t take a math degree to know that nine is far fewer than 154. But it’s not quite that simple. Remember, we’re only a quarter of the way through the season, and there will almost certainly be more openers used the rest of the way. That said, baseball is on pace to use 33 openers in 2024, which would be the fewest since the opener was first utilized in 2018 — yes, that includes the shortened 2020 campaign. It’s worth noting that only 12 openers were used at this point in 2023, so we could see opener usage ramp up as this season progresses, too. Even so, it’s clear that something has changed.
I don’t really have a take on whether or not the opener is a good strategy in today’s game. I also don’t think there’s an obvious explanation for why the fall of the opener is happening. Some of it may just be circumstance. Gabe Kapler’s Giants frequently used openers, and he’s no longer managing. The 2018-19 Rays had Blake Snell and Charlie Morton, but they also had plenty of pitchers who were best deployed in short outings. This season, the Rays feature a deeper group of pitchers who are capable of carrying a starter’s workload. Five years ago, Tampa Bay turned to openers out of necessity; now, that’s no longer necessary.
What To Look Forward to This Weekend
• The Mariners have played great baseball of late, winning eight of their last nine series, bringing their record to 24-20, and entering play Friday in first place in the AL West. But they’ve got a big test coming up, with three games in Baltimore followed by three games in the Bronx, two exciting series that will give the Mariners ample opportunity to show the league they’re for real. George Kirby and Corbin Burnes face off in a marquee pitching matchup on Sunday.
• The Rockies are looking to extend their winning streak that currently sits at seven games, beginning tonight in San Francisco. Colorado started out its streak last week with a win against the Giants, scoring seven runs off Keaton Winn, who is set to start for the Giants on Sunday. Whether or not the Rockies will be riding a nine-game streak at that point will depend on San Francisco starters Kyle Harrison and Jordan Hicks, as well as a piecemeal Giants lineup that’s without Patrick Bailey, Michael Conforto, Jung Hoo Lee, and Jorge Soler.
• Although they’re still the league’s worst team, the White Sox have played less embarrassingly of late, going 8-4 over their last 12 games. This weekend, though, they head to the Bronx to face the first-place Yankees. Led by a ridiculously hot Aaron Judge, New York has won four straight games and 10 of its last 12. During the Yankees’ three-game sweep of the Twins in Minnesota, Judge went 7-for-11 (.636) with five doubles and two home runs. On the season, he’s slashing .262/.393/.555 with 11 homers and a 169 wRC+, which is remarkable considering how much he struggled in April.
Lastly, a quick programming note. Beginning next week, we’ll be shifting Top of the Order to a twice-weekly schedule, running on Tuesday and Friday mornings. See you then!
Despite a strong late-winter effort to beef up their roster by adding big-name free agents Jorge Soler, Matt Chapman, and Blake Snell in February and March, the Giants have stumbled out of the gate. They haven’t even been at .500 since March 31, when they were 2-2, and now they’re 19-24 and in the midst of an unrelenting wave of injuries that has thinned their roster. The most serious is that of Jung Hoo Lee, who dislocated his left shoulder trying to make a run-saving catch in Sunday’s win over the Reds and could be out for several weeks, or even months.
The play occurred in the top of the first inning at Oracle Park, after the Reds loaded the bases against starter Kyle Harrison on a hit-by-pitch, two steals, a throwing error, and a walk. With two outs, Jeimer Candelario hit a high 104-mph drive to deep center field. At the warning track, Lee leaped for the ball, but it bounced off the padding on top of the wall instead of hitting his glove. On his way down, he smacked his left forearm into the padding; his elbow and then his back both hit the chain link fence (!) below the padding, jamming his left shoulder. He went down hard as all three runners scored, and after several minutes on the ground, left the game accompanied by head athletic trainer Dave Groeschner, who held Lee’s arm in place.
Though manager Bob Melvin initially indicated that the 25-year-old center fielder had separated his shoulder, the Giants later clarified that he had dislocated it, indicating a more serious injury. Lee underwent an MRI on Monday, but a more detailed prognosis won’t be known until at least Tuesday after he and the Giants consult with Dr. Ken Akizuki, the team’s orthopedic surgeon. The Giants are hopeful that Lee won’t need surgery, unlike Red Sox shortstop Trevor Story, who on April 5 dislocated his left shoulder while diving for a ball and additionally suffered a fracture of the glenoid rim, an injury that required season-ending surgery. There’s been no report of a fracture yet for Lee, but soft-tissue damage could be another matter.
[Update: Indeed, on Tuesday evening, the Giants confirmed that Lee has suffered structural damage in his shoulder. He will get a second opinion from Dr. Neal ElAttrache in Los Angeles on Thursday, indicating that surgery is a possibility.] Read the rest of this entry »
Keaton Winn is a rare big league pitcher, and not just because he’s the only one who grew up in Ollie, Iowa, with a population of 201 in the 2020 census. The 26-year-old San Francisco Giants right-hander’s primary pitch is a splitter, and by a significant margin. Through seven starts this season, Winn’s usage breakdown is 42.2% splitters, 23.3% four-seamers, 20.4% sinkers, and 14.1% sliders. No starter in baseball has thrown a higher percentage of splits this season.
With one notable exception, his atypical approach has yielded good results. Winn failed to get out of the first inning when he faced the Phillies in his most recent start, on May 4, but even with that turbulent outing — five runs in 2/3 frames — he has a respectable 4.41 ERA and a 3.97 FIP. In each of the three starts that preceded the debacle, he went six innings and allowed just one run. His next start is scheduled for this afternoon against the Rockies in Colorado, at 3:10 p.m. ET.
Winn’s mix was even more splitter heavy a year ago. He made his MLB debut last June and proceeded to throw his signature offering an eye-opening 55.1% of the time in 42 1/3 innings. It’s understandable that he would prioritize the pitch — last month, our prospect writers Eric Longenhagen and Travis Ice called Winn’s splitter “devastating… one of the nastier ones in pro ball” — even if such an approach is unprecedented among starters. San Francisco’s fifth-round pick in the 2017 draft out of Iowa Western Community College is anything but ordinary in the way he attacks hitters.
Winn discussed his splitter when the Giants played the Red Sox at Fenway Park earlier this month.
———
David Laurila: Let’s start with your full repertoire. What was it at the time you signed your first professional contract, and what is it now?
Keaton Winn: “When I signed it was four-seam, curveball, slider, and I maybe threw like five sinkers. No changeup. Now it is four-seamer, sinker, splitter, slider.”
Laurila: You obviously throw a ton of splitters. Given how much you rely on it, would it be fair to say that you’re probably not in the big leagues right now had you never developed a splitter?
Winn: “Yeah. That’s definitely crossed my mind before. I mean, I think I ultimately could have competed to get a role, but having the splitter made it so much easier.”
Welcome back to Top of the Order, where every Monday, Wednesday, and Friday, I’ll be starting your baseball day with some news, notes, and thoughts about the game we love.
I don’t love to evaluate teams just by watching them and feeling the vibes, but in deciding what to write about for this morning, I kept coming back to the feeling that the Giants have played a lot of ugly, soulless, lopsided losses. They’re not horrible overall, but they definitely haven’t been good, which puts them in a purgatory of sorts. Fortunately, we’ve got have a good encapsulation in statistical form to prove how disappointing they’ve been. Connor Grossman, a former Sports Illustrated baseball editor who writes “Giants Postcards” on Substack, noted something interesting in Tuesday’s newsletter: That the Giants are 1-20 in games when they give up four or more runs.
I hopped over to Stathead to get a look at how San Francisco compared to other teams in such games, and it’s certainly not a pretty picture. Entering play Tuesday, only seven teams have allowed at least four runs in a game more often than the Giants, and no other team has performed worse when they do. To be clear, these are hard games to win; only the Orioles are breaking even in such games, and the league as a whole is a ghastly 143-425, winning just over 25% of the time. But the Giants’ pitifulness in these situations is setting them further back than any other team; the lowly Marlins, Angels, White Sox, and Rockies are the only other teams with at least 20 losses when they allow more than three runs in a game, but they’ve won more than one of those games. The Giants, of course, had visions of contending this season. Instead, it looks like whatever they were seeing was a mirage.
Here’s the thing: It’s true that the San Francisco offense isn’t good, but it really isn’t bottom of the barrel, either. The problem isn’t so much that the Giants can’t score; it’s that they just can’t score enough runs when they need them. They are scoring 4.8 runs per game when their pitchers give up three or fewer runs, but they are averaging a putrid 2.9 runs in the games when they allow at least four.
San Francisco’s lineup, as it has been for the entirety of the Farhan Zaidi era, was constructed to have the whole be greater than the sum of its parts, even with the additions of everyday bats Matt Chapman, Jung Hoo Lee, and Jorge Soler. Sure, these aren’t Gabe Kapler’s Giants with platoons seemingly all over the diamond, but the team still uses tandems at first base (LaMonte Wade Jr. and Wilmer Flores) and right field (Mike Yastrzemski and Austin Slater). This strategy could have worked, except Flores and Slater aren’t pulling their weight against lefties and the three new guys have all been somewhere between underwhelming and bad. That puts a lot of pressure on the pitchers to be perfect, and this rotation sure isn’t that, even with Logan Webb.
As if to provide further support that they can score, but only when they get good pitching, the Giants beat the Rockies on Tuesday night, 5-0. They’re now 15-1 in games when their pitchers allow no more than three runs.
Rhys Lightning Is Sparking With the Brewers
After missing all of last year recovering from ACL surgery, Rhys Hoskins signed a two-year, $34 million contract with the Brewers that affords him the opportunity to opt out at the end of this season. It’s too early to tell if he’ll decide to test free agency again this offseason, but so far, he’s fared quite well in his new digs.
Over 33 games, Hoskins is batting .218/.324/.437 (118 wRC+), down from his Phillies norm of .242/.353/.492 (126 wRC+) but still solid. Considering he just came back from a serious knee injury, it’s not surprising that he isn’t running well, both by the eye test and the statistics (his sprint speed is down 0.4 feet per second), or that he’s required more maintenance (15 DH days to 18 games at first base), but at the plate he’s been about as good as Milwaukee could’ve hoped.
Hoskins is a far more selective hitter this season, with a swing rate under 40% for the first time since 2019, and his 20.8% chase rate is the lowest it’s been since 2018, his first full year in the big leagues, according to Statcast. More interesting, though, is what happens when he actually does pull the trigger: He’s running the lowest in-zone contact rate of his career, yet he’s connecting more often than ever on pitches out of the zone. His 68.3% contact rate on pitches outside the zone is over six points above his previous career high and a staggering 10 points higher than it was in 2022.
While “hit fewer pitches inside the zone and make more contact outside of it” doesn’t seem like a sound strategy, it hasn’t affected Hoskins’ underlying numbers and may counterintuitively be helping them. The righty thumper’s xSLG and xwOBA are both markedly improved from 2022 and much more in line with his stronger 2021, and he’s also hitting fewer groundballs than at any point in his career. That’s important because the Brewers signed him to slug, not to try and beat out infield singles, and so far, slug is what he’s done. In Tuesday’s 6-5 win over the Royals, Hoskins hit his seventh home run over the season, tied for the most on the team.
Quick Hits
• The Cubs’ streak of scoreless starts ended on Tuesday when Craig Counsell extended Shota Imanaga to the eighth inning, only to watch him give up a two-run homer to Jurickson Profar that gave the Padres the lead. The Cubs came back and won, 3-2, on a Michael Busch walk-off home run to maintain their virtual tie with Milwaukee atop the NL Central.
• The Yankees pounded Justin Verlander for seven runs in their 10-3 win over the Astros on Tuesday. The highlight came when Giancarlo Stanton led off the fifth inning with a 118.8 mph home run; that’s the hardest ball hit off Verlander since at least 2015, when Statcast started measuring exit velocity.
Kyle Harrison was pitching for the Double-A Richmond Flying Squirrels when he was first featured here at FanGraphs in August 2022. Then a fast-rising prospect in the San Francisco Giants system, the now-22-year-old southpaw had broken down the early evolution of his arsenal for me prior to a game at Portland, Maine’s Hadlock Field. Fast forward to this past week, and we were reacquainting at a far-more-fabled venue. Harrison was preparing to take the mound at Fenway Park for his 14th big-league start, his seventh this season.
As I’m wont to do in such scenarios, I asked the dark-horse rookie-of-the-year candidate what’s changed since our 20-months-ago conversation. Not surprisingly, he’s continued to evolve.
“I’ve added a cutter, although I haven’t thrown it as much as I’d like to,” Harrison told me. “Other than that, it’s the same pitches. The slider has been feeling great, and the changeup is something that’s really come along for me; it’s a pitch I’ve been relying on a lot. I really hadn’t thrown it that much in the minors — it felt like I didn’t really have the control for it — but then all of a sudden it clicked. Now I’ve got three weapons, plus the cutter.”
Including his Thursday effort in Boston, Harrison has thrown his new cutter — Baseball Savant categorizes it as a slider — just six times all season. Which brings us to his other breaking ball. When we’d talked in Portland, the lefty called the pitch a sweepy slider. Savant categorizes it as a slurve.
Roughly a month’s worth of the 2024 season is now in the books. The American League East looks great. The Brewers and Guardians are standing up for the Central divisions. The White Sox can only beat the Rays, and the Astros somehow can’t beat anyone. Enough time has passed that I feel confident saying all of those things. On the other hand, it still feels too early to be certain about which players are over- or under-performing. But that doesn’t mean our opinions can’t change a bit. There’s enough data to make some educated guesses, so let’s put on our speculation caps. Here are four players — two hitters and two pitchers — who have risen in my estimation over the last few weeks. Tomorrow, I’ll follow up with four players who have gone the other way.
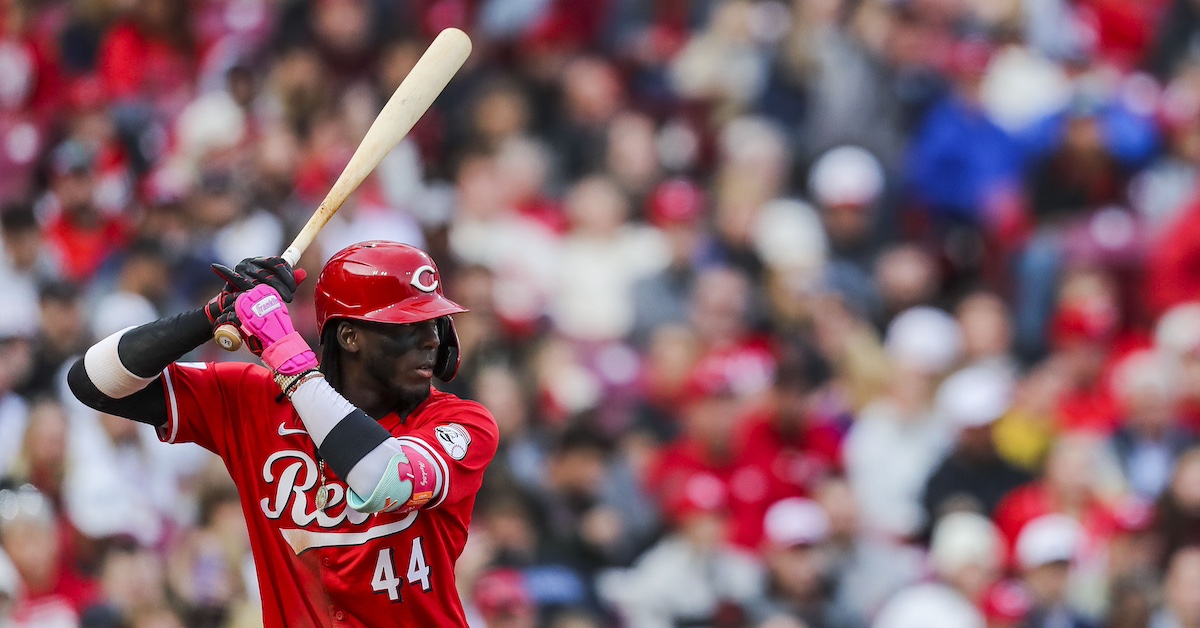
Elly De La Cruz, SS, Cincinnati Reds
I already thought De La Cruz had the potential to be one of the best players in baseball before the season started. Quite reasonably, though, I was worried about the downsides. A guy who struck out 33.7% of the time last year is always risky, and that’s particularly true given how he did it. He swung more often than league average at balls and less often than average at strikes; he also made less contact than average. You can have one of those three things be true, or maybe even two of three if you make up for it elsewhere, but three of three? Yikes. Read the rest of this entry »