FanGraphs Weekly Mailbag: March 28, 2026
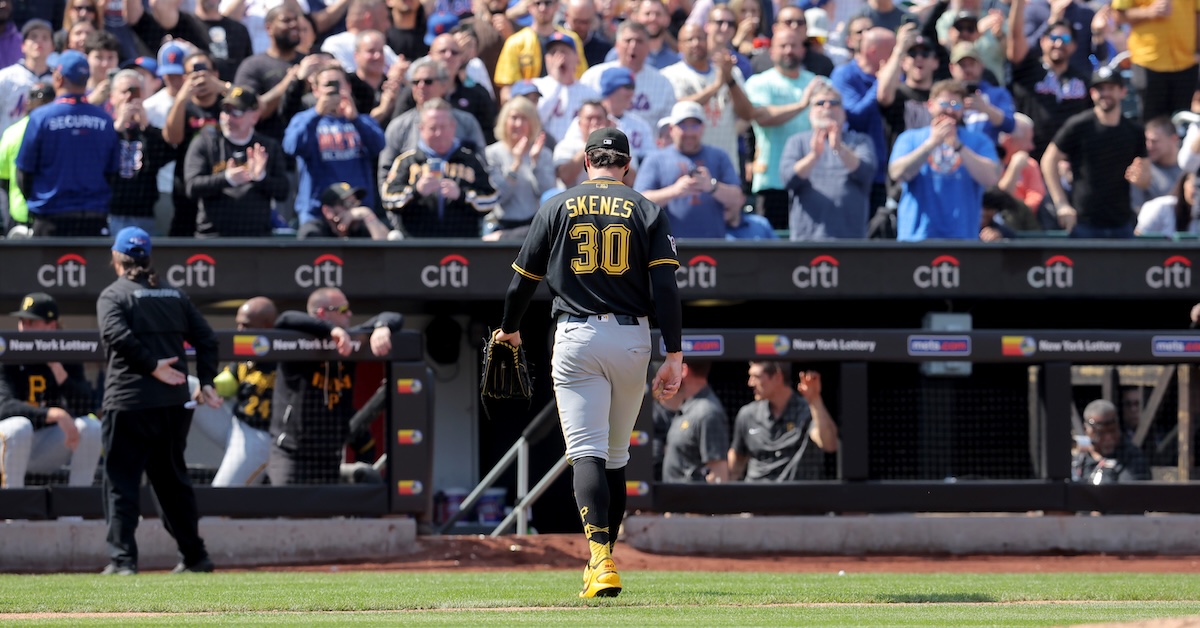
We did it everyone! We made it through the long offseason. Regular season baseball is back, and it has already delivered the goods. I attended Mets-Pirates at Citi Field on Opening Day to witness the highly anticipated pitching matchup between reigning NL Cy Young winner Paul Skenes and new New York ace Freddy Peralta. Naturally, Skenes had the worst game of his career thus far, failing to make it through the first inning, and Peralta didn’t pitch well either. The two teams combined for 18 runs in the 8 1/2 innings of play. I wrote about the Skenes start, the two defensive blunders by Oneil Cruz in center field that contributed to Pittsburgh’s first-inning fiasco, and the lineup’s surprisingly strong showing. You can read that here.
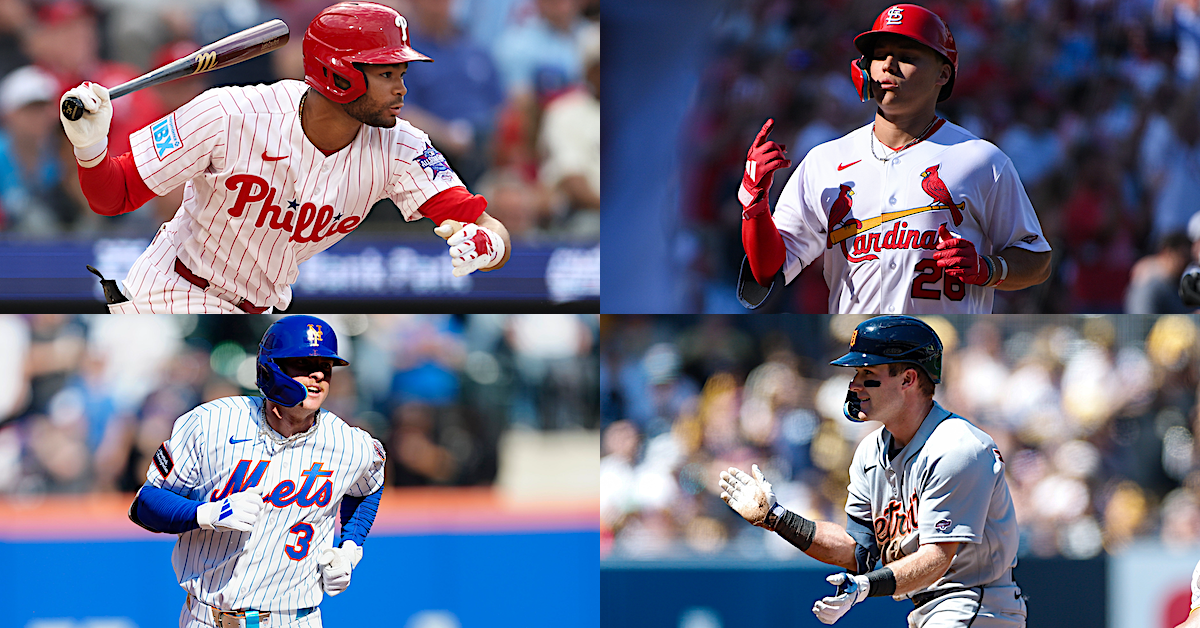
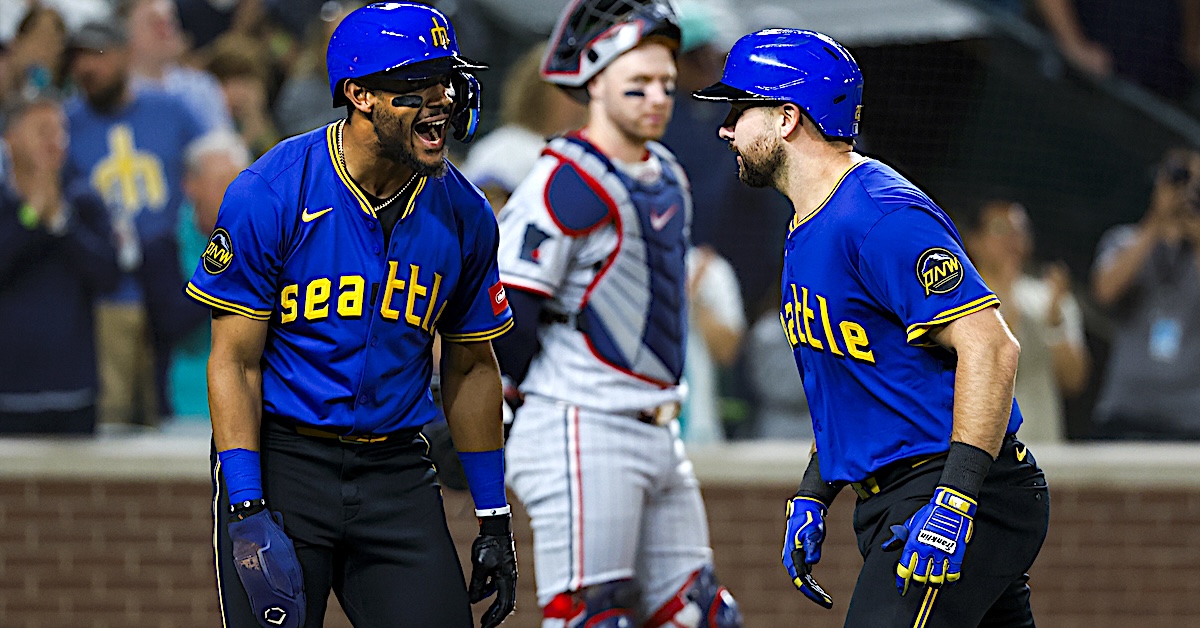
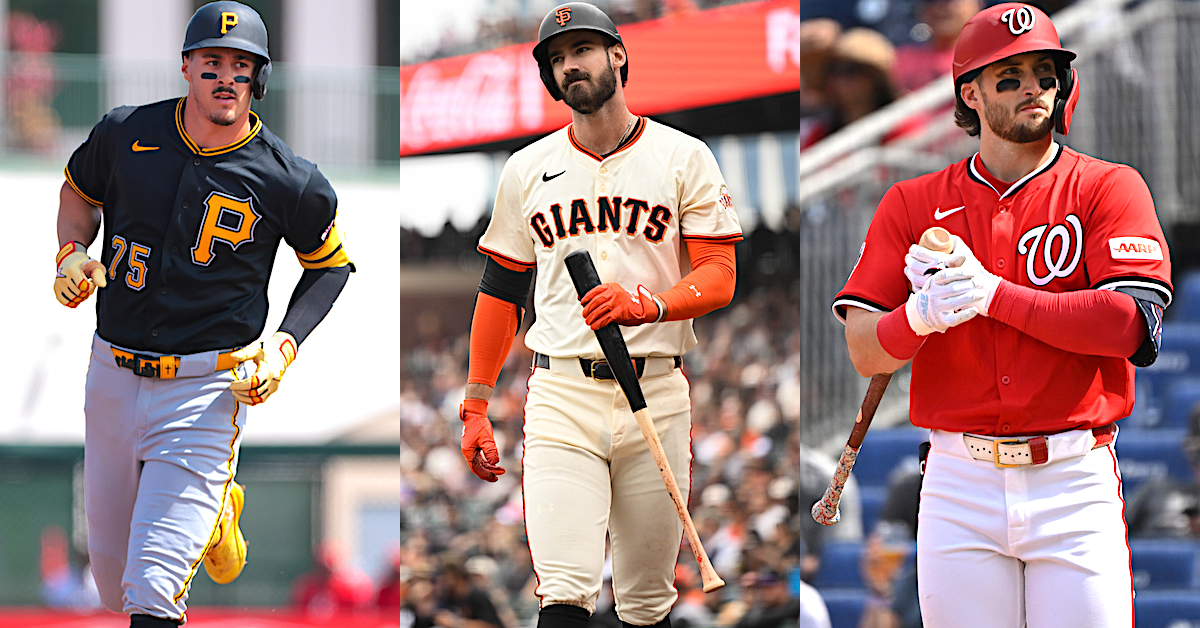
Because I was covering that contest, I didn’t get a chance to watch any of the other early games and saw only a portion of the later ones. That means I missed White Sox catcher Edgar Quero successfully challenge three ball calls in the first two innings before finally getting one wrong in the sixth inning. In that same game, which the Brewers won 14-2, Jacob Misiorowski struck out 11 Chicago batters. I also didn’t catch the pitcher’s duel between Orioles lefty Trevor Rogers and Twins righty Joe Ryan; Baltimore won, 2-1, and Adley Rutschman, not to be confused with Badley, went 2-for-4, though Tyler O’Neill’s Opening Day home run streak was snapped at six. In the later afternoon games, the Cardinals scored eight runs in the bottom of the sixth inning to secure a comeback win over the Rays, after allowing Tampa Bay to plate six runs in the top of the frame. JJ Wetherholt, who went 1-for-4 with a home run and two RBI in that game, was one of a number of prospects who shined in their big league debuts. Kevin McGonigle had four hits in the Tigers’ 8-2 win over the Padres, and Justin Crawford went 2-for-4 in the Phillies’ win over the Rangers. I actually got to see Mets right fielder Carson Benge blast his first homer, this after a dead bird had fallen in front of him in right field. It wasn’t technically his first major league game because he debuted in the postseason last year, but Cleveland’s Chase DeLauter bopped two home runs in a 6-4 win over the Mariners.
I ran through all those games up top because that’s the last we’ll be covering the Opening Day action in this week’s mailbag. Instead, we’ll be answering your questions about Matt McLain’s strong spring, Aaron Judge’s low squared-up rate, players who might benefit the most from ABS, and Tony Vitello. But first, I’d like to remind you that this mailbag is exclusive to FanGraphs Members. If you aren’t yet a Member and would like to keep reading, you can sign up for a Membership here. It’s the best way to both experience the site and support our staff, and it comes with a bunch of other great benefits. Also, if you’d like to ask a question for an upcoming mailbag, send me an email at mailbag@fangraphs.com. Read the rest of this entry »