The Padres pulled off a blockbuster on Monday afternoon, though it wasn’t the Juan Soto trade that so much of the industry expects. Instead, San Diego sent a four-player package headlined by closer Taylor Rogers, an All-Star last year, to Milwaukee in exchange for closer Josh Hader, an All-Star in four of the past five seasons, including this year.
On the surface, this appears to be something of a challenge trade: a pair of contenders swapping southpaws whose holds on the ninth inning had loosened due to shaky performances over the past month, sending their ERAs north of 4.00:
Josh Hader and Taylor Rogers: One Bad Month
Hader
IP
K%
BB%
HR/9
BABIP
xwOBA
ERA
FIP
Sv
Blown
Thru June
24.2
45.1%
7.7%
0.73
.195
.201
1.09
1.70
24
1
July
9.1
36.0%
10.0%
4.82
.524
.436
12.54
8.16
5
1
Total
34.0
41.8%
8.5%
1.85
.306
.284
4.24
3.47
29
2
Rogers
IP
K%
BB%
HR/9
BABIP
xwOBA
ERA
FIP
Sv
Blown
Thru June
31.2
29.8%
5.6%
0.28
.260
.283
2.84
2.43
22
4
July
9.2
22.0%
4.0%
0.00
.486
.372
9.31
2.09
6
3
Total
41.1
27.6%
5.2%
0.22
.333
.309
4.35
2.01
28
7
But there’s more to the deal when it comes to its respective impacts on the two teams’ 40-man rosters and payrolls, all of which is worth bearing in mind as Tuesday’s deadline approaches. Read the rest of this entry »
Ah, the trade deadline. It’s the best time of the year for baseball chaos, rumor-mongering reporting, and of course, the main event: a million trades featuring relievers you’ve heard of but don’t know a ton about. The difference between a blown lead in the seventh inning of a playoff game and an uneventful 4-2 win might be one of these unheralded arms. Heck, they could be a better option but still give up a three-run shot in a crushing loss. Or they could be a worse option! There are no guarantees in baseball. Still, here are some relievers who contending teams think enough of to trade for and plug into their bullpens.
Yankees Acquire Scott Effross Scott Effross wasn’t supposed to amount to anything in the big leagues. A 15th-round pick in the 2015 draft, he kicked around the Cubs system for years, frequently old for his level and rarely posting knockout numbers. Then in 2019, on the suggestion of pitching coach Ron Villone, he started throwing sidearm. Three years later, he’s carving through hitters in the majors.
“Carving” might undersell it. Since his 2021 debut, Effross has been one of the best relievers in the game. In 57.1 innings, he’s compiled a 2.98 ERA and 2.45 FIP. He’s striking out 29% of opposing batters and hardly walking anyone. With his new low arm slot, he’s adopted what I like to think of as the sidearmer’s basic arsenal: a sinker, a slider, and a break-glass-in-case-of-lefty changeup. Read the rest of this entry »
The Red Sox dealing free agent-to-be Christian Vázquez by the trade deadline felt inevitable after the team went 8–19 in July, and that parting came to pass on Monday evening, when the 31-year-old catcher was sent to the Astros in exchange for prospects Wilyer Abreu and Enmanuel Valdez. It was a bittersweet moment for both player and club; Boston’s ninth-round pick in the 2008 draft, Vázquez, a product of the Puerto Rico Baseball Academy, was the organization’s longest-tenured player.
Vázquez represents a meaningful offensive upgrade for the postseason-bound Astros. The contact-oriented right-handed hitter is slashing .282/.327/.432 with eight home runs and a 111 wRC+ in 318 plate appearances. Martín Maldonado, Houston’s primary catcher to this point in the season, is slashing just .173/.239/.342 with 10 home runs and a 66 wRC+ in 262 plate appearances. As good as Maldonado is defensively, an upgrade was in order.
Experience on the big stage augments the new arrival’s resume. Vázquez has played in 25 postseason games, including four in the 2018 World Series and 11 last year. His most impactful October moment came in Game 3 of the 2021 ALDS, when he walked off the Rays with an 11th-inning, Monster-clearing home run. Read the rest of this entry »
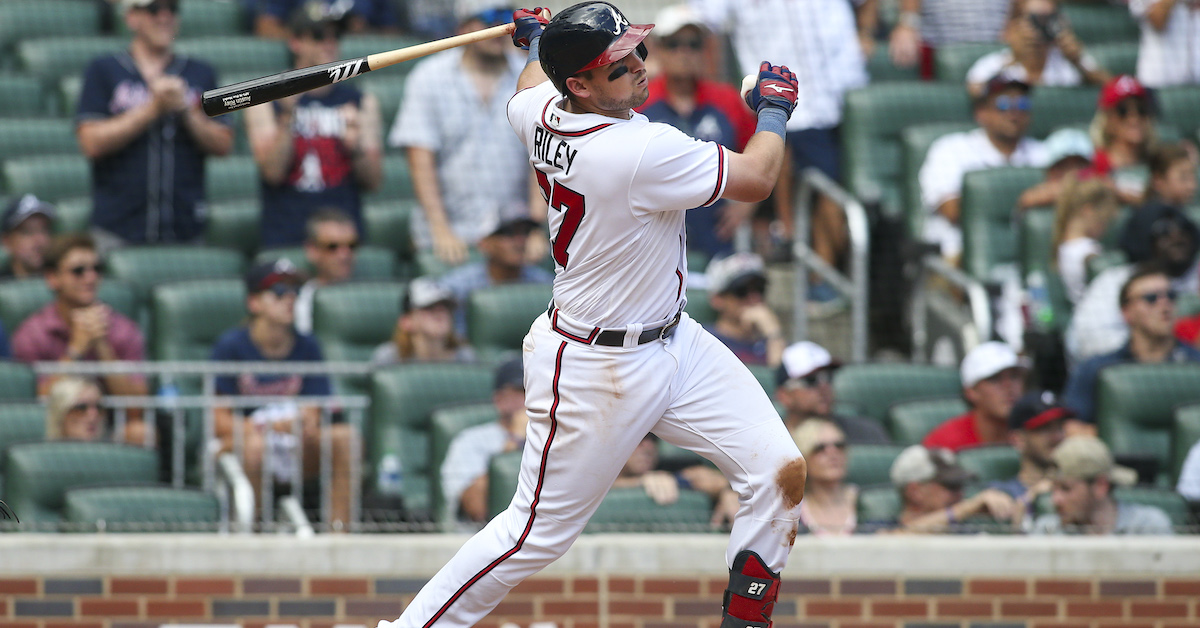
If you ever wondered how committed the Braves were to Austin Riley, they expressed their feelings clearly on Monday, agreeing with him on a 10-year, $212 million contract that will keep him in the lineup through at least the end of the 2032 season. After 2021’s breakout campaign, Riley has proceeded to break out once more, hitting .301/.360/.604 for 4.6 WAR in 101 games, that slugging percentage being enough to lead all National League hitters. The Braves also get an option season for 2033.
As a prospect, Riley was at risk, at times, of falling into the tweener gap, that dreaded place where a player doesn’t field well enough to handle third base in the majors but also doesn’t have the bat to be a good starter at first. His runner-runner breakouts have eliminated the chances of that scenario; he’s adequate enough defensively to stick at the hot corner for now, and his bat is more than capable enough to keep him a plus at first or designated hitter.
Like most of the rest of the team, Riley got off to a relatively slow start this season; at one point in late May, his line stood at an unimpressive .224/.309/.436. But from that May 22 nadir, he’s wreaked havoc on pitching staffs around the league, putting up a monster .350/.395/.713 line with 21 homers in 61 games:
Over the last 30 days, nobody’s been more of an offensive force than Riley, and he’s a primary reason that the Mets feel a lot less comfortable in the NL East than they did a few months ago. He’s put himself into the thick of the NL MVP race, and if you believe the ZiPS projections, his onslaught against the league’s hurlers isn’t stopping any time soon:
2022 ZiPS Projection – Austin Riley
Year
BA
OBP
SLG
AB
R
H
2B
3B
HR
RBI
BB
SO
SB
OPS+
DR
WAR
2023
.286
.351
.554
587
88
168
33
2
40
106
52
170
1
131
-4
4.7
2024
.284
.352
.562
566
86
161
33
2
40
105
52
168
1
133
-4
4.6
2025
.282
.350
.559
556
85
157
33
2
39
103
51
165
1
132
-5
4.3
2026
.283
.350
.561
540
82
153
32
2
38
99
50
156
1
133
-6
4.1
2027
.286
.352
.558
525
79
150
31
2
36
96
48
145
1
133
-6
3.9
2028
.283
.348
.543
506
74
143
29
2
33
89
45
137
1
128
-7
3.3
2029
.279
.343
.529
484
68
135
27
2
30
83
42
128
1
123
-8
2.7
2030
.275
.338
.505
461
62
127
24
2
26
74
38
117
1
116
-10
2.0
2031
.271
.332
.478
435
55
118
22
1
22
65
34
105
1
108
-11
1.3
2032
.265
.321
.447
407
48
108
18
1
18
56
29
91
1
98
-12
0.5
ZiPS projects that if Riley hit free agency this winter, he’d merit a 10-year, $258 million contract, though he wasn’t going to get quite that much as a consequence of not making it to the open market until after the 2025 season. The computer projects arbitration year salaries of $9.2 million, $15.5 million, and $21.3 million, giving an overall estimate of $202 million over 10 years. In other words, my projections consider this a very reasonable contract, one in which Riley is selling his free agent years to Atlanta at a fair price. If the defensive projections turn out correct, he may need to move off of third base toward the end of his time in Atlanta, but it’s way too soon to start fretting about the exact configuration of 2030’s lineup. Read the rest of this entry »
Frankie Montas needed to be set free. When the A’s began their selloff in earnest this offsesaon, he looked like a lock to end up elsewhere. Sean Manaea and Chris Bassitt, fellow rotation stalwarts, were gone. Matt Chapman and Matt Olson were shipped out. Montas (along with Sean Murphy and Ramón Laureano) seemed likely to be next, but then the season started, and there he was, still atop the Oakland rotation.
He’s done everything Oakland could possibly ask of him this season, to the tune of a 3.18 ERA in 19 starts. Meanwhile, the A’s have the second-worst record in baseball, ahead of only the woeful Nationals. Montas will reach free agency after the 2023 season, another year in which the A’s will likely be far from the playoff conversation. He had a brief injury scare, missing two turns with shoulder inflammation, but he’s returned to the field and made two starts without incident. One way or another, the A’s were going to move him.
The Yankees, for their part, stormed to the best record in baseball but would still like starting pitching help. Gerrit Cole is great and Nestor Cortes has been a revelation this year, but the group of pitchers behind them has been uneven. Jordan Montgomery started strong, but he’s been homer-prone of late. Jameson Taillon is steady but a step below Montas results-wise, and will be a free agent after this year. Luis Severinojust hit the 60-day IL, pushing a potential return even deeper into September. The aggregate results have been solid, but you can see why the team wants more certainty given the difficulty of cleanly upgrading their lineup. Read the rest of this entry »
The Astros shook up their first base situation on Monday, acquiring 1B/DH Trey Mancini from the Orioles as part of a three-way trade that also included the Rays. Mancini, the longest-tenured player on Baltimore’s roster, was having a solid, if not spectacular, season, hitting .268/.347/.404 with 10 homers and 1.2 WAR in 92 games, with most of his playing time this season split between first base and designated hitter and an occasional appearance in a corner outfield role. He’ll be a free agent at the end of the season, though there is a $10 million mutual option. To land Mancini, the Astros sent outfielder Jose Siri to the Rays and pitcher Chayce McDermott to the O’s, with Tampa shipping pitcher Seth Johnson to Baltimore and Jayden Murray to Houston.
To look at this trade more easily, let’s separate it into three different transactions.
The Baltimore Orioles acquire pitchers Seth Johnson and Chayce McDermott for 1B/DH Trey Mancini
From a PR standpoint, there will likely be some sharp elbows thrown at the Orioles locally. Baltimore is having its first even marginally playoff-relevant season in a long while, and Mancini has been with the team through the entire process. As its veteran rebuild survivor, he played a similar role that Freddie Freeman did for the Braves while they went through their own painful renovations. His battle with colon cancer, diagnosed on his 28th birthday, and subsequent grand return after surgery and six months of chemotherapy only served to make him more beloved in town.
Basically, the on-field case for keeping Mancini and letting him walk at the end of the season involved a very “now” outlook for the team. It does make the Orioles a bit weaker over the next two months, but it’s only a major loss if you look at the consequences in a very binary fashion, in that Baltimore is in the wild card race with Mancini and out of it without him. Once you move past that, the calculus for whether a trade like this is a good idea comes out very differently. Read the rest of this entry »
Rumors of a contract negotiations between starting pitcher Joe Musgrove and the San Diego Padres have been percolating for the last month, and those discussions bore fruit over the weekend: With a five-year, $100 million contract extension, the Padres have locked up their best and most dependable starter through the end of the 2027 season.
I discussed a possible Musgrove extension a couple of weeks ago, and not much has changed in the right-hander’s valuation since then, when ZiPS thought that a five year, $126 million contract would be fair for both sides. That makes landing Musgrove for $100 million a nice deal for the Friars, likely the result of some unknown combination of canniness, Musgrove’s comfort at the top of the rotation, and his stated desire to stay with his hometown team (Musgrove is from the San Diego area).
For Padres fans, it must be a relief to get this extension done — even when most of the factors suggest a deal can be reached, there’s no guarantee until there’s ink on the paper. Being from Baltimore, I think back on the acrimonious end to Mike Mussina‘s time in Charm City. Mussina had previously given the O’s a very good deal on a three-year, $21 million contract that bought out a year of free agency, but when he actually did hit the open market, the O’s basically underbid the Yankees, working on the assumption that a hometown discount would be permanently built into his contracts. That the second half of Moose’s Hall of Fame career came with the Yankees still makes me sad! ZiPS projects Musgrove as the best pitcher available in free agency — his projection edges out Carlos Rodón’s — and as with Mussina and the Yankees, all bets are off once the 29 other teams can bid on your franchise pitcher. Read the rest of this entry »
With their outfield (and whole roster, really) hit hard by injuries, the Rays acquired 34-year-old left fielder David Peralta from the Diamondbacks for 19-year-old catching prospect Christian Cerda on Sunday. The Freight Train is hitting .248/.315/.457, good for a 109 wRC+, which is in line with his career norm (111 wRC+), even though the shape of his production has totally changed.
Before we get into how that came to be, though, let’s take a moment to appreciate Peralta’s remarkable path here. Originally a left-handed pitcher in the Cardinals organization, he was released amid shoulder issues and played outfield in Independent ball for a couple of years before signing with the Diamondbacks in 2013. It’s borderline offensive to cram that stretch of Peralta’s career into one sentence. Indy ball isn’t exactly glamorous, and Peralta was broke and worked at McDonalds while waiting for the Diamondbacks, who he knew wanted to sign him, to free up the minor league roster space to do so. After he finally signed, it took only about a year for him to reach the big leagues, and Peralta has had one hell of a now nine-year MLB career, during which he’s been one of the better left field defenders in baseball (and has one Gold Glove), won a Silver Slugger during his peak year in 2018 (.293/.352/.516 with 30 bombs), led the league in triples twice, and endured wrist and shoulder surgeries while becoming a cult hero in Arizona. From a baseball role standpoint, the Rays are getting a platoon stick (.268/.325/.496 versus righties this year) and plus defender in a corner spot, but Peralta also brings the parts of himself that helped him grind through injury and Indy ball. Read the rest of this entry »
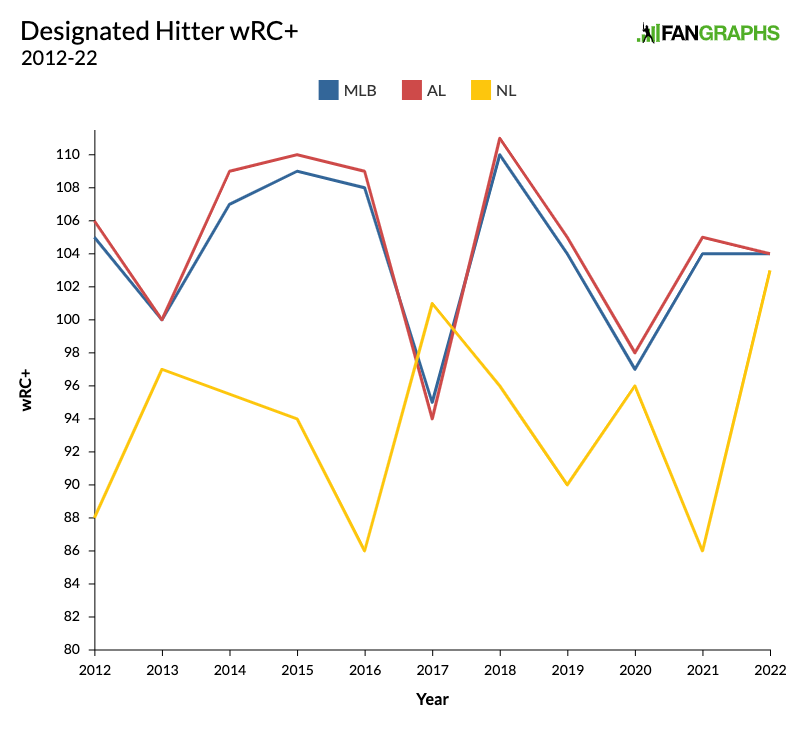
While still focusing upon teams that meet the loose definition of contenders (a .500 record or Playoff Odds of at least 10%), this year I have incorporated our Depth Charts’ rest-of-season WAR projections into the equation for an additional perspective. Sometimes that may suggest that the team will clear the bar by a significant margin, but even so, I’ve included them here because the team’s performance at that spot is worth a look.
At the other positions in this series, I have used about 0.6 WAR or less thus far — which prorates to 1.0 WAR over a full season — as my cutoff, making exceptions here and there, but for the designated hitters, I’ve lowered that to 0.3, both to keep the list length manageable and to account for the general spread of value; in the first full season of the universal DH, exactly half the teams in the majors have actually gotten 0.1 WAR or less from their DHs thus far, and only 10 have gotten more than 0.6. DHs as a group have hit .239/.317/.404 for a 104 wRC+; that last figure matches what they did as a group both last year and in 2019, and it’s boosted by the best performance by NL DHs (103 wRC+) since 2009, when their 117 wRC+ accounted for a grand total of 525 PA, about 32 per NL team.
If you’ve ever played the game 2048, you know the deep satisfaction of sliding things around and making everything look cleaner. Two 2’s become a 4, two 4’s become an 8, and pretty soon you’ve slid your way into a gratifying relaxation. What does that have to do with baseball? The Phillies made a 2048-style trade this weekend, and I can’t wait to tell you about it.
The baseball version of that slide-and-combine game is all about defense. If you acquire a defensive wizard at shortstop, you can slide your existing shortstop to third, your third baseman to first, your first baseman to DH – you get the idea. You can do the same in the outfield. Add a Gold Glove center fielder, and your average center fielder becomes a great right fielder. Your solid right fielder can take over for the guy in left field you’d rather have DH. Adding one defender and sliding can turn a blah defense into a good one. Deeply satisfying, just like 2048.
The Phillies and their porous defense would seem like a perfect candidate for such satisfying sliding, but before the season, they couldn’t actually do it. There were some pesky pieces blocking their natural ability to slide down the defensive spectrum. With essentially three DHs – Kyle Schwarber, Rhys Hoskins, and Nick Castellanos – and only two landing spots between them, the “slide someone to DH” part of the equation wouldn’t work. When Bryce Harper injured his elbow, he couldn’t play the field, which further jammed up the works. Read the rest of this entry »