Today the Killers list turns the corner — or rather turns to the teams receiving less-than-acceptable production in the outfield corners. While still focusing on clubs that meet the loose definition of contenders (a .500 record or Playoff Odds of at least 10%), and that have gotten about 0.6 WAR or less out of a position thus far (which prorates to 1.0 WAR over a full season), I’ve also incorporated our Depth Charts’ rest-of-season WAR projections into the equation for an additional perspective. Sometimes that may suggest that the team will clear the bar by a significant margin, but even so, I’ve included them here because the team’s performance is worth a look.
As noted previously, some of these situations are more dire than others, particularly within the context of the rest of their roster. I’ve batched the two corners into one supersized roundup because three of the seven teams below the WAR cutoff for left field also make the list for right field, and because there’s plenty of crossover in play with regards to personnel. The capsules are listed in order of their left field rankings first, while noting those crossover teams with an asterisk. As always, I don’t expect every team here to go out and track down upgrades before the July 31 deadline, but these are teams to keep an eye on.
2025 Replacement-Level Killers: Left Field and Right Field
| Left Field |
| Team |
AVG |
OBP |
SLG |
wRC+ |
Bat |
BsR |
Fld |
WAR |
ROS WAR |
Tot WAR |
| Royals |
.211 |
.283 |
.307 |
62 |
-16.7 |
-2.1 |
-1.0 |
-1.2 |
0.3 |
-0.9 |
| Reds |
.234 |
.305 |
.343 |
79 |
-9.7 |
-0.6 |
-6.3 |
-0.9 |
0.6 |
-0.3 |
| Phillies |
.193 |
.304 |
.340 |
82 |
-8.1 |
0.1 |
-3.1 |
-0.3 |
0.5 |
0.2 |
| Padres |
.231 |
.282 |
.332 |
75 |
-10.5 |
-0.8 |
3.1 |
-0.1 |
0.4 |
0.3 |
| Dodgers |
.207 |
.297 |
.350 |
85 |
-6.8 |
-1.2 |
-1.0 |
-0.1 |
0.8 |
0.7 |
| Astros |
.230 |
.307 |
.366 |
88 |
-5.3 |
-1.2 |
-2.4 |
0.0 |
0.8 |
0.8 |
| Diamondbacks |
.237 |
.287 |
.396 |
88 |
-6.0 |
0.9 |
0.5 |
0.5 |
0.7 |
1.2 |
| Team |
AVG |
OBP |
SLG |
wRC+ |
Bat |
BsR |
Fld |
WAR |
ROS WAR |
Tot WAR |
| Royals |
.174 |
.237 |
.262 |
37 |
-27.0 |
-0.2 |
-6.2 |
-2.6 |
0.1 |
-2.5 |
| Guardians |
.187 |
.248 |
.289 |
51 |
-19.6 |
-0.1 |
-3.2 |
-1.6 |
0.7 |
-0.9 |
| Reds |
.200 |
.275 |
.350 |
71 |
-12.3 |
-1.0 |
-2.8 |
-0.9 |
0.5 |
-0.4 |
| Mariners |
.232 |
.273 |
.375 |
84 |
-6.9 |
0.2 |
-7.2 |
-0.6 |
0.9 |
0.3 |
| Phillies |
.285 |
.321 |
.447 |
112 |
5.4 |
-2.5 |
-11.1 |
0.1 |
0.2 |
0.3 |
| Cardinals |
.239 |
.302 |
.396 |
97 |
-1.5 |
-0.5 |
-2.7 |
0.4 |
0.6 |
1.0 |
| Twins |
.220 |
.300 |
.426 |
102 |
0.7 |
-1.3 |
-3.6 |
0.5 |
1.0 |
1.5 |
All statistics through July 13.
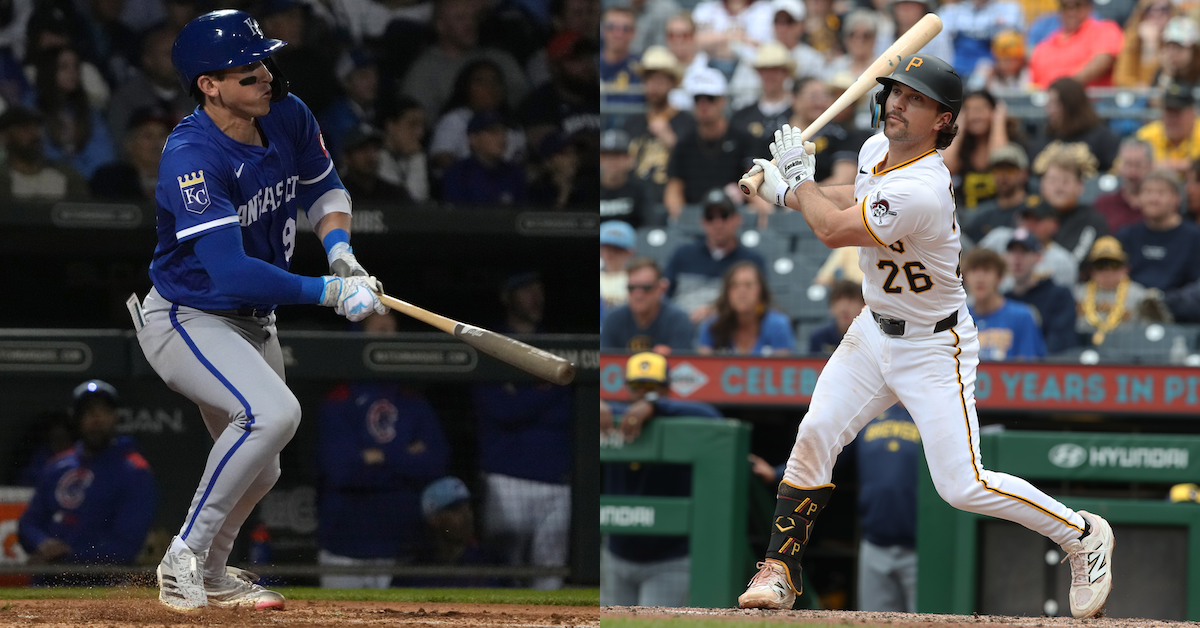
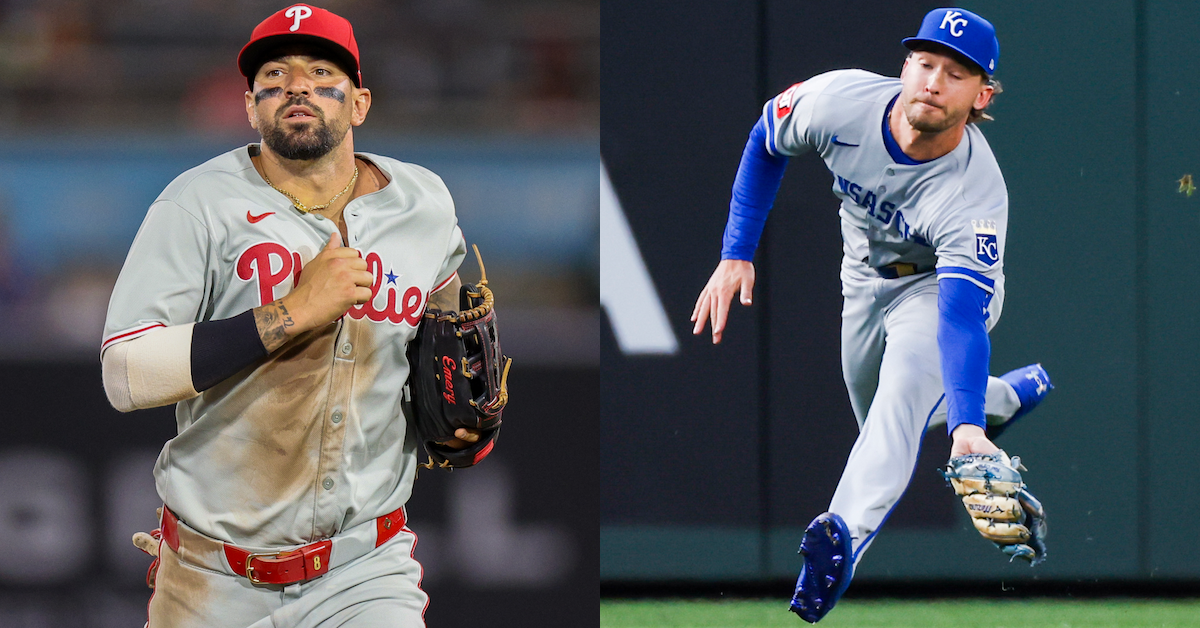
Royals*
Good grief, somehow Royals corner outfielders have combined for -3.8 WAR, suggesting that the 47-50 team would be over .500 if it had found some typically unremarkable replacement level outfielders to fill those posts. Manager Matt Quatraro has used nine left fielders and eight right fielders, with some crossover between the two. Somehow, only one player at each position has managed even a 100 wRC+ in their thin slice of playing time, namely Jonathan India in left and Drew Waters in right. India, who’s played all of 21 games in left, is new to the position at the major league level; his glove is a liability no matter where you put him and he’s hitting just .251/.332/.348 (91 wRC+) overall. Waters, who’s played 41 games in left, 21 in right, and 22 in center, has hit just .243/.288/.316 (66 wRC+) overall, suggesting his 105 wRC+ in 53 PA in right is a fluke. Mark Canha has collapsed to a 49 wRC+ with career worsts in just about every key Statcast category, though his stints on the injured list for an adductor strain and (currently) tennis elbow have possibly contributed to his woes. None of the other principals at either corner has spent time on the IL.
Hunter Renfroe, who began the year as the regular right fielder, was a full win below replacement before he was released in late May. Jac Caglianone, a 22-year-old 50-FV prospect who has taken over right, has been the next-worst, at -0.9 WAR. Caglianone entered the season ranked no. 47 on our Top 100 Prospects list but had never played above High-A; he’s hit a cringeworthy .140/.196/.264 (22 wRC+) in 138 PA while chasing 41.1% of pitches outside the zone. At some point a responsible adult would send him back to the minors for more seasoning despite the occasional 466-foot homer. Instead, he’s 4-for-40 this month including that July 10 shot. Cool, cool.
In eight seasons of doing this series for FanGraphs (plus a handful of times at Baseball Prospectus and Sports Illustrated), I can’t recall even a fringe contender so hamstrung by an inability to find reasonably productive players at offense-first positions. It’s a testament to the quality of the Royals’ pitching and the play of Bobby Witt Jr., Maikel Garcia and Vinnie Pasquantino that this team even has a shred of a chance at a playoff spot. This is the part where I normally suggest potential trade targets who could help shore up the situation; in this case the answer is “just about anyone not already on the Royals roster.” Candidates such as the White Sox’s Andrew Benintendi and the Marlins’ Jesús Sánchez look like Juan Soto and Aaron Judge next to this crowd.
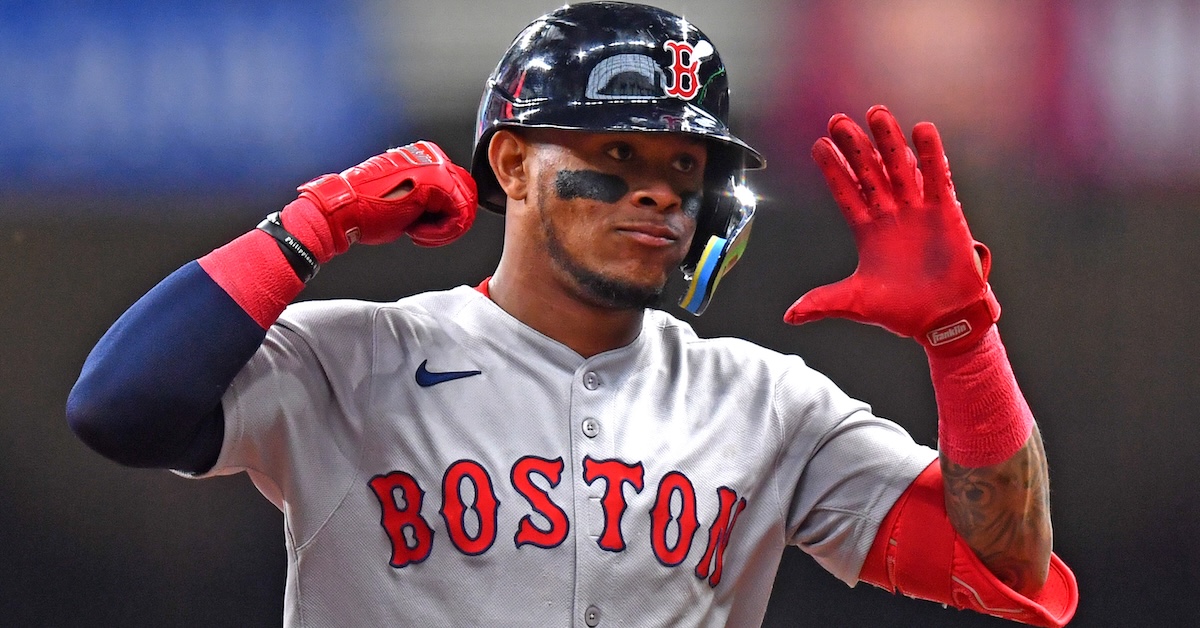
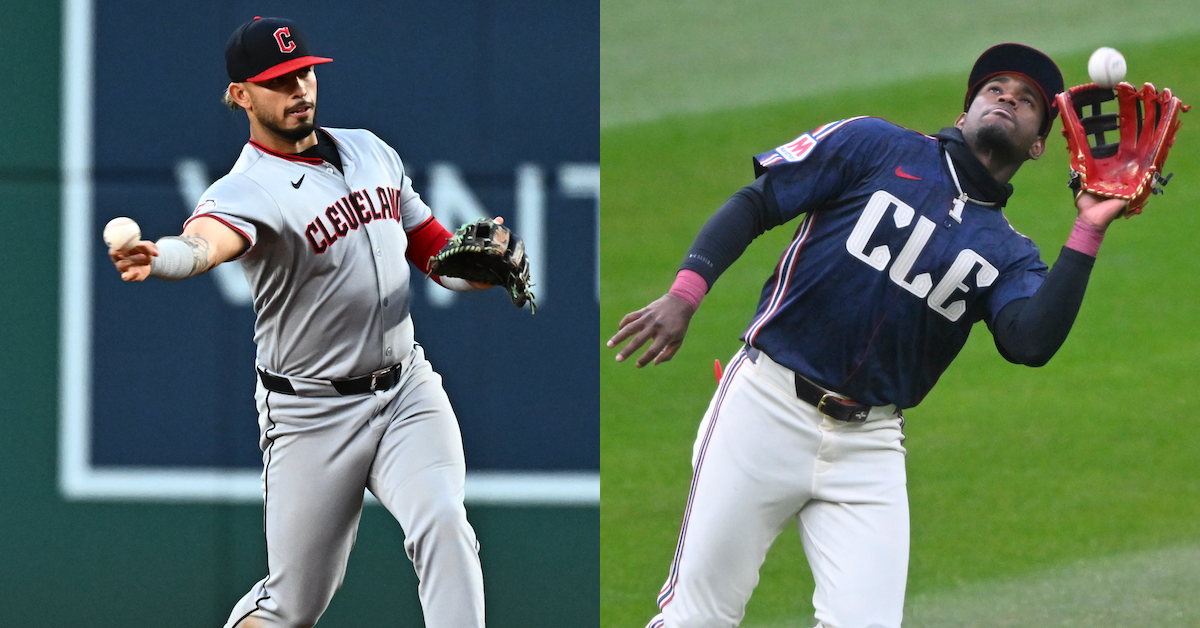
Reds*
Nothing the Reds have done with either outfield corner has worked for very long or very well. Manager Terry Francona has used 10 different left fielders and eight different right fielders, with six players getting time at both. Offseason acquisition Gavin Lux has logged a team-high 34 starts in left while bouncing around to make 30 more at DH, nine at second base, and five at third. Overall, he’s hit .265/.355/.379 (106 wRC+), but his play in left has been, uh, DH-caliber (-6 FRV, -4 DRS in 278.2 innings). Austin Hays, who’s split his time about equally between left (21 starts) and DH (23 starts), has been very effective when available (.287/.323/.517, 124 wRC+) amid three separate IL stints for left calf and left hamstring strains and a left foot contusion; he and Lux have generally shared the left field and DH roles against righties.
Jake Fraley has started 39 games in right, all but one against righties; he’s hit .224/.336/.376 (100 wRC+), but has served IL stints for a left calf strain and a right shoulder sprain, the latter of which he returned from just before the All-Star break. Will Benson has split his time between left (17 starts), right (22 starts), and center (three starts), with just four from that total against lefties; he’s scuffled to a .223/.276/.427 (87 wRC+) line. Of the eight other corner outfielders Francona has tried, only Santiago Espinal has a wRC+ of at least 100 in that capacity, but that’s over just 30 PA, and his overall 63 wRC+ factors into the Reds’ placement on the third base list.
With Hays and Fraley both healthy, the Reds are in better shape than they’ve been for most of the season; the pair has spent just about two weeks together on the active roster (the second half of April). Still, between those two and the everyday play of Lux at one position or another, they’re a bit light (spoiler alert: they’ll be on the DH list as well), with a right-handed bat probably their bigger need. Unlike the Phillies (below), they’re less inclined to add payroll, but as one of the league’s younger teams, they should think in terms of multiple years. Three righties who could be available, the Rangers’ Adolis García, the Orioles’ Ramón Laureano, and the Angels’ Taylor Ward, each have another year of club control remaining; the first two will be arbitration-eligible, the last has a $6.5 million option. Red Sox lefty Wilyer Abreu, who’s got one more pre-arbitration season, offers even more upside and control but will require a greater return.
Phillies*
As noted in Wednesday’s installment, the Phillies rank 27th in the majors in total outfield WAR at 0.3, with left field the weakest of the three positions. Max Kepler spent the better part of a decade as a league-average hitter with a good enough glove to be a two-to-three-win right fielder for the Twins, but last year, he made two trips to the IL and slipped to a 93 wRC+ and 0.9 WAR. The Phillies didn’t overcommit, signing him to a one-year, $10 million deal, but his offense has continued to lag. His 90 wRC+ (.210/.307/.371) is a career low, and in his first taste of left field — the easier of the two corners — his -2 FRV is as well. Kepler’s average exit velocity is about 2 mph higher than last year, with his barrel rate improving from 6.2% to 11.4%, and his hard-hit rate from 36.6% to 44.8%, but he’s fallen 51 points short of his .412 xSLG.
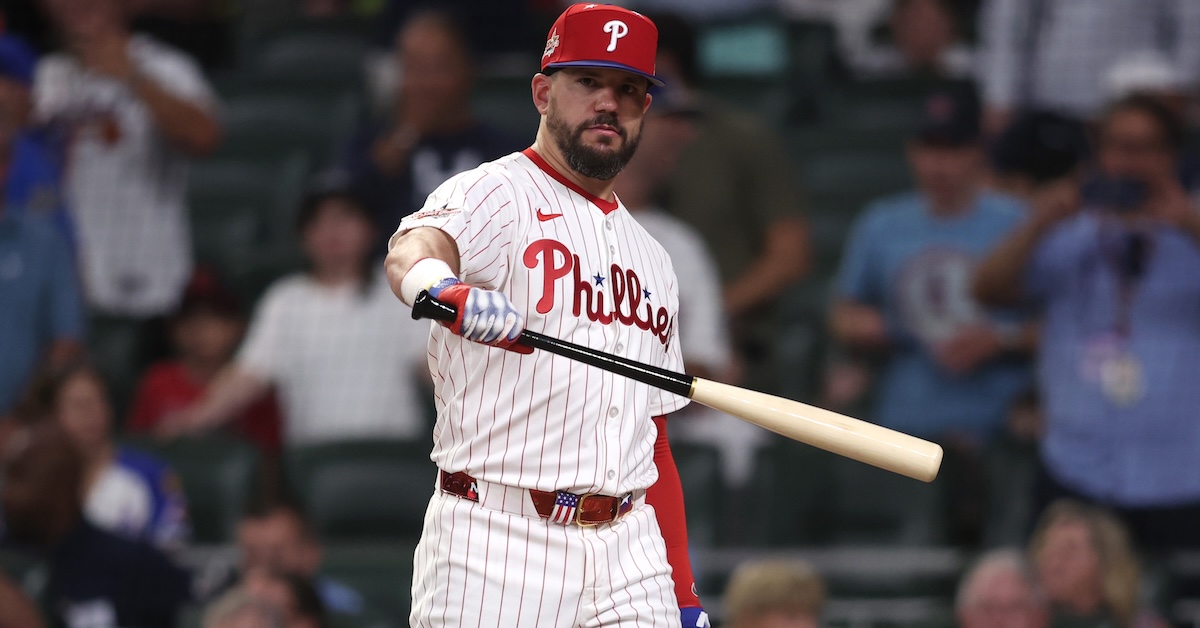
Right fielder Nick Castellanos needs no introduction to readers of this annual series. Four years into a five-year, $100 million deal with the Phillies, his timing remains impeccable: he’s landed here annually. His offense isn’t completely terrible for a change; his 107 wRC+ (.273/.313/.438) is in line with his final 2022 and ’23 lines, and only three points shy of the major league average for right fielders. Alas, he’s a DH stuck in the field because the Phillies already have a better DH in Kyle Schwarber. Castellanos’ defensive metrics are on track to be his worst since 2018; after averaging -9 DRS and -12 FRV in his first three seasons in Philly, he’s at -14 DRS and -12 FRV with 66 games to go.
The Phillies have recently given a bit of playing time in left field to 25-year-old rookie Otto Kemp, an undrafted free agent who hit .313/.416/.594 at Triple-A Lehigh Valley and is at .247/.316/.337 (86 wRC+) with a 28.6% strikeout rate through 98 PA thus far in the majors. Kemp has 30-grade contact skills due to his problems with secondary stuff, and his defense at third base, his primary position in the minors, is shaky. He might work as the short half of a corner platoon, but the Phillies really need to add a quality bat. Abreu, García, and Ward each offer some firepower (not necessarily without flaws), while Benintendi and Sánchez would at least raise the production floor.
Padres
Where have you gone, Jurickson Profar? A nation turns it’s lonely eyes to you… The departure of their 2024 left fielder left a hole that the Padres have tried to fill using 10 different player. The bygone platoon of Jason Heyward and Oscar Gonzalez wasn’t up to the task. What has worked lately, particularly on the offensive side, has been using Gavin Sheets in left. The ex-White Sock has hit .265/.324/.451 (119 wRC+) in 44 games at DH, 34 in left (with all but two of them coming since May 25), and 12 at first base. Historically, the 6-foot-3, 235-pound lefty has been brutal in right field (-23 DRS, -18 FRV in 1543 innings) but has been within one run of average in the two metrics in 263 innings in left thus far. He’s been light against lefties (96 wRC+, compared to 128 against righties), so he could use a platoon partner, particularly one who can also serve as a defensive replacement; neither Brandon Lockridge nor Bryce Johnson have shown themselves to be up to the task, but this shouldn’t be the hardest problem for A.J. Preller to solve at deadline time.
Dodgers
Michael Conforto’s one-year, $17 million deal flew under the radar this past winter given the team’s fancier expenditures, but like those, the early returns aren’t too hot. The 32-year-old Conforto has hit just .184/.298/.322 (80 wRC+) with eight homers and subpar defense in left field (-3 DRS, -3 FRV). July is his first month with a wRC+ of at least 100, albeit in just 38 PA, and there’s no underlying batted ball trend suggesting notable improvement. Indeed, Conforto’s Statcast contact numbers, while still above average, are down relative to last season, and he’s lagging well behind both his .243 xBA and .421 xSLG, with his 99-point shortfall in SLG the seventh-largest in the majors.
While the Dodgers have alternatives in left, Enrique Hernández figures in the third base picture with Max Muncy sidelined, and Andy Pages — whose 205 wRC+ in 44 PA is propping up the offensive numbers here — is better used in center or right. One as-yet unexplored option would be to add rookie Dalton Rushing to the mix. The 24-year-old backstop has hit just .221/.293/.309 (73 wRC+) since debuting in mid-May, but a weekly diet of 10 PA can’t be helping his cause, and he does have 33 games of minor league experience in left.
It’s not inconceivable that the Dodgers cut bait on Conforto, particularly if they have a roster crunch. But so long as their offense is scoring a major league-high 5.33 runs per game, the matter is less urgent than their perennial need for pitching amid so many injuries.
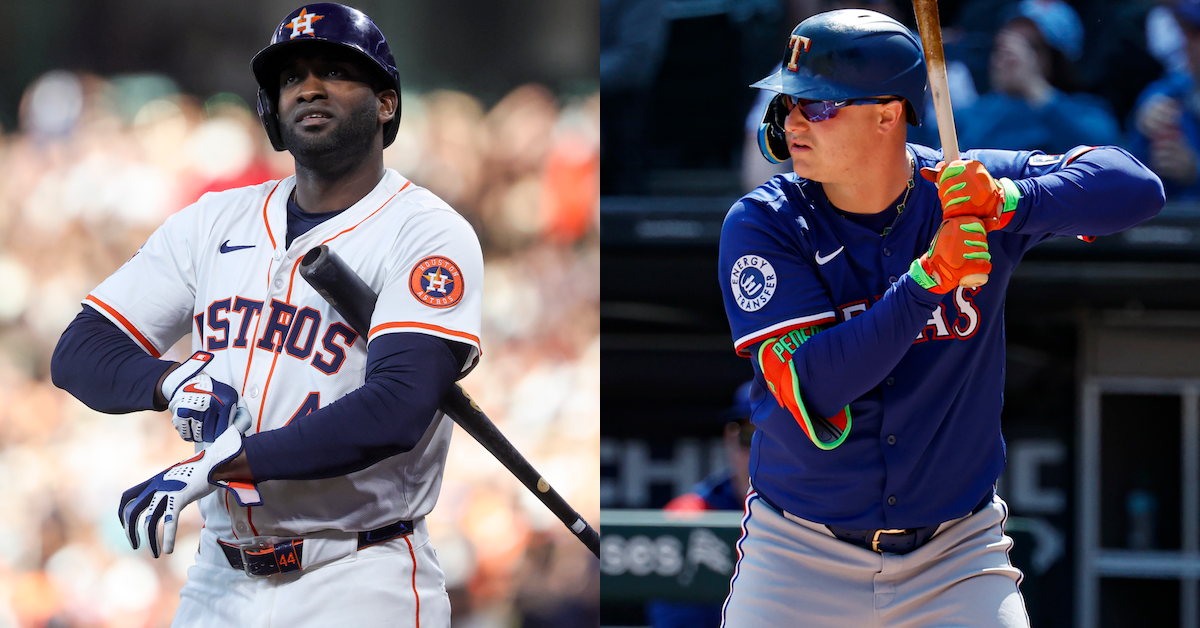
Astros
The Astros haven’t entirely buried the Jose Altuve experiment yet, but the 35-year-old star has started just two of Houston’s last 19 games in left (and 39 overall) compared to four at designated hitter and 13 at second base. His offense (.277/.336/.465, 121 wRC+) has been fine, but his defense at the new position has been brutal (-8 DRS, -4 FRV in 325 innings), and it’s been no picnic at second either (-3 DRS, 0 FRV in 263 innings). His best position these days is probably DH, and with Yordan Alvarez sidelined due to inflammation in his right hand with no clear return date, that option is at least open.
Of the eight other Astros who have played left, the best on both sides of the ball has been Mauricio Dubón, who’s made more starts at second than left (29 versus five) while also filling in at shortstop (where he’s helped to cover for the loss of Jeremy Peña to a broken rib), third, and the other two outfield spots. He’s hitting a comparatively robust .255/.292/.415 (96 wRC+) overall and is, of course, a better defender than Altuve at either post, but he belongs at a position where he can best utilize those defensive skills. The Astro who’d merit a closer look is Zach Dezenzo, but the 6-foot-5, 220-pound rookie was recently transferred to the 60-day IL while recovering from a capsule strain in his left hand. He’s just 6-for-47 while playing left but is hitting .245/.321/.367 (96 wRC+), with a 16.4% barrel rate and a .440 xSLG offsetting his 33.9% strikeout rate. He’s eligible to return in August, so the Astros may push forward with their current jumble and hope he can help later. Still, with apologies to Cooper Hummel, Taylor Trammell, et al, this team needs a garden-variety left fielder who can hit a lick and catch the ball.
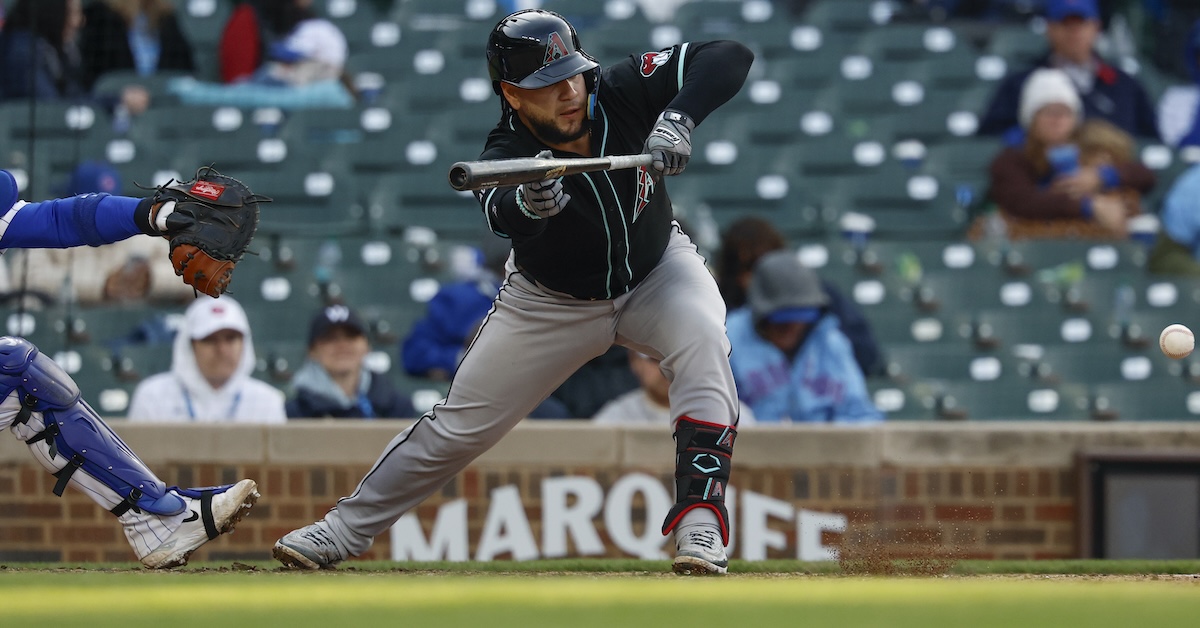
Diamondbacks
Lourdes Gurriel Jr. is now in his third season as Arizona’s left fielder. While his .251/.299/.421 slashline represents drops of 28 points of AVG, 23 points of OBP, and 14 points of SLG relative to last year — for a 10-point drop in wRC+ (from 108 to 98) — his average exit velocity, barrel rate, and hard-hit rate are virtually unchanged, and his xBA, xSLG, and xwOBA have only fallen by six or seven points. Aside from a 4.5-percentage point drop in strikeout rate, resulting in more batted balls, nothing’s really changed for him on the offensive side. He’s on this list because of a bit of bad luck here and a dip in defensive metrics there (from 3 DRS to -6, and from 1 FRV to -2), but he’ll probably remain the everyday left fielder unless the Diamondbacks clear out some outfield depth and cut salary ahead of the trade deadline — in which case he could wind up with another team on this list.
Guardians
Originally drafted and developed by the Guardians, Nolan Jones made four Top 100 Prospects lists (2019–22) before being traded to the Rockies in November 2022. Following a strong rookie season in Colorado (20 homers, 20 steals, 137 wRC+, 3.7 WAR), he battled injuries — most notably a lower back strain — and struggled in 2024, hitting just .227/.321/.320 (69 wRC+) with three homers. The Guardians reacquired him in March and have generally started him against righties either in right (45 times) or center (12 times), with nine starts against lefties spread across the three outfield positions. Unfortunately, the lefty-swinging 27-year-old’s offense hasn’t returned; he’s batting just .229/.319/.330 (87 wRC+), though as noted in the center field installment, he’s hitting the ball harder than those results suggest, with a 91.5-mph average exit velocity (3.3 mph higher than last year), an 8% barrel rate, and a 46.3% hard-hit rate. He’s cut his groundball rate, is pulling the ball more often, and has even shaved his strikeout rate to 26.5%. The 95-point gap between his .425 xSLG and his actual mark is tied for the majors’ ninth-largest.
Jones could use some better luck and a better supporting cast. Jhonkensy Noel plummeted from last year’s 118 wRC+ to zero — yes, a 0 wRC+ — with a .140/.162/.215 slashline, earning him a ticket back to Triple-A Columbus. Current platoon partner Johnathan Rodríguez has been only slightly better (.140/.189/.220, 12 wRC+). Given their 46–49 record and other trouble spots (including shortstop and center field), the Guardians may wind up selling or holding, but one trade candidate who would make sense is Laureano, who spent parts of 2023 and ’24 with the team. The Guardians did release him last May, but his 135 wRC+ for the Braves and Orioles since then suggests he’s worth another look.
Mariners
The early-April loss of starting right fielder Victor Robles to a fracture of the humeral head in his left shoulder cost the Mariners a valuable catalyst. Luke Raley took over the position, but he strained his oblique in late April, missed seven weeks, and upon returning took over the long half of a first base platoon. Leody Taveras came and went. Fortunately for the Mariners, Dominic Canzone arrived from Triple-A Tacoma and has more or less saved the day. The 27-year-old lefty, who’s closed up his stance somewhat and is swinging the bat harder, has hit a sizzling .319/.340/.564 (158 wRC+) in 97 PA. Yes, he’s chasing nearly 38% of pitches outside the zone and walking just 3.1% of the time, but he’s also barreling the ball 15.6% of the time, and both his .300 xBA and .564 xSLG are in line with his actual numbers. He’ll cool off eventually, but currently this doesn’t look like a serious problem for the Mariners, and there’s still hope that Robles can return in September to provide support.
Cardinals
Jordan Walker entered the 2023 season as a 60-FV prospect ranked no. 12 on our Top 100 list, but in parts of three seasons, he’s produced diminishing returns, including a meager .210/.267/.295 (60 wRC+) with a 33% strikeout rate in 191 PA this season. He’s been largely absent from the lineup since late May, first missing a couple of weeks due to inflammation in his left wrist, then enduring a bout of appendicitis in late June. While on his latest rehab assignment, the Cardinals are again tinkering with his swing, but so far, he’s gone just 7-for-46, albeit with five extra-base hits, at Double-A Springfield and Triple-A Memphis.
Walker’s still just 23, but it’s fair to wonder if he’ll ever live up to that lofty prospect billing, at least in St. Louis. The good news for the Cardinals is that Alec Burleson has taken over right field and absolutely raked, hitting .333/.374/.592 (158 wRC+) in 138 PA. Overall, the 26-year-old lefty has hit .293/.340/.466 (125 wRC+), though he could use a platoon partner; he has a career 52 wRC+ against southpaws.
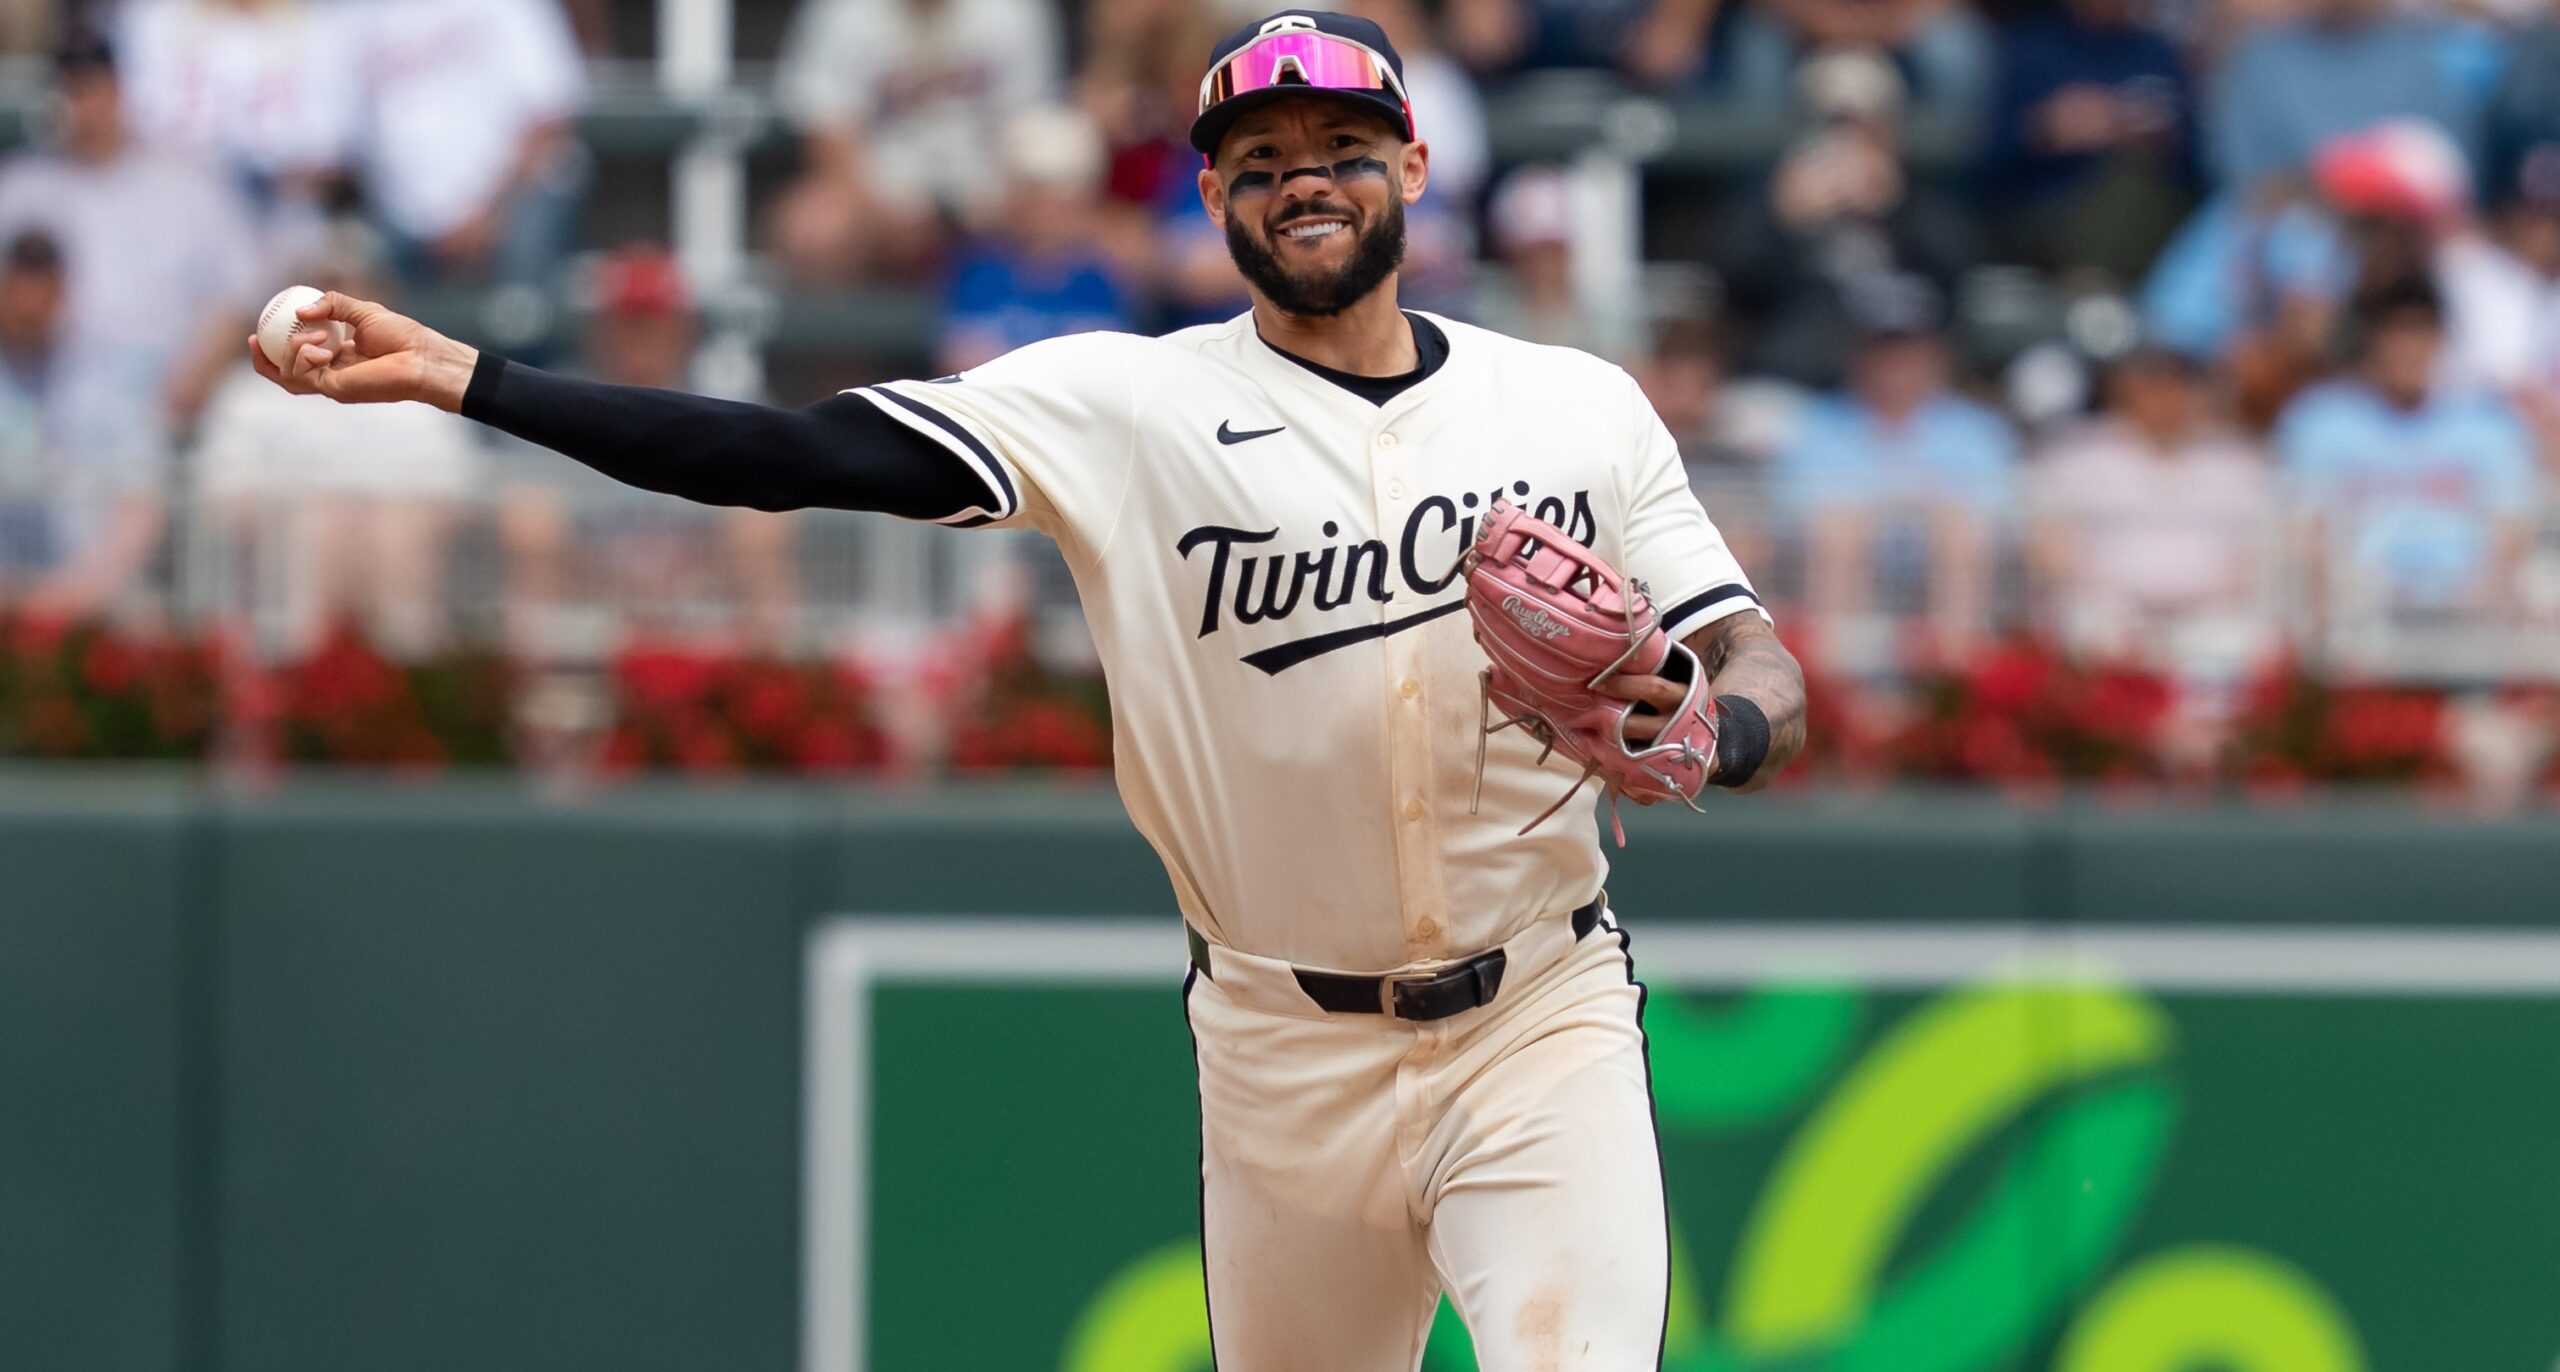
Twins
Matt Wallner can mash. In 2023 and ’24 combined, he hit .254/.371/.515 (148 wRC+) with 27 homers in 515 PA for the Twins, even while striking out a whopping 34% of the time and spending chunks of both seasons in Triple-A. The Twins hoped that he could approximate that production across a full season, but a mid-April hamstring strain curtailed his strong start; he didn’t return until May 31 and has managed just a 91 wRC+ since. His overall line (.205/.299/.449, 107 wRC+ with 10 homers) in 41 games in right and 12 at DH rates as a disappointment. He’s getting under too many balls; his 21.8% infield fly ball rate is the second-highest of any player with at least 150 PA. Trevor Larnach, who covered right for part of Wallner’s absence and has lately been sharing the job, has hit a modest .245/.311/.415 (102 wRC+) while playing 34 games in right plus another 59 at DH and in left field. Willi Castro, the only other Twin with at least 20 PA as a right fielder, has struggled in his time there (28 games but just 15 starts) but has hit for a 124 wRC+ overall in his utility role.
Considering this is now the fifth position at which the Twins have made a Killers list, it’s clear they’ll have to solve some problems from within in order to challenge for a playoff spot. Despite his struggles, Wallner’s recent track record provides more reason for optimism than, say, Ty France at first base.