A lot has happened in the past week. When times were simpler, back when the Phillies signed David Robertson three lifetimes and somehow only two weeks ago, I raised the possibility that we might bring back the We Tried tracker for the trade deadline. It wasn’t a sure thing, because the trade deadline isn’t really the time for We Trieds. They tend to happen over the offseason, when news is slow and multiple teams are bidding on free agents – which is why Robertson had so many reported suitors – rather than when teams are trying to swing trades. Loose lips can sink the many relationships involved in trades, and in the aftermath of the draft and deadline, everyone’s too busy to reach out to a reporter with an unattributed attempt to assure fans they made an effort. At least that’s how it normally works. This deadline featured a record-setting number of trades, and a surprising number of We Trieds to go along with all the actual action.
I’m sure I didn’t catch every We Tried, mostly because I spent the entirety of the deadline with my head down writing up transactions, listening to intense film scores in order to push me to write faster. I didn’t have much time to comb headlines and social media, but I did have help from some friends. I offer special thanks to readers JD, Elizabeth, Joel, and Fox Mulder Bat Flip for sending We Trieds my way. If you’re aware of any that I missed, as always, you can let me know on Bluesky or by email at WeTriedTracker@gmail.com. Read the rest of this entry »
When the Red Sox acquired Dustin May from the Dodgers at Thursday’s trade deadline, they brought on board a starter with a pair of elbow surgeries in his rearview. The 27-year-old right-hander had Tommy John in 2021, then needed to have a flexor tendon repaired in 2023. Boston also brought on board a pitcher who has matured admirably since he was drafted 101st overall in 2016 out of a Justin, Texas high school.
“As a pitcher, I haven’t changed a whole lot,” May told me prior to the trade. “My stuff is pretty comparable to what it was before. But off the field, I’ve changed a lot. A lot of life changes have happened through the surgeries — a lot of good things — and I feel like I’ve definitely improved as a person and as a husband.
“We’re all very blessed, and talented, to be here,” he added. “Stuff can be taken away from you in an instant, and you can have no control over it. No matter how hard you work, or what you put into it, life can come at you very fast at times.”
A serious health scare last summer is an example. May suffered a torn esophagus that required emergency surgery. Less scary, but nonetheless troublesome, was his not bouncing back from TJ as well as he’d hoped. Read the rest of this entry »
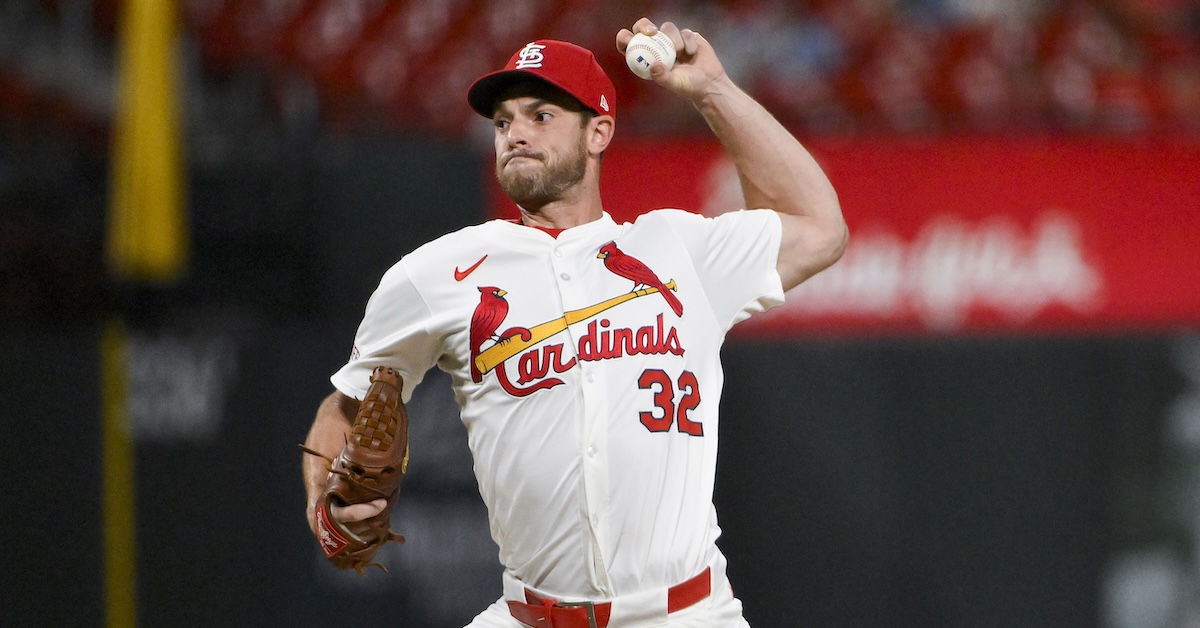
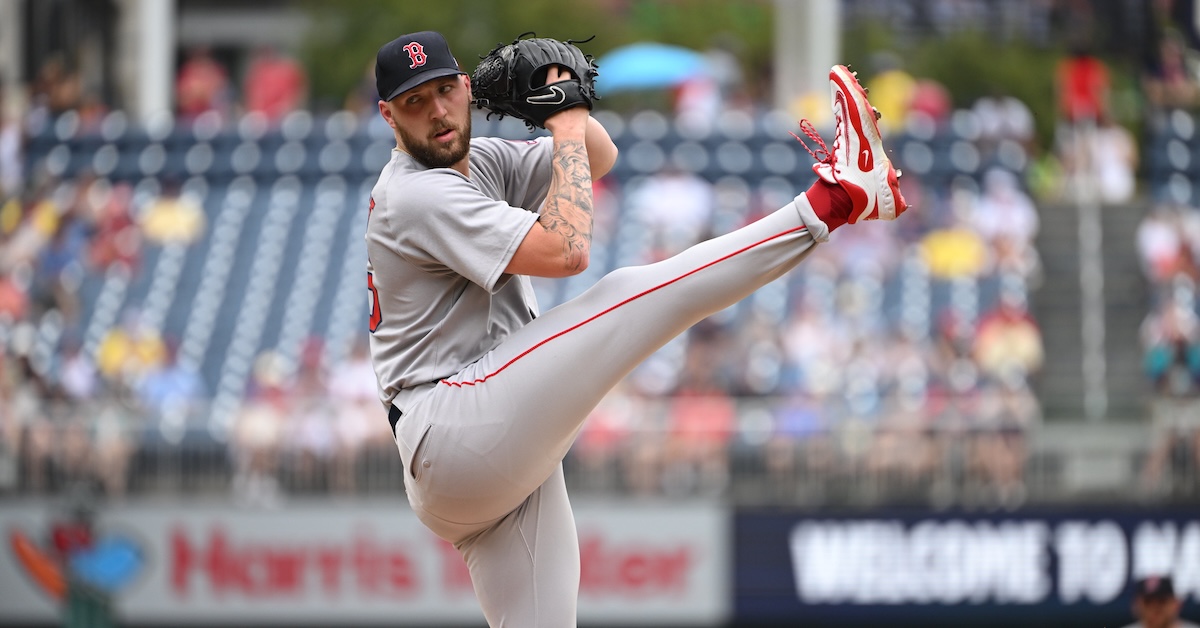
In a deadline where things are shaping up to be a little spicier than anticipated — Mason Miller for Leo De Vries and friends, holy cannoli — Steven Matz’s arrival in Boston in exchange for first base prospect Blaze Jordan feels destined to get swept under the rug. But wait, don’t look away yet. This season, Matz shifted to short-term relief work for the first time in his career, and the results have been impressive. In 55 innings, he’s delivered a 2.87 FIP, mostly on the strength of a minuscule 4% walk rate and excellent home-run suppression.
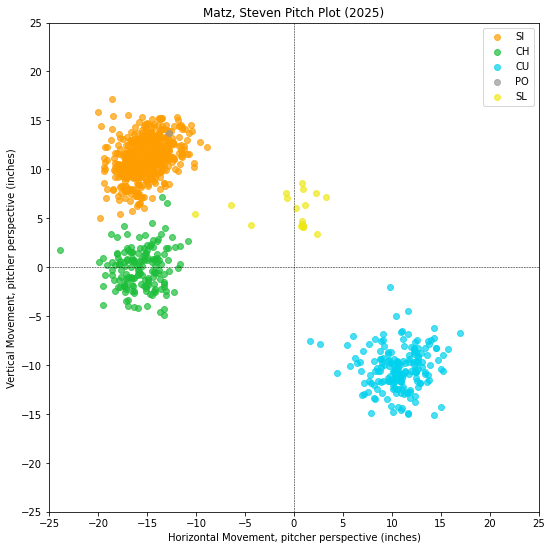
Matz hasn’t really overhauled anything about his arsenal with his move to the ‘pen. His heater is up maybe a tick, but it’s still the same fundamental Matz package, remarkably unchanged since his 2015 debut: heavy sinker usage, a slow two-plane curveball, and a changeup to mix in against right-handed hitters:
The lateral movement and lack of carry on his sinker makes it a somewhat ineffective pitch against righties, but those same qualities render it a weapon against lefties. Same-handed hitters are hitting .179/.216/.226 against Matz this season, good for just a .199 wOBA. Among pitchers who have thrown at least 250 pitches to lefties this season, he ranks 13th best in wOBA allowed.
Early in counts, Matz pounds the outside edge with that sinker. The precision aim — he zones the pitch nearly 65% of the time while aiming for a fine target — gets him a ton of called strikes, allowing him to frequently work with count leverage. Armed with an edge, Matz deploys his loopy curveball as his preferred put-away option. It doesn’t get a ton of whiff, but it’s also tough to elevate. And if he sneaks it through the front door, there’s just no way a hitter is swinging:
From a roster fit perspective, the move seems a bit curious. According to RosterResource, Matz will be the fifth lefty in Boston’s ‘pen. Aroldis Chapman is the closer, so he doesn’t really count, but between Justin Wilson, Brennan Bernardino, and Chris Murphy, it may look like the Sox are well-covered on the lefty specialist front. But a closer look suggests why they might not want to stand pat with that crew.
Let’s take them in reverse order. Murphy is an up-down guy, throwing just 16.2 innings in the major leagues this season. Alex Cora and co. probably aren’t going to feel comfortable thrusting a guy that green into high-leverage work during a big playoff series. He might even get optioned to clear room for Matz.
Bernardino is a guy who has been around a while, and does have a prototypical lefty-killer arsenal: a sinker that hovers around the zero induced vertical break line from a super-low release point, and a “curveball” (it’s a sweeper) that breaks nearly three feet in the other direction.
The problem? Bernardino sits 91 mph and walks a ton of guys. Thinking about a future where the Red Sox need to get through, say, Josh Naylor and Dominic Canzone to stave off an ALCS sweep at the hands of the Mariners, it’s a bit scary to have a guy throwing 91, with the distinct potential of walking two of the three hitters he is obligated by law to face. By contrast, Matz feels like a trusty pair of hands — he’s got the fourth-lowest walk rate among relievers with at least 40 innings pitched this year, and he’s a veteran with big-game experience.
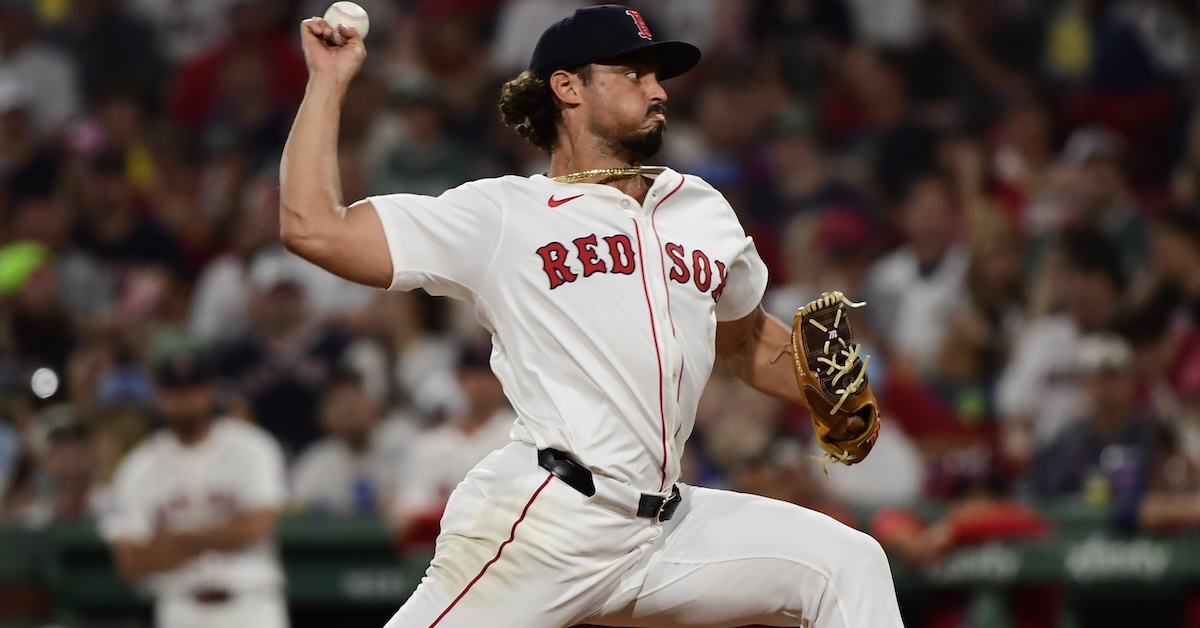
But there is a third lefty, and he’s one of the dozen pitchers who’s actually been better against lefties this season than Matz. Wilson isn’t exactly Tim Hill. He throws from a high slot and gets a ton of fastball carry, and he pairs his heater with an 88-mph bullet slider he throws below the zone for whiffs. Even though it looks like a platoon-neutral north-south attack package, he’s been much better against left-handed hitters than righties, holding them to just seven hits (one double, zero homers) and five walks in 63 chances. Matz, at first glance, seems a bit redundant given the presence of Wilson. But I’ll get back to that.
As for the return: The Red Sox are sending Blaze Jordan to the Cardinals. On short-form social platforms, I saw a not-insignificant share of Boston fans lamenting the departure of such a premium prospect. Perhaps the enthusiasm can be attributed to his 80-grade name, or the sterling stats he posted in Double-A Portland earlier this year. The reaction suggests Jordan is an incredibly valuable prospect, not someone who Eric Longenhagen (favorably) compared to Ryon Healy in a recent write-up.
Jordan’s numbers in the high minors, as Eric noted, are impressive, and he’s relatively young for the level. But… well, instead of summarizing Eric’s report, I’ll just paste it here:
The chase is concerning when you’re talking about a bad corner defender. So many toolsier guys have been undone by that and that alone. Jordan is slow-of-foot and has well below-average range at third base, though he does other stuff well and could play there in a pinch. He has mostly played first base in 2025, and that’s his better position. Low-OBP first basemen need to have titanic power to be impact players, and while Blaze has meaningful pop, it’s not in Yordan Alvarez territory or anything like that.
Eric put a 40 FV grade on Jordan, which seems like a totally fair return for a reliever like Matz.
The last bit that’s curious about this deal: There just aren’t that many good left-handed hitters on the likely American League playoff teams. Of the teams with at least 15% playoff odds, there are only five qualified lefties with at least a 120 wRC+: Cody Bellinger (133), Riley Greene (133), Trent Grisham (127), the aforementioned Naylor (122) and Zach McKinstry (121). (Corey Seager, Jazz Chisholm Jr. and Addison Barger just missed the plate appearance cutoff, while Yordan Alvarez has yet to be activated from the IL.) That’s not exactly a murderer’s row. Given the lack of lefties in the way of their pursuit of a pennant, it does make one wonder why Boston would load up on lefty specialists.
But perhaps Boston is thinking optimistically. What if they find themselves in the first game of the World Series, and there are runners on first and second, and it’s the fifth inning, and Shohei Ohtani and Freddie Freeman are due up, and they need Wilson for the next time through the order. Hey, it’s a long shot — but if it comes through, the Red Sox will be awfully happy to have a reliable Matz in their pocket.
Jordan Hicks wasn’t yet reaching triple digits when our 2017 St. Louis Cardinals Top Prospects list was published in January of that year. Ranked 14th in the system at the time, the 2015 third-round pick out of Texas’s Cyprus Creek High School was throwing — per Eric Longenhagen — a comparably modest 96 mph. That soon changed. The high-octane right-hander went on to eclipse the 100 mark that summer, and early the next season he was clocked at 105 while pitching in the big leagues against the Philadelphia Phillies.
He’s since ridden a bit of a rollercoaster. Hicks followed a solid 2018 rookie campaign by logging 14 saves and a 3.14 ERA over two-plus months in 2019, but he blew out his elbow in June and underwent Tommy John surgery. As a Type-1 diabetic, he sat out the entire 2020 pandemic campaign. More elbow woes cropped up in 2021, limiting him to just 10 big league innings.
Changes of address have been notable in Hicks’ subsequent seasons, as have his job descriptions. The righty remained a reliever throughout 2023 — a year that saw him dealt from the Cardinals to the Toronto Blue Jays at the trade deadline — but he was then converted to a starter after signing as a free agent with the San Francisco Giants prior to last season. His success in that role having been a mixed bag, Hicks now finds himself back in the bullpen — with yet another team. Acquired by the Boston Red Sox as part of last month’s Rafael Devers trade, he has gone on to make nine appearances and register a pair of saves while allowing four earned runs over seven 1.3 innings. His fastball velocity has topped out at 101.5 mph.
What did his 2017 FanGraphs scouting report look like? Moreover, what does he think about it all these years later? Wanting to find out, I shared some of what Eric wrote and asked Hicks to respond to it.
———
“A relatively undercooked prep arm from the 2015 draft.”
“Undercooked? I guess if you’re cooking a steak and you want it medium, I was rare,” Hicks said of that quote. “I didn’t have a lot of innings. At that point I had only thrown around 50 innings, and another 50 in high school. So, it was maybe 50 varsity innings and 50 pro innings. I think that’s probably what he meant by that.”
“His fastball sits 90-94, will touch 96, and comes in at an odd angle with some late sink.”Read the rest of this entry »
Location: Boston, MA, United States Department: Baseball Operations Status: Full-time
DEPARTMENT OVERVIEW:
Members of the Baseball Systems team at the Boston Red Sox are focused on designing, building, and refining the software and data pipelines used within Baseball Operations. These tools and applications are an integral part of the decision-making process, are directly integrated in the workflows of all departments within Baseball Operations, and provide an efficient, consistent, and accessible experience when interacting with our internal data sources and applications.
POSITION OVERVIEW:
The Boston Red Sox are seeking a Senior Data Engineer, Baseball Systems who is a hands-on database expert responsible for administering and optimizing large-scale SQL environments, building robust data pipelines, and ensuring high-performance access to critical baseball operations data across on-prem and cloud platforms.
The ideal candidate thrives in a fast-paced environment, is comfortable managing both modern Snowflake-based pipelines and legacy SQL Server systems, and brings a strong sense of ownership to delivering scalable, efficient, and maintainable data solutions that directly impact decision-making throughout Baseball Operations. This role is central to the reliability and evolution of the Red Sox’s data infrastructure, supporting analysts, developers, and systems engineers across player evaluation, baseball sciences, and scouting domains.
RESPONSIBILITIES
Administer and optimize Snowflake and SQL Server environments, including warehouse sizing, query tuning, and access control policies
Develop robust data transformation pipelines, leveraging data from both APIs and file-based sources
Leverage tools like dbt, Snowpipe, and Snowpark for data transformations
Design, manage, and monitor data pipelines that move structured and unstructured data from Azure Blob Storage into Snowflake, ensuring reliability, performance, and cost-efficiency
Maintain and modernize legacy SQL Server data pipelines, improving performance through query optimization, indexing strategies, and resource tuning
Contribute to the infrastructure design and software lifecycle phases—including technical design, testing, implementation, and quality assurance
Provide proactive support for critical production systems, resolving pipeline or performance issues quickly and effectively
Partner with software developers, analysts, and other stakeholders to support analytical, operational, and reporting needs across Baseball Operations
Participate in code reviews, architecture discussions, and DevOps best practices with the data engineering and software development teams
COMPETENCIES
Aptitude and ability to apply academic or applied experience in software development or data engineering related field.
An advanced understanding of modern databases, SQL and query optimizations, stored procedures, views, and other db objects
Able to design data solutions to allow for cost-effective, scalable, fast, and flexible solutions to support front-end development, analyst work, and data health and monitoring needs
Able to pick up quickly and think both creatively and critically to solve problems
A basic understanding of contemporary baseball and/or sports analysis and development practices
A team-player that collaborates effectively with technical and non-technical stakeholders
ADDITIONAL QUALIFICATIONS
Bachelor’s degree in Computer Science, Software Engineering, Computer Engineering, or a related technical field
3-5 years of experience in a data engineering or data platform role with a focus on database performance and pipeline reliability
Strong SQL development and optimization skills, including experience with stored procedures, indexing, and query tuning in SQL Server
Hands-on experience administering and developing in Snowflake, including warehouse scaling, role-based access, and usage monitoring
Proficiency in building and maintaining data pipelines from Azure Blob Storage to Snowflake, using tools like dbt, Snowpipe (or equivalent)
Solid understanding of ELT/ETL concepts and data architecture best practices across cloud and hybrid systems
Familiarity with DBT for data transformation and modeling is strongly preferred
Experience with GraphQL is a plus but not required
Ability to work autonomously and as a team in a fast paced environment
High level of attention to detail with the ability to multi-task effectively
Comfortable working remotely when required and using Zoom, Teams, Slack, Trello, and other tools to communicate with all team members
High degree of professionalism and ability to maintain confidential information
Excellent organizational and time management skills
In addition to the above requirements, all roles within Baseball Operations are expected to effectively demonstrate our universal competencies related to problem solving, teamwork, clarity of communication, and time management, along with embodying our culture of honesty, humility, relentlessness, and commitment to DEIB.
In addition to the above requirements, all roles within Baseball Operations are expected to effectively demonstrate our universal competencies related to problem solving, teamwork, clarity of communication, and time management, along with embodying our culture of honesty, humility, relentlessness, and commitment to DEIB.
Yesterday, I wrote up the news that David Robertson had signed with the Phillies. In my (and, I assume, everyone else’s) favorite paragraph, I mentioned that several teams had reportedly been in on the veteran right-hander. Ken Rosenthal and Jon Heyman combined to mention interest from the Mets, Yankees, Red Sox, Tigers, and “many others.” Depending on your perspective, this marked either the last We Tried of the 2025 free agency period or the first of the trade deadline period. As a quick refresher, We Tried is a catch-all term for any time we find out, after a player has ended up with one team, that another team also tried to land them. In its purest form, the We Tried is a front office’s bid for partial credit, an attempt to curry favor with the fans by demonstrating that it is trying to build a winner for them. I spent the offseason documenting each and every one in a disturbingly comprehensive spreadsheet.
I didn’t make a meal of this yesterday, mainly because Robertson’s free agency was a real outlier. The offseason ended months ago. He’s a 40-year-old reliever who didn’t get an offer he loved, so he stayed in shape and spent the spring hanging out with his family, then held a workout for teams on Saturday in order to sign before the deadline. Lots of teams were in on him and lots of teams showed up to watch him pitch, so word of who was there was bound to come out at some point. It definitely represented a We Tried, but it didn’t seem earth-shattering, and it was by no means a typical one. Read the rest of this entry »
Payton Tolle is the top pitching prospect in what is arguably baseball’s best farm system. Drafted 50th-overall last summer by the Boston Red Sox out of Texas Christian University, the 22-year-old left-hander features a fastball that Eric Longenhagen has assigned a 70 grade, and not just because of its high octane. Per our lead prospect analyst, the 6-foot-6, 250-pound hurler possessed “the 2024 draft’s most deceptive secondary traits,” which included seven-and-a-half feet of extension.
I asked Tolle about his four-seamer, which sat 95 mph when I saw toe the rubber for the Double-A Portland Sea Dogs versus the Hartford Yard Goats 10 days ago.
“The velo is something we’ve kind of driven hard ever since I got to the Red Sox org,” said Tolle, who was 90-92 in college and is now topping out at 98-99. “I’m buying into the system, buying into how the velo is going to change how everything looks. I also understand that more swing-and-miss is going to come at the top of the zone. At Wichita State, my first year, I felt like I was almost more sinkers, but then I switched up my grip. I brought my fingers closer together and started to have more ride on it.”
Tolle transferred from Wichita State to TCU for his junior year, where he — along with the Horned Frogs coaching staff — “really dove into how the fastball plays and what we can play off of it.” Since turning pro, that evolution has continued with a heavy emphasis on secondary offerings. Whereas his fastball usage as an amateur was often 70-75%, it has been closer to 50% in his recent outings. A work-in-progress changeup has become more prevalent — Tolle got bad swings on a few of them when I saw him in Portland — but a hard breaking ball is currently his top option behind his heater. Read the rest of this entry »
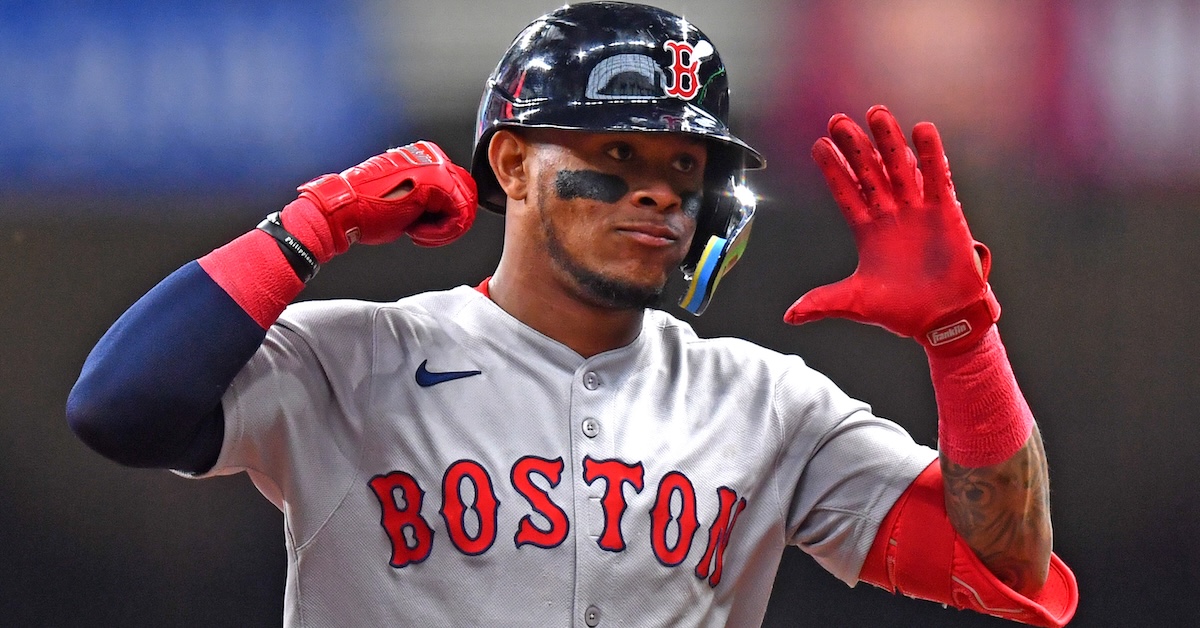
Ceddanne Rafaela’s breakout 2025 season has truly been a surprise. It wasn’t just that he ran a wRC+ of 80 in his first full big league campaign in 2024. It was how he got there. He ran the worst chase and strikeout rates of all qualified players. His contact rate and exit velocity ranked right near the bottom as well. He still looked like he could be a very good player by way of excellent defense in center field, but even though he was just 23, it raised real concerns about his potential at the plate. Beyond the fact that players haven’t historically improved their chase rates much after their rookie seasons, Rafaela’s chase rate was so extreme that it was hard to find someone to compare him to. A young player would be expected to refine his plate discipline some, but even if he had literally knocked an unheard of 10 percentage points off his chase rate, he still would’ve had the 12th-highest chase rate among all qualified players. And yet here he is now.
Rafaela has a 115 wRC+ and is on pace for 5.6 WAR this season. He has been the most valuable position player on the Red Sox. It’s probably helped that Rafaela has a year of experience under his belt and has been allowed to stick in center field all season, but this is a huge turnaround nonetheless. How did it happen? Let’s start at the beginning. Read the rest of this entry »
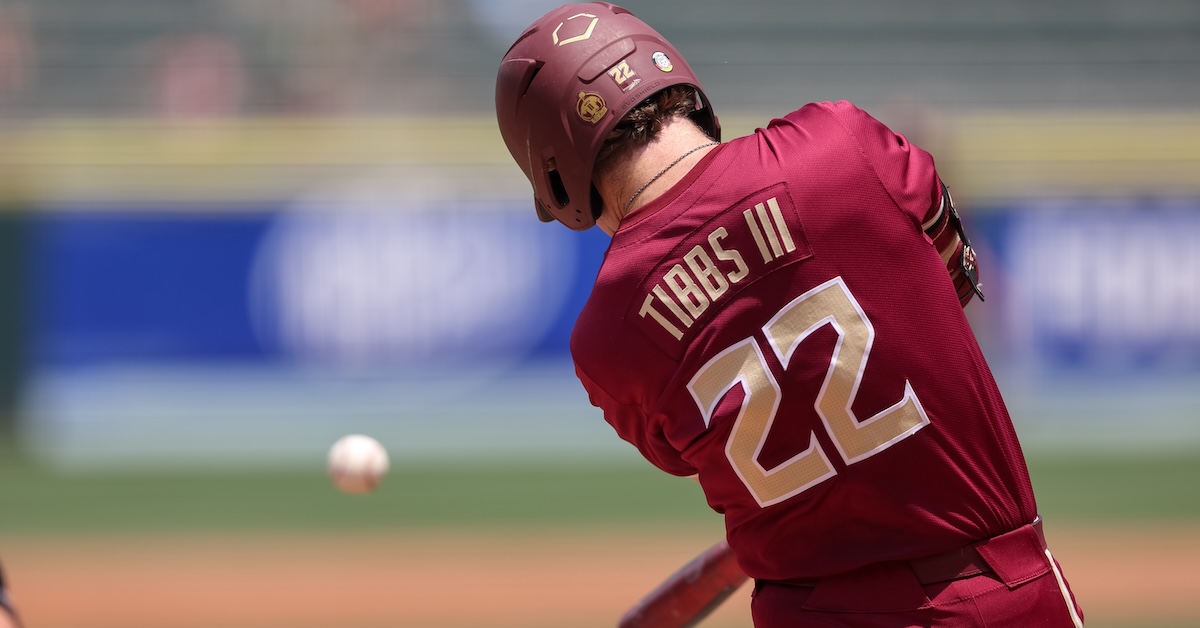
James Tibbs III might best be described as a hitting rat. Drafted 13th overall last year by the San Francisco Giants out of Florida State University, and subsequently shipped to the Boston Red Sox in last month’s blockbuster Rafael Devers deal, the 22-year-old outfielder lives and breathes baseball — particularly the part that entails standing in the batter’s box. From a young age, Tibbs has doggedly worked on honing his left-handed stroke.
An Atlanta native who attended high school in nearby Marietta, Tibbs excelled collegiately, slashing .338/.462/.685 over three seasons at the ACC school, with a 28-homer junior campaign further enhancing his profile. And he’s continued to hit in pro ball. He played just 26 games after inking a contract last summer, and his results were mixed; he posted a 153 wRC+ in nine games (42 plate appearances) in A-ball, earned a promotion, then went cold in High-A. Now in his first full professional season, he’s back to doing what he does best: bashing baseballs. Tibbs put up a 132 wRC+ with a dozen home runs in High-A prior to the trade, and since joining his new organization, he has logged a 107 wRC+ over 86 plate appearances while acclimating to Double-A.
Ranked 14th in what Eric Longenhagen called “the best farm system in baseball” when our Red Sox Top Prospects list was published in late June, the promising young outfielder was assigned a 45 FV, with raw power graded as his best hitting tool. Tibbs sat down to talk hitting prior to a recent Portland Sea Dogs home game.
———
David Laurila: You were drafted one year ago. Are you the same hitter now, or has anything meaningfully changed?
James Tibbs III: “I’m pretty much the same. It’s what’s gotten me this far, and I’ve kind of tried to replicate that as much as possible. I’ve never been one to try to make changes unless it’s absolutely necessary, because I play off of feel. I’ll make adjustments based off of that feel, but I’m doing it trying to get back to my base. My base has been pretty consistent for the last… three years? Two years? Something like that.
“I feel like I cover the plate well. I feel like I can see the ball well from where I stand and how I load. I feel like I use my body well in order to get to the spots that I can’t necessarily cover. So yeah, it’s been pretty consistent for the most part.”
When you think of Garrett Crochet, you probably think of a lanky lefty flinging filthy fastballs past flummoxed hitters. Nearly half the pitches Crochet threw last year were four-seamers. The pitch averaged 97.1 mph, and according to Statcast’s run values, it was worth 21 runs, making it the fifth-most valuable pitch in the game, trailing estimable offerings like Emmanuel Clase’s cutter and the sliders of Dylan Cease and Chris Sale. Crochet’s other pitches were worth a combined -2 runs. Although he ran a 3.58 ERA while pitching in front of a porous White Sox defense, the four-seamer led him to a 2.38 xFIP and 2.75 DRA. Both marks were the best among all starters. Crochet has kept right on rolling in 2025. He’s running a 2.23 ERA with a 2.40 FIP, and his 4.3 WAR ranks second among all pitchers. It would be easy to glance at the top line numbers and assume that Crochet is the same pitcher he was last year, just in front of a better defense. But there have been some subtle changes under the hood, and his relationship with his fastball now looks very different.
When a trade brought Crochet to Boston in December, the reasonable assumption was that he’d back off the four-seamer at least a little. Under Craig Breslow and Andrew Bailey, the Red Sox became the most fastball-averse team in the history of the game, throwing four-seamers and sinkers just 36.8% of the time in 2024. No one expected Crochet to ditch one of the game’s greatest weapons, but it stood to reason that the Red Sox might tweak his usage just a little bit in favor of his sweeper, his cutter, and his new sinker, all of which looked like excellent pitches. Read the rest of this entry »