Envelope Please: The 2025 Crowdsourced Trade Value Results
Two weeks ago, we launched our new crowdsourced trade value tool, which aggregated responses to simple “Which of these two players do you prefer?” questions to create a composite trade value ranking across our readership. With your help, we logged nearly 900,000 matchups – 897,035, to be precise. Now that the Trade Value Series is in the books, it’s time to see how the broader FanGraphs audience lined everyone up. Today, I’ll walk you through how to access and interpret your results, which can be found here, and share a few interesting tidbits about the places where the crowd and I agreed or differed.
Let’s start with the exercise itself. We sampled up to 500 results from each user’s set of submissions and threw them all into one big group of matchups. We ordered those matchups randomly, then used Elo ratings to turn the matchups into an ordered list. Then we redid the random ordering a total of 100 times and averaged the results, which got rid of Elo’s bias towards more recent matchups. That created a list of the crowd’s aggregate preferences. When you open the above link, the first thing you’ll see is your own results in full. I, for example, came pretty close to matching my official list:
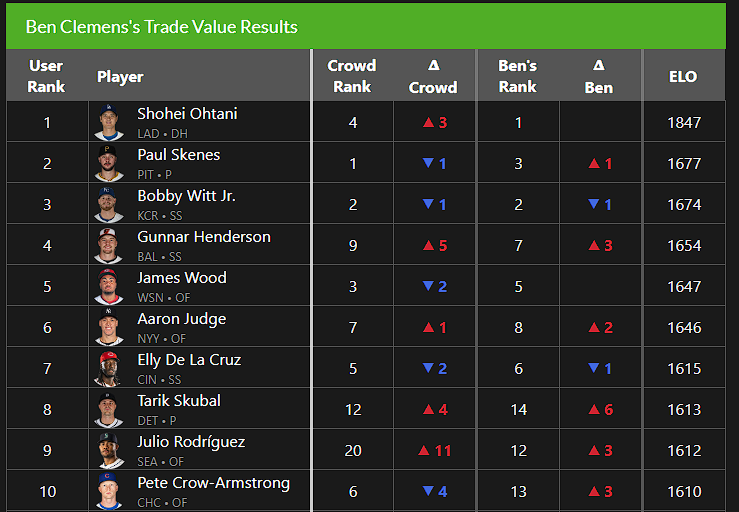
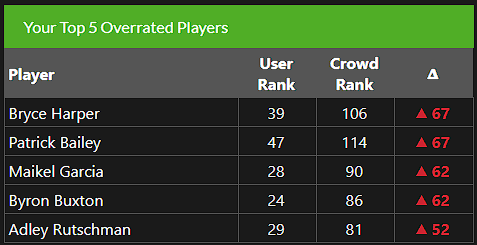
The page will show you how your list (naturally, mine is called “Ben Clemens’s Trade Value Results,” but yours will have your username) compares to both the crowd’s aggregate list and my official one. You’ll also be able to see the players you liked most and least relative to the crowd. Because of the way we designed this tool, the list can get a little bit weird in the middle (we give you fewer of those matchups), so don’t be alarmed if, say, Maikel Garcia ends up in your top 30:
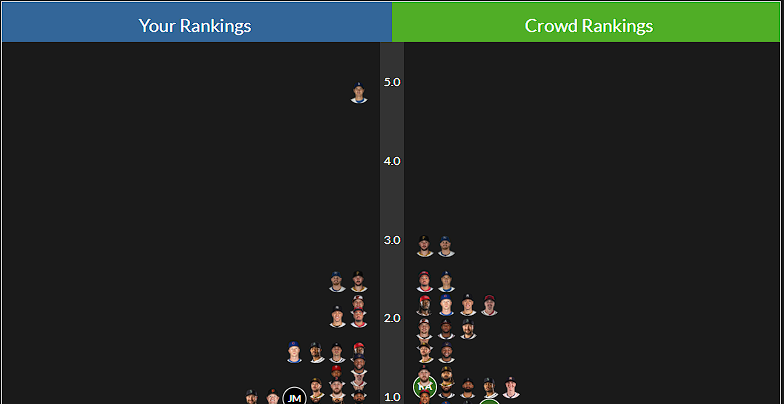
If you liked the tier system that I’ve used over the last two years of the Trade Value Series, you’re in luck. The “Graphs” option turns your rankings into z-scores and then uses those to make tiers. If you hover over a player’s face on that tool, you can see their Elo score based on the matchups you picked, as well as their numerical ranking. They’ll also be highlighted in the crowdsourced tiers over on the right so that you can compare your work to that of the group. These work based exclusively on those z-scores; everyone with a similar score gets grouped together. If, like me, you were much higher on one player than the rest of the group, you can see that clearly in the tiering:
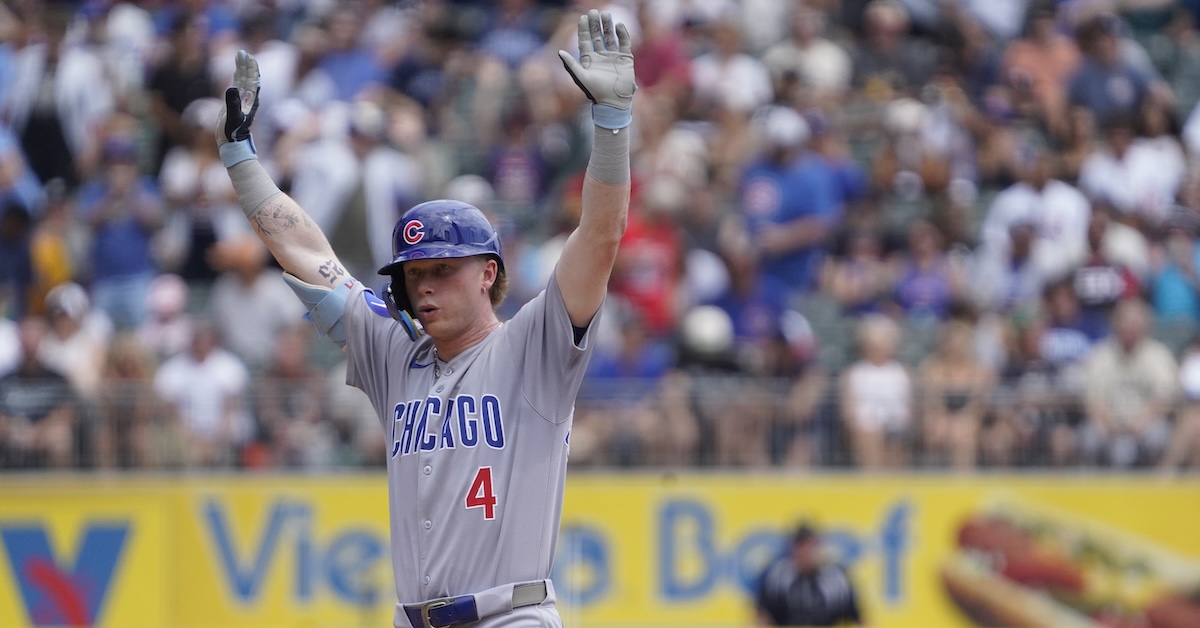
Finally, you can look at the full crowdsourced results and a full breakdown of how my list compared to the crowdsourced list in the tabs on the right. As I noted above, the individual lists might get a little bit funky in the middle, but the aggregate crowdsourced list is a big enough sample that the effect goes away. One thing I absolutely loved seeing is that my rankings and the crowdsourced rankings agreed on nine of the top 10 (I had Cal Raleigh, while you all had Pete Crow-Armstrong).
Now let’s take a peek at a few interesting tidbits to emerge from this exercise, starting with a list of the players who I was highest on relative to the crowd:
| Player | Position | My Rank | Crowd’s Rank | Difference |
|---|---|---|---|---|
| Logan Webb | SP | 16 | 27 | 11 |
| Will Smith | C | 18 | 46 | 28 |
| George Kirby | SP | 23 | 43 | 20 |
| Eury Pérez | SP | 26 | 39 | 13 |
| Spencer Strider | SP | 27 | 42 | 15 |
| Yordan Alvarez | DH | 28 | 64 | 36 |
| Alejandro Kirk | C | 29 | 52 | 23 |
| Adley Rutschman | C | 32 | 81 | 49 |
| William Contreras | C | 33 | 76 | 43 |
| Zack Wheeler | SP | 38 | 53 | 15 |
| Corey Seager | SS | 40 | 112 | 72 |
| Byron Buxton | CF | 41 | 86 | 45 |
| Jordan Westburg | 2B | 46 | 105 | 59 |
Boy, you guys sure do hate catchers! I wanted to come up with some broad generalizations here, and that’s the one that stands out. Will Smith barely being among the top 50 trade values in baseball only makes sense to me if you just don’t value catchers much at all, but that is definitely logically consistent with the rest of the crowd’s rankings. I thought my ranking of Raleigh – ninth – was already low, and he’s the only catcher where we’re even close (11th in the crowd’s rankings). I wrote at length about how I’ve tried to change my valuation of catchers, but clearly the crowd is far lower on anyone wearing the tools of ignorance. Likewise, if a player has been hurt recently, the crowd wasn’t into it. I think that’s quite reasonable. It shows different preferences, but that seems fine. Pushing Spencer Strider, Eury Pérez, and Yordan Alvarez out of the top 30 and towards the bottom of the top 50 because they’re currently either hurt or returning from injury makes sense, even if I chose differently.
After that, I think you’ll see some general disagreement on stars signed to big-money contracts. Corey Seager? Hugely unpopular with the crowd. The same was true of Zack Wheeler, which really surprised me, and Byron Buxton, whose contract and injury status are incredibly difficult to parse. Then there are just a few more stragglers: two pitchers who are command over stuff and play on the West Coast in Logan Webb and George Kirby, and then a strong disavowal of cheap team control in Jordan Westburg at 105th for the crowd. I’m higher on Westburg than industry consensus, but I think it’s fair to say that the crowd is far lower. After all, I showed this list to a bunch of folks in front offices, and they didn’t tell me that Westburg should fall out of the top 100.
And the plot thickens when we look to the list of players where I was lower than the crowd:
| Player | Position | My Rank | Crowd’s Rank | Difference |
|---|---|---|---|---|
| Pete Crow-Armstrong | CF | 13 | 6 | -7 |
| Jackson Chourio | OF | 24 | 14 | -10 |
| Junior Caminero | 3B | 25 | 18 | -7 |
| Bryan Woo | SP | 34 | 25 | -9 |
| Jacob Misiorowski | SP | 35 | 26 | -9 |
| Roman Anthony | OF | 42 | 17 | -25 |
| Zach Neto | SS | 43 | 36 | -7 |
| Wyatt Langford | OF | 44 | 28 | -16 |
| CJ Abrams | SS | 47 | 29 | -18 |
| Jacob Wilson | SS | 48 | 30 | -18 |
| Ceddanne Rafaela | CF | 50 | 33 | -17 |
If I had to generalize here, I’d say that the crowd is into the unknown more than I am. Roman Anthony in the top 20, Wyatt Langford and Jacob Wilson in the top 30; those are aggressive valuations for young players with short track records. I wrote extensively about how I think about the valuation for these guys in each of their blurbs, but the crowd clearly disagrees. There’s also a fair amount of defense and chase rate devaluation visible on my part here: plenty of shortstops and plus outfielders were more popular with our readers than they were with me. Looking at this list tells me that the crowd likes potential more than I do, which isn’t that surprising. Potential is really fun! One of the toughest parts of this exercise for me is reconciling the fact that the point of baseball is to win games with the unshakable feeling that the new is always better. The simplest explanation I can offer for this list of differences is that we dealt with that fact, well, differently. That said, “much higher on Jacob Wilson and much lower on Jordan Westburg” is a tough position to square, and I think it largely comes down to Wilson being the newer, shinier, more batting average-y option.
Finally, here are the crowd’s highest-ranked players who didn’t make my top 50:
| Player | Position | My Rank | Crowd’s Rank |
|---|---|---|---|
| Juan Soto | OF | NR | 24 |
| Spencer Schwellenbach | SP | NR | 34 |
| MacKenzie Gore | SP | NR | 35 |
| Jeremy Peña | SS | NR | 37 |
| Jackson Holliday | 2B | NR | 38 |
| Nick Kurtz | 1B | NR | 40 |
| Andy Pages | CF | NR | 47 |
| Cole Ragans | SP | NR | 48 |
| Cam Smith | OF | NR | 49 |
Most of my “just missed” cohort is on there; MacKenzie Gore, Jeremy Peña, Jackson Holliday, Nick Kurtz, Cam Smith, and Andy Pages all would have been in my top 60 if I ranked that deep. Likewise, all of these players other than Juan Soto are in the back half of the crowd’s top 50, where relative valuations are compressed. Gore at 35th is different than my ranking (51st), but not by a ton. If I had ended up with any of these players in my final rankings, it wouldn’t have felt weird; in fact, the crowd’s list looks pretty good to me. I will admit to a little confusion about some of the inclusions on this particular list, though. Soto is a great player on a big deal; having him 24th and then Seager outside the top 100 strikes me as odd. Likewise, Spencer Schwellenbach and Cole Ragans are each on the 60-day IL right now. I’m open to the idea that you could put them on the list despite those injuries, but I’m having trouble coming up with a throughline that simultaneously pushes those guys up the list and the Strider/Pérez/Alvarez group down. I’m not saying it’s impossible or anything, just that the aggregate preferences of the crowd can make for some weird groupings.
I also bet that if we did this exercise again today, Kurtz would finish a lot higher. Most of the voting in these things happens in the first few days. Kurtz had a 138 wRC+ at the All-Star break, which is when the tool debuted; by the time voting closed last Friday, an eight-game, 472 wRC+ stretch had his season line up to a 184 wRC+. I’d estimate his time-adjusted placement in the mid-20s, but it’s hard to say for sure. Those darn players, continuing to play while we try to rank them!
That’s basically it. You’ve done the hard work of ranking all these players; now you can play around with the results to your heart’s content. I even have a little bonus piece of data: the five closest matchups between top-ranked players. We directed our algorithm to set up more matchups between players who were at the very top of individual lists so that we’d have more data about who each user preferred among the best players in baseball, which means more of those matchups. Even with all that extra volume, however, these choices split right down the middle:
| Matchups | Player 1% | Player 1 | Player 2 | Player 2 % |
|---|---|---|---|---|
| 1,075 | 50.5% | Shohei Ohtani | Bobby Witt Jr. | 49.5% |
| 465 | 49.2% | Corbin Carroll | Elly De La Cruz | 50.8% |
| 220 | 49.1% | Tarik Skubal | Jackson Chourio | 50.9% |
| 499 | 51.5% | Aaron Judge | James Wood | 48.5% |
| 355 | 48.5% | Ronald Acuña Jr. | Gunnar Henderson | 51.5% |
| 637 | 48.0% | Pete Crow-Armstrong | James Wood | 52.0% |
| 312 | 47.8% | Tarik Skubal | Gunnar Henderson | 52.2% |
| 518 | 47.7% | Elly De La Cruz | Pete Crow-Armstrong | 52.3% |
| 248 | 52.4% | Tarik Skubal | Jackson Merrill | 47.6% |
| 453 | 47.5% | Corbin Carroll | Pete Crow-Armstrong | 52.5% |
Thanks again for your help in making this new tool useful – we couldn’t have done it without all of you. And of course, I’d like to offer one more round of thanks to Keaton Arneson and Sean Dolinar for designing and developing the crowdsourced tool and the results page. I hope you enjoyed stepping into my shoes for a week.
Ben is a writer at FanGraphs. He can be found on Bluesky @benclemens.
What an awesome idea and tool to play around with…thanks Ben!