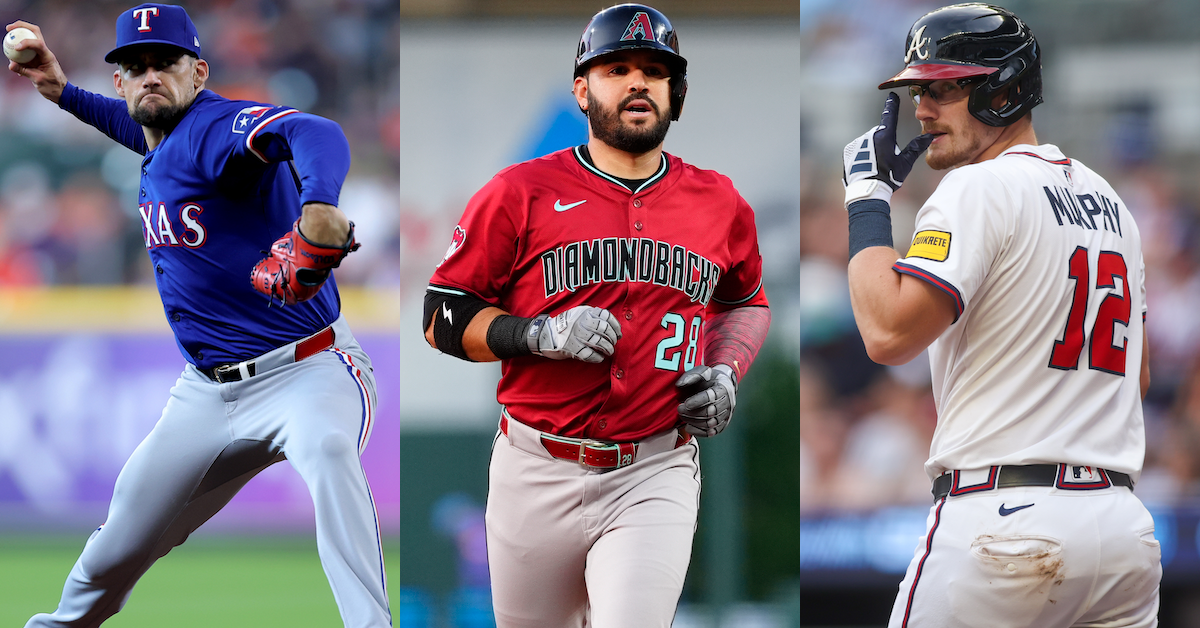
The weekend before the trade deadline was light on big names moving — poor Eugenio Suárez has probably had to take his phone charger out of his go bag a dozen times this month — but we did see plenty of preliminary action. The Orioles began their sell-off by shipping hard-throwing left-hander Gregory Soto up to the Mets. Meanwhile, the Royals sought to maintain their spot on the postseason wait list by picking up a right-handed bat from Arizona: not Suárez, but Randal Grichuk.
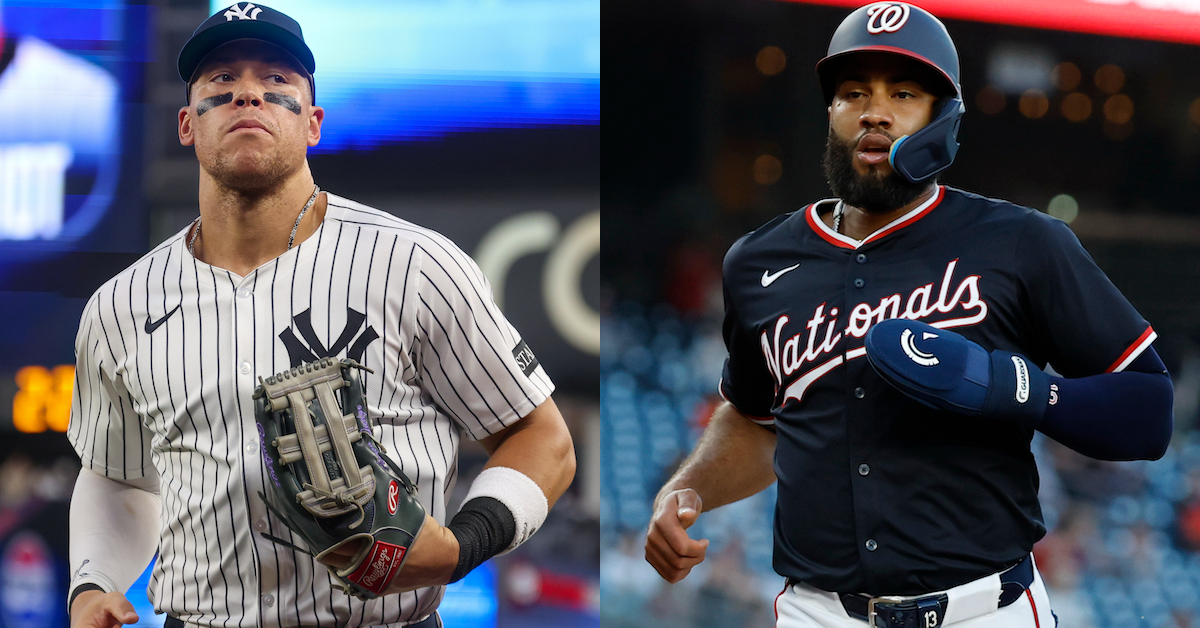
“All in all, we got good news today,” Yankees manager Aaron Boonetold reporters on Saturday. “I think all of us kind of feared the worst.” On Sunday, the good news Boone was referring to became official. The scuffling Yankees placed Aaron Judge on the 10-day injured list with a flexor strain in his right elbow, but not a torn UCL. Judge underwent an MRI on Saturday, and based on reports that the Yankees think Judge has a chance to miss only the minimum 10 days, it seems safe to assume that the imaging revealed only a minor strain. He has received a platelet-rich plasma injection and won’t throw for 10 days to two weeks. Crucially, returning after the minimum would also allow Judge to be back by the time of his bobblehead day on August 13. The Yankees also traded for utility player Amed Rosario on Sunday, but we’ll cover that move after addressing the news about Judge.
Concern about the elbow arose last Tuesday, when Judge was noticed grimacing after throwing the ball in to the infield. The right fielder did his best to tamp down concerns, telling reporters, “I make facial expressions all the time,” in his characteristic deadpan. He also downplayed the injury to the organization, trying to push off calls for an MRI. “You never want to go in the tube,” he said. But he DH’d on Wednesday and exhibited more discomfort on Friday. “Throwing is the main concern,” Judge said on Saturday. “Hitting happens too quick, and it’s not really the motion that I felt anything. I think the muscle that hurts is the muscle used to grip, so there might be some issues with that.” Over his past nine games, he’s batting .143 with a 35 wRC+. That stretch dropped his best-in-baseball 220 wRC+ all the way down to a still-best-in-baseball 208. According to Jon Heyman of the New York Post, the absolute best-case scenario is that Judge returns after 10 days, then needs just 10 days at DH before getting back to right field. Read the rest of this entry »
Reminder: Starting August 4, the price of a FanGraphs Membership is going up. You can find more information on the reason for the increase, as well as how to lock in our existing pricing, in the post below. As I noted when we announced the pricing change on June 10, Membership makes our work at the site possible, allowing us to add new site features and grow our staff, and it comes with a ton of great benefits. Since that announcement, we’ve launched a pitch-type splits leaderboard and a crowdsourced trade value tool, and we’ve added a full-time staff member. We know there is intense competition for your subscription dollars, but we think the breadth and depth of our coverage makes a Membership well worth it and still represents a considerable value in the sports media subscription landscape. I hope you’ll become a Member, and help us continue to build a better FanGraphs. Thank you for your support. – David Appelman
Over the last five years, as we’ve navigated a changing advertising landscape — not to mention the pandemic and a lockout — I’ve endeavored to be transparent about the state of the site, our business model, and our plans for the future. I’ve taken that approach because FanGraphs is a community, and I think our readers deserve to understand what we are doing and why. It’s been four years since we last increased the price of a FanGraphs Membership, and we’ve delayed this increase for as long as possible. We’ve not only seen considerable increases in our stat licensing fees and infrastructure costs, but this year we’ve also seen a steep decline in our advertising rates as well as our organic search traffic, as Google continues to push relevant websites further and further down the page in favor of new AI search results.
Beginning August 4, a yearly FanGraphs Membership will cost $80; a Monthly Membership will cost $15 a month, while a Three-Year Membership will cost $200. Since we won’t be introducing this change until August 4, you still have the opportunity to purchase a $60 Membership for the year, or upgrade your existing Membership to a $150 Three-Year Membership, allowing you to grandfather yourself into our existing pricing for the next three years. Read the rest of this entry »
Erik Williams, Ron Chenoy, Brett Davis-Imagn Images
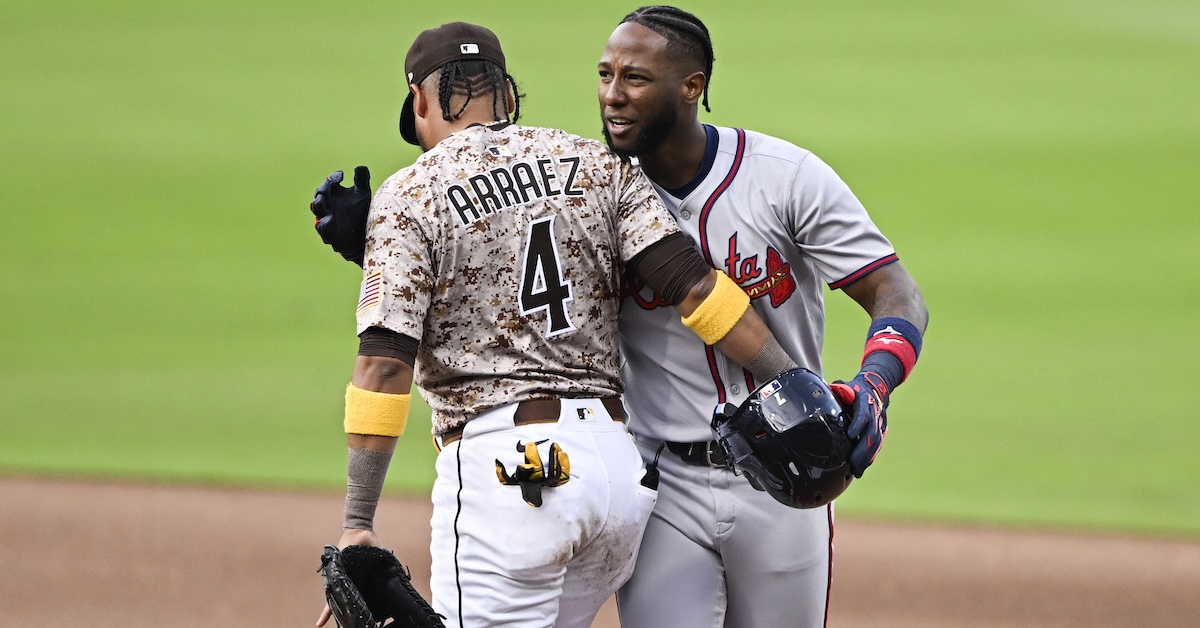
The trade deadline is nearing, and while we’ve had some recent activity — Josh Nayloris a Mariner! Ryan McMahon and Amed Rosarioare Yankees! — the general environment can be best described as “peaceful.” If this is anything like past years, however, that’s about to change as teams face up to their Artificially Designed Roster Construction Deadline anxiety. And while we don’t know exactly what will happen — and if you do, you should probably use that time machine for purposes better fit to benefit humanity — it doesn’t mean that we can’t do some fantasy tradecrafting. Asusual, I’ve conjured up some possible trade scenarios, trying to construct packages that are at least within the realm of plausibility. So get out your Hugwatch foam finger, read along, and maybe add your own ideas in the comments section!
For each player in the high minors or the major leagues, I’ve included their post-2025 projections while under contract — you can find their rest-of-2025 projections on their player pages. Read the rest of this entry »
Location: Boston, MA, United States Department: Baseball Operations Status: Full-time
DEPARTMENT OVERVIEW:
Members of the Baseball Systems team at the Boston Red Sox are focused on designing, building, and refining the software and data pipelines used within Baseball Operations. These tools and applications are an integral part of the decision-making process, are directly integrated in the workflows of all departments within Baseball Operations, and provide an efficient, consistent, and accessible experience when interacting with our internal data sources and applications.
POSITION OVERVIEW:
The Boston Red Sox are seeking a Senior Data Engineer, Baseball Systems who is a hands-on database expert responsible for administering and optimizing large-scale SQL environments, building robust data pipelines, and ensuring high-performance access to critical baseball operations data across on-prem and cloud platforms.
The ideal candidate thrives in a fast-paced environment, is comfortable managing both modern Snowflake-based pipelines and legacy SQL Server systems, and brings a strong sense of ownership to delivering scalable, efficient, and maintainable data solutions that directly impact decision-making throughout Baseball Operations. This role is central to the reliability and evolution of the Red Sox’s data infrastructure, supporting analysts, developers, and systems engineers across player evaluation, baseball sciences, and scouting domains.
RESPONSIBILITIES
Administer and optimize Snowflake and SQL Server environments, including warehouse sizing, query tuning, and access control policies
Develop robust data transformation pipelines, leveraging data from both APIs and file-based sources
Leverage tools like dbt, Snowpipe, and Snowpark for data transformations
Design, manage, and monitor data pipelines that move structured and unstructured data from Azure Blob Storage into Snowflake, ensuring reliability, performance, and cost-efficiency
Maintain and modernize legacy SQL Server data pipelines, improving performance through query optimization, indexing strategies, and resource tuning
Contribute to the infrastructure design and software lifecycle phases—including technical design, testing, implementation, and quality assurance
Provide proactive support for critical production systems, resolving pipeline or performance issues quickly and effectively
Partner with software developers, analysts, and other stakeholders to support analytical, operational, and reporting needs across Baseball Operations
Participate in code reviews, architecture discussions, and DevOps best practices with the data engineering and software development teams
COMPETENCIES
Aptitude and ability to apply academic or applied experience in software development or data engineering related field.
An advanced understanding of modern databases, SQL and query optimizations, stored procedures, views, and other db objects
Able to design data solutions to allow for cost-effective, scalable, fast, and flexible solutions to support front-end development, analyst work, and data health and monitoring needs
Able to pick up quickly and think both creatively and critically to solve problems
A basic understanding of contemporary baseball and/or sports analysis and development practices
A team-player that collaborates effectively with technical and non-technical stakeholders
ADDITIONAL QUALIFICATIONS
Bachelor’s degree in Computer Science, Software Engineering, Computer Engineering, or a related technical field
3-5 years of experience in a data engineering or data platform role with a focus on database performance and pipeline reliability
Strong SQL development and optimization skills, including experience with stored procedures, indexing, and query tuning in SQL Server
Hands-on experience administering and developing in Snowflake, including warehouse scaling, role-based access, and usage monitoring
Proficiency in building and maintaining data pipelines from Azure Blob Storage to Snowflake, using tools like dbt, Snowpipe (or equivalent)
Solid understanding of ELT/ETL concepts and data architecture best practices across cloud and hybrid systems
Familiarity with DBT for data transformation and modeling is strongly preferred
Experience with GraphQL is a plus but not required
Ability to work autonomously and as a team in a fast paced environment
High level of attention to detail with the ability to multi-task effectively
Comfortable working remotely when required and using Zoom, Teams, Slack, Trello, and other tools to communicate with all team members
High degree of professionalism and ability to maintain confidential information
Excellent organizational and time management skills
In addition to the above requirements, all roles within Baseball Operations are expected to effectively demonstrate our universal competencies related to problem solving, teamwork, clarity of communication, and time management, along with embodying our culture of honesty, humility, relentlessness, and commitment to DEIB.
In addition to the above requirements, all roles within Baseball Operations are expected to effectively demonstrate our universal competencies related to problem solving, teamwork, clarity of communication, and time management, along with embodying our culture of honesty, humility, relentlessness, and commitment to DEIB.
Austin Hays is having a productive-when-healthy season with the Cincinnati Reds. The 30-year-old outfielder has missed time with a calf strain, a hamstring strain, and a foot contusion, but he’s also slashed .282/.338/.510 with 10 home runs in 228 plate appearances. Moreover, his 128 wRC+ and .360 wOBA are both second on the team (behind Elly De La Cruz) among those with at least 140 PAs.
His résumé is that of a solid hitter. From 2021-2023— his first full seasons in the majors — Hays had 97 doubles and 54 home runs, as well as a wRC+ ranging between 106 and 111. Those three seasons were spent with the Baltimore Orioles, who subsequently swapped him to the Philadelphia Phillies in exchange for Seranthony Domínguez and Cristian Pache a few days before last July’s trade deadline. Hays’s 2024 campaign was the worst of his career. Hampered by injuries and illness — a kidney infection proved most problematic — he had a 97 wRC+ while playing in just 85 games. The Reds then inked him to a free agent contract over the winter,
Which brings us to the crux of this column’s lead item: the reasons behind the success he’s currently having.
“Consistency is probably the biggest thing,” Hays told me. “There’s not always an adjustment to be made. Sometimes it’s just the game [and] you’re being pitched tough. I don’t want to be altering too much of what I do well. In the past, I would sometimes pay too much attention to what the pitcher was doing and try to adjust to that. Staying strong to my strengths — locking in on those strengths — is going to help me over the course of 162 [games].” Read the rest of this entry »
This time next week, trade season will be over. We’ll know if the surging Brewers added another bat, if the Yankees, Mets and Dodgers did enough to address their injury-depleted pitching staffs, and which uniform Eugenio Suárez will be wearing the rest of the season. We’ll also hopefully have a better idea of where teams stand as we enter the dog days of August and look ahead to the September pennant chases.
For many teams, the games between now and Thursday’s deadline will carry the weight of the next two months, as their performance over that stretch will shape their strategy for the rest of the season. All of this makes for a most exciting week ahead of us. As always, we’ll be covering the chaos here at FanGraphs, analyzing trades big and small for our readers.
Before we get to this week’s mailbag, I’d like to remind all of you that while anyone can submit a question, this mailbag is exclusive to FanGraphs Members. If you aren’t yet a Member and would like to keep reading, you can sign up for a Membership here. It’s the best way to both experience the site and support our staff, and it comes with a bunch of other great benefits. Also, if you’d like to ask a question for an upcoming mailbag, send me an email at mailbag@fangraphs.com. Read the rest of this entry »
Ben Lindbergh, Meg Rowley, and Ben Clemens banter about the FanGraphs crowdsourced trade value tool, the Josh Naylor, Ryan McMahon, and Gregory Soto trades, the outlook for Eugenio Suárez, the fascinating Spencer Jones, and the lack of production by MLB rookies this season, then (58:30) discuss Other Ben’s player rankings for the fourth annual trade value series (plus a Nick Kurtz update).
McMahon was drafted by Colorado in 2013 and has spent his entire nine-year career with the Rockies; he ranks ninth in franchise history in games played. He is in the fourth year of a six-year, $70 million extension, and the Yankees will take on the rest of his remaining contract. He is owed a tad less than $4.2 million this season, and $16 million a year in both 2026 and 2027. At the time of the trade, the Yankees have an 88.8% chance of making the playoffs, but they’re 4 1/2 games back of the Blue Jays in the AL East after dropping two of three in Toronto earlier this week. New York could use a boost, and to say that McMahon has the potential to fill a position of need would be an understatement. Read the rest of this entry »
Rob Schumacher/The Republic-USA TODAY NETWORK via Imagn Images
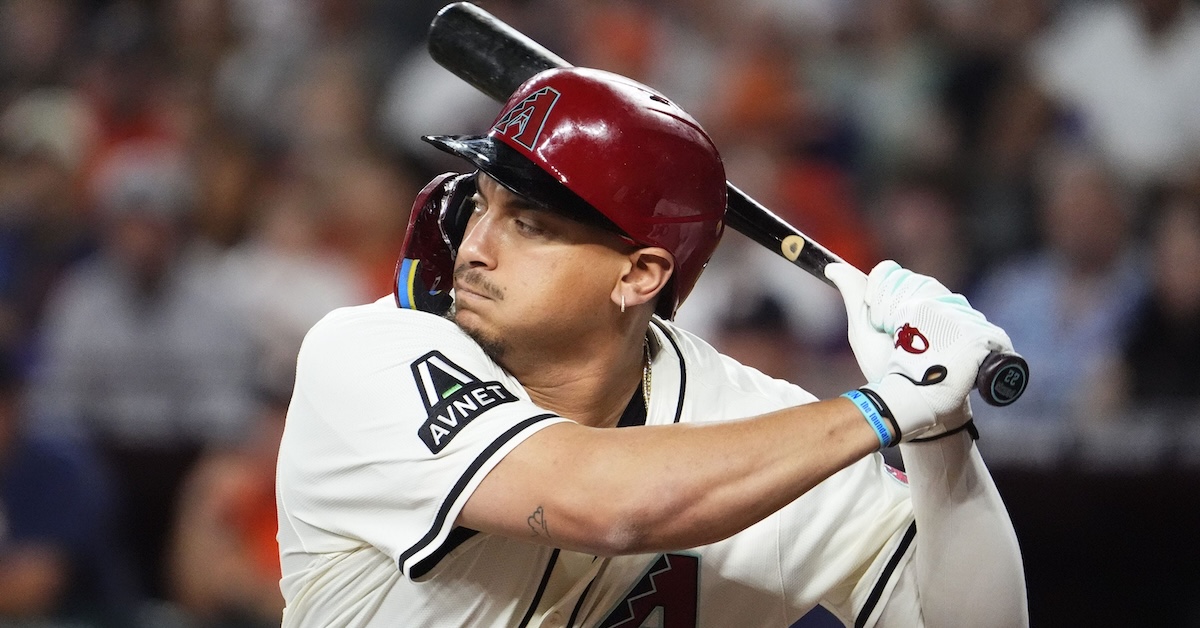
The deafening quiet of this year’s July trade market was disturbed on Thursday night with the announcement that the Seattle Mariners were acquiring first baseman Josh Naylor from the Arizona Diamondbacks. Naylor has provided more than respectable offense for the Snakes this year, hitting .292/.360/.447 with 11 homers, good for a 123 wRC+ and 1.4 WAR. Heading to the desert in return are two minor league pitchers, lefty Brandyn Garcia and righty Ashton Izzi.
While the Diamondbacks have generally disappointed in 2025, little of the fault can be placed at Naylor’s feet. The team expected to compete in 2025, but lost Christian Walker to the Astros in free agency, so the hope was that Naylor would fill the hole for a year before hitting the open market himself. He was never going to be an elite defensive first baseman like Walker, but the expectation was that he would at least provide a similar level of offense. Naylor is likely to fall well short of his career-high 31 homers from 2024, but he’s compensated for that by adding nearly 50 points of batting average, meaning his 123 wRC+ is actually slightly higher than his 119 mark from last season.
If the season ended today, the Mariners would make the playoffs as the second AL Wild Card, and the five-game separation between them and the division-leading Astros is not an insurmountable distance. Houston’s edge in the AL West seems even smaller when you consider how much of its lineup is currently out hurt. The injured quartet of Yordan Alvarez, Isaac Paredes, Jeremy Peña, and Jake Meyers would represent a huge chunk of any team’s offensive value. First base has been a particular source of trouble for the M’s this year, with their first basemen ranking in the bottom third in baseball with a combined 0.4 WAR. The original plan had been for Luke Raley to get the lion’s share of the playing time at first, mostly against righties, with fill-ins around him to take care of the southpaws. However, injuries to Mitch Haniger and Victor Robles thinned out Seattle’s corner outfield and DH depth and pushed Raley mostly to right field. As a result, the team was forced to give a lot of playing time to Rowdy Tellez; he posted an execrable .249 on-base percentage with the Mariners before they dropped him in June.
Naylor is not a superstar, so naturally, his acquisition doesn’t dramatically change the face of the AL West race. After last night’s win over the Angels, ZiPS gave the Mariners a 76% chance to make the playoffs and a 24% probability to win the division. These numbers would be 72% and 21% without the trade.
So, what’s the cost for their new first baseman? Neither Garcia, nor Izzi was torching up the prospect lists, but then again, Naylor is a free agent after the season, making this trade is a pure short-term rental. The 25-year-old Garcia has already made a brief major league debut, and since I don’t believe the Diamondbacks are going to go full rebuild, that has a lot of allure over the compensation draft pick they would have gotten if they’d held onto Naylor and he’d signed elsewhere this offseason. Garcia is a hard-throwing lefty sinkerballer with a three-quarters delivery who predictably induces a lot of grounders. My colleague Eric Longenhagen gave him a 40+ FV when Seattle’s top prospects list was published last month.
The ZiPS projections see Garcia as a solid, though unspectacular, mid-bullpen arm with at least some upside.
ZiPS Projection – Brandyn Garcia
Year
W
L
ERA
G
GS
IP
H
ER
HR
BB
SO
ERA+
WAR
2026
3
3
4.22
57
0
53.3
48
25
5
22
45
98
0.0
2027
3
3
4.10
56
0
52.7
47
24
5
21
45
101
0.1
2028
3
2
4.08
55
0
53.0
46
24
4
21
45
102
0.2
2029
3
2
3.92
46
0
43.7
39
19
4
17
37
106
0.1
2030
2
2
4.06
40
0
37.7
33
17
3
15
32
102
0.1
2031
2
1
4.06
33
0
31.0
27
14
2
12
26
102
0.1
ZiPS 2026 Percentiles – Brandyn Garcia
Percentile
ERA+
ERA
WAR
95%
128
3.23
0.7
90%
122
3.40
0.6
80%
114
3.65
0.4
70%
107
3.88
0.2
60%
102
4.06
0.2
50%
98
4.22
0.0
40%
93
4.43
-0.1
30%
90
4.59
-0.2
20%
86
4.83
-0.3
10%
77
5.36
-0.6
5%
71
5.82
-0.9
As a 21-year-old in High-A ball, Ashton Izzi has more developing to do than Garcia, but even with decidedly mixed results, the righty showed enough upside for Eric to also give him a 40+ FV. According to Eric, Izzi boasts a four-seamer that sits around 94 mph with solid movement. He gets “near elite” extension with his fastball, but it doesn’t generate many whiffs. Izzi also has a usefully average two-seamer, Eric says, as well as a sweeper and a cutter; the sweeper is a big swing-and-miss pitch for him. His changeup is mediocre, and Eric is concerned that Izzi will struggle to develop a good weapon to wield against lefties. Overall, per Eric, if Izzi can clear his developmental hurdles, he can make the majors as a starter.
In all, I think getting two real prospects, one who can impact the parent club immediately, is an absolutely fair return for Naylor. The Mariners have only two playoff wins over the last two decades, and now is the time to go all-in to add to that total. Their offense is better this season than in previous years, but they still needed to fill their hole at first base, and Naylor represents a major upgrade over what they had before.