The Night That Killed Extra Innings
The rumblings have started. On Tuesday night in the unincorporated territory north of Atlanta, the American League clawed its way back from a 6-0 deficit in the late innings, wrestling the All-Star Game into its first ever swing-off. The problem with the swing-off, the reason for the rumblings, was apparent even before the ninth inning ended: It might be too much fun. Too much fun could result in disaster, an eruption that would reshape the landscape of baseball for all time to come, killing extra innings once and for all and replacing them with something that smacked suspiciously of soccer.
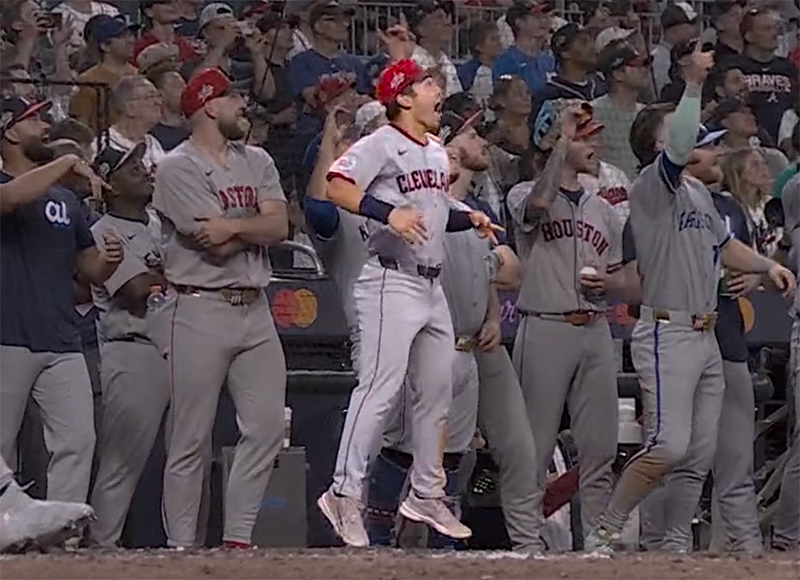
The protectors of baseball’s sovereign dignity chewed their fingernails to the quick as Brent Rooker readied himself in the batter’s box to the opening strains of “Hotel California.” They wailed when he launched two baseballs into the left-center field seats, thrilling everyone with eyes to see or ears to hear. Steven Kwan leapt into the air with the innocent delight of a child. It was a dark omen.
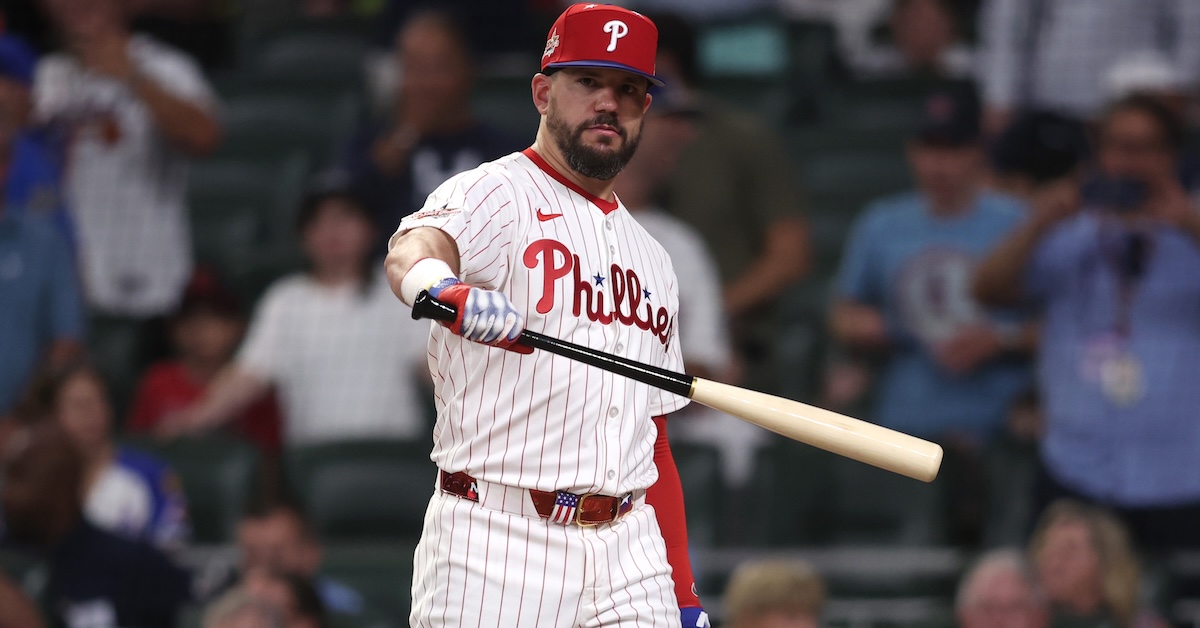
“Will no one think of the children?” moaned the traditionalists when Kyle Stowers punched one over the hulking brick wall in right center and jubilation reigned near Atlanta. Their fear reached a crescendo when Kyle Schwarber duck-walked into the box, leaned back, and shook his bat in all directions as if to ward off any evil, defense-minded spirits. Schwarber, who has spent his entire career smacking monstrous, momentous home runs as casually as the rest of us put our socks on in the morning, had the potential to alter baseball’s future, cementing the swing-off as a consummation devoutly to be wished, a future too fun to avoid. If any player could turn his three swings into three signature homers, it was Schwarber. Read the rest of this entry »