Rockies Sign Willi Castro

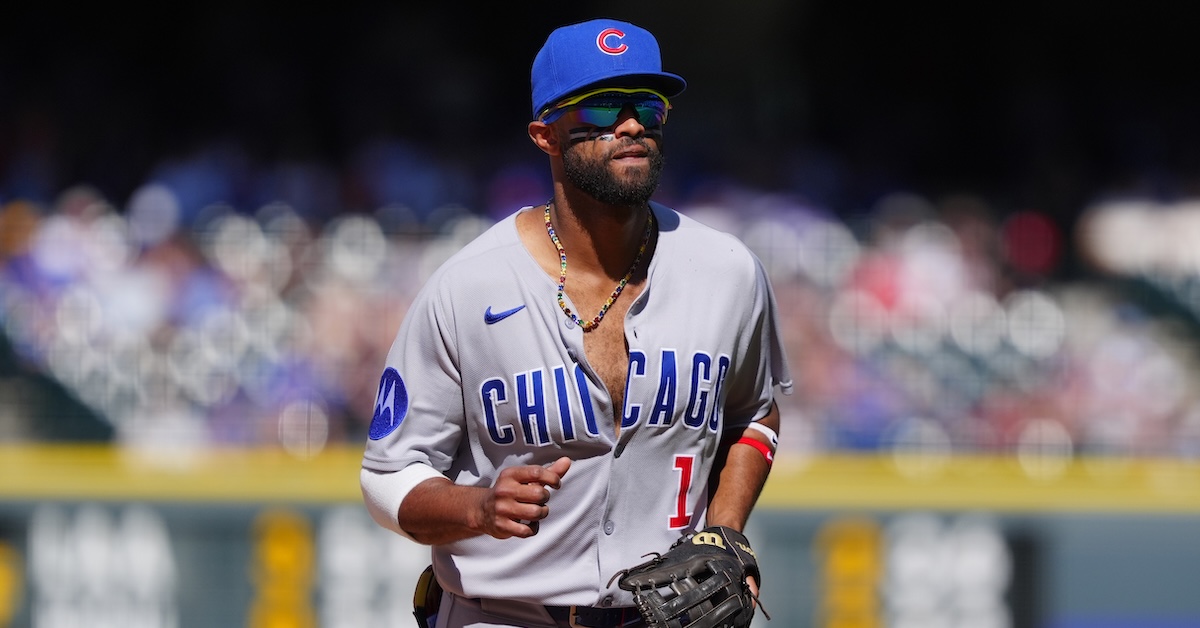
Our annual preview of free agency doesn’t include projected destinations for free agents. I don’t know if that has always been a site-wide editorial decision, but it’s one I wholeheartedly agree with. Predicting how much money someone will get is hard enough. Predicting which team out of many similar teams will give that money to them is essentially guesswork; sure, matching names to teams has entertainment value, but it’s hard to actually be good at it. Except, if you made me predict where Willi Castro would have signed before this offseason started, I absolutely would have picked the Rockies, and voila: Castro agreed to a two-year, $12.8 million deal with Colorado on Thursday.
The Rockies haven’t been players in free agency for a number of years, though that appears to be changing. Earlier this month, they signed Michael Lorenzen to a $8 million contract, the largest deal they’ve given to a pitcher in the 2020s. Castro’s deal is the biggest guarantee they’ve handed out to a free agent since Charlie Blackmon, and that hardly counts, what with him being a long-time Rockie signing the last deal of his career and all. Really, Castro is the team’s biggest signing since Kris Bryant, which says a lot about how the past few years have gone in Colorado.
What compelled the team to wade into the free agent position player pool – the shallow end, to be sure – for the first time in years? Signing a good major league player, that’s what. Castro is a versatile defender who won’t embarrass you offensively. In 2025 alone, he logged 100 innings at four different positions, plus cameos at shortstop and in center field. He’s not a standout at any of those spots, but the sheer flexibility is inarguably useful. Roster Castro, and you have a nice backup plan nearly everywhere. He’s a switch-hitter, too, so he can shore up any of the positions where you’d really prefer a platoon, regardless of who his platoon partner might be. Read the rest of this entry »