Ben Lindbergh and Meg Rowley banter about prospects who have (Jordan Walker, Anthony Volpe) and haven’t (Grayson Rodriguez, Brett Baty) made Opening Day rosters and MLB’s player-centric PSAs about the new rules, then complete their 2023 season preview series by discussing the Atlanta Braves (15:07) with Grant McAuley of 92.9 The Game, and the Colorado Rockies (53:50) with Danielle Allentuck of The Denver Gazette, plus a Past Blast from 1986 (1:26:07), trivia answers (1:30:00), a Stat Blast (1:31:34) about the biggest WAR gaps between Opening Day starters, the worst pitchers ever to start on Opening Day, and the best pitchers and hitters never to start on Opening Day, and a postscript (1:41:09).
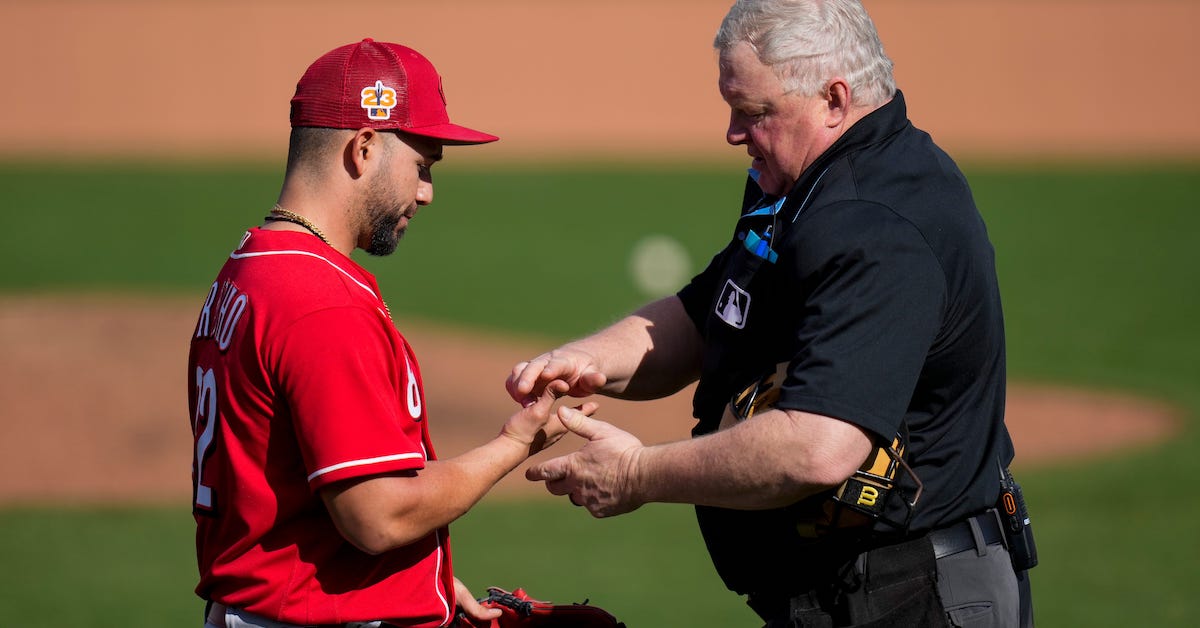
With baseball’s time of game issue resolved (I say with just a hint of hyperbole), MLB’s battle with sticky substances is back to being a top priority for the league offices, or so we can gather from the latest league-wide memo on the subject. After the first crackdown mid-season in 2021, we saw a pronounced dip in spin rates and spin-to-velocity ratio across baseball, an apparent sign that pitchers were responding to the league’s concerns. When the league renewed its commitment to inspecting pitchers at the start of the 2022 season, this impact appeared to persist through the early spring. But as the season went on, it was well-reported that league-wide rates began to creep back up, nearing pre-crackdown levels by August of last season.
While in 2021, two pitchers were issued the 10-game suspension MLB had promised in the event of a transgression, there were no such violations in 2022, only this weird moment between Madison Bumgarner and umpire Dan Bellino and this high-profile ear massage for Joe Musgrove courtesy of Buck Showalter in the deciding game of the NL Wild Card Series. But the league has taken note of the elevated rates and now means business: umpires are being empowered to check pitchers randomly and at will, urged to increase their scrutiny in “frequency and scope.” The memo seems to say: “no, seriously, please stop doing that.” Read the rest of this entry »
Earlier today, Kyle Kishimoto kicked off our reliever rankings. Now we’ll take a look at the bullpens projected to be baseball’s best.
There are some positions for which a cleaner, wider gap exists between the top teams and the bottom, where we can more definitively say that some teams are better than others. For instance, the combination of talent and depth that the Blue Jays have at the catching position separates them from the rest of baseball. Relief pitching is not one of these positions. Sure, we have the bullpens ranked, and you can see their statistical projections above and below, but be sure to notice how thin the margins tend to be here, and know that relief inning sample sizes are small enough that this is where WAR is the least good at properly calibrating impact and value. Things like managerial usage, depth, and roster flexibility tend to play a huge role in the way bullpens perform throughout a season, and those are factors we can’t totally control for here. Read the rest of this entry »
After wrapping up our position player rankings with the league’s designated hitters, we turn our attention to the pitchers, starting with the bullpens in the bottom half of the reliever rankings.
Relievers are really, really tough to project. From the tiny sample sizes of previous seasons’ work to uncertainty over a pitcher’s role and the wide variety of offseason mechanical and pitch mix adjustments they make in search of a big breakout, it’s uniquely difficult to accurately forecast the future effectiveness of individual relievers. Still, some relievers are clearly a cut above the rest, and a commonality among the teams in the bottom half of there rankings is that they don’t have many of them. Less than two wins separate teams no. 16 and 30, and in order to exceed their projections, they’ll be looking for their up/down or replacement-level arms to hit their high-percentile upside and factor as high-leverage options on their respective squads. Read the rest of this entry »
It’s always dangerous to put too much stock in spring training performances. Take last year for example. If you just went by spring training stats, you would have predicted Paul Goldschmidt for MVP (hey, pretty good!) and Patrick Corbin for Cy Young (I award you no points, and may God have mercy on your soul). All the same, with Opening Day on Thursday, it’s time to learn what we can from spring training performances. Luckily we have more Statcast data than ever, some of which stabilizes much faster than traditional performance stats. As of Sunday night, 1,650 batters have seen at last one pitch during spring training this year. 11 of the ballparks that have hosted spring training games are set up for Statcast, and we have exit velocity data on at least 15 balls in play for 199 players. That might not sound like much to go on, but there’s definitely some signal among the noise.
Here are the numbers: 188 players have had at least 200 PAs in one season, then the next season had at least 15 spring training BIP measured by Statcast and then took 200 regular-season PAs. On the left are the regular-season average exit velocities from season one to season two; on the right are the average exit velocities from season two’s spring training and regular season.
If you’re trying to predict regular-season exit velocity, you’d obviously rather have 200-plus PAs worth of information from last year (r=.71) than 15-plus BIP from this year’s spring training (r=.50). However, the correlation between spring training and regular-season exit velocity is still plain to see, and if you regress it with the previous season’s exit velocity, the correlation gets stronger still (r=.76). Spring training performance contains enough signal to identify some real standouts for further analysis.
In this article we’re focusing on three players who are surprising or otherwise notable, so apologies to established players like Pete Alonso, Francisco Lindor, Bo Bichette, Bryan Reynolds, and Ryan McMahon. Your baseball bashing has become humdrum and unexciting. Congratulations on your continued excellence, but please move along, because we need to talk about Jake Cave.
Jake Cave
In December, the Phillies claimed Cave off waivers from the Orioles, who had claimed him off waivers from the Twins in October. Over parts of five seasons in Minnesota, he posted a 92 wRC+ in 1,015 PAs. Since arriving in Clearwater, he’s posted a 61.5% hard-hit rate and 92.3 mph average exit velocity.
Cave doesn’t walk enough to be the platonic ideal of a three true outcomes player; he needs to slug enough to overcome a walk-to-strikeout ratio that is best viewed with an electron microscope. He managed that feat in 2018 and ’19, but the Cave of recent vintage has been a shadow of himself. We’ll let him explain, but before you read the quote below, go ahead and take a big sip of water, because the reveal is really something.
“I know when I’m healthy, I can bring some things to the table. I’m just trying to show that. I’m 30 but I feel just as strong, just as fast as I’ve ever felt in my life. I’m in a pretty good spot. It was an injury thing. I broke my back in 2021. I think that was a big deal because I’d been feeling that for a while. I don’t know how it happened but it happened. In 2021, I was hurting to start the year but played through it. Then I eventually got an MRI and broke an L5.”
Just to recap: Jake Cave feels great. Jake Cave was playing through a broken back but didn’t realize it. Jake Cave thinks the broken back might have been a big deal.
News reports at the time referred to Cave’s injury as a stress reaction, but either way, he deserves a little bit of grace here. In the short 2020 season, plenty of players — Nolan Arenado, for example — had what could just have been a bad start in any other season, but instead became a down year. Cave dealt with a pretty serious injury in 2021. We can’t just ignore the fact that it’s been three years since he had success at the big league level, but in 2022 he posted a career-lowest strikeout rate, and his hard-hit rate and average exit velocity were above league-average for the first time since 2019. His groundball rate plummeted, but unfortunately so did his line drive rate and his pull rate. Essentially, Cave hit a lot more fly balls to the big part of the ballpark, and he didn’t have the strength to send them over the fence.
Cave hit a ball 110.5 mph a few weeks ago, a height he hadn’t reached since 2019, and he’s also another year removed from the broken back business, which, again, might have been a big deal. He could be working with some strength that he didn’t have last year. If he can go back to pulling the ball a bit more or even just maintain last year’s batted ball profile and with a little bit more power (and in a smaller ballpark), he would go back to being a solid hitter.
Spencer Torkelson Spencer Torkelson had solid exit velocity numbers last year, but that didn’t translate into solid performance. As Jay Jaffe said in the first base positional power rankings, “Torkelson has nowhere to go but up.” ZiPS agrees, pegging him for a 115 wRC+, a whopping 39-point jump from his rookie season. He is running a 66.7% hard-hit rate and a 96.2 mph exit velocity during spring training, and maybe just as importantly, he has one of the biggest sample sizes on the list, with 33 balls in play measured by Statcast. He’s hit 12 of them at least 105 mph.
Last year, Torkelson posted a 41.4% hard-hit rate and a 90.5 mph average exit velocity. He had three different stretches of at least 30 balls in play with a hard-hit rate over 50% (one of them peaked at 63%). During those three stretches, his average exit velocity peaked at 92.2, 93.6, and 96.3 mph, respectively. That is to say, he isn’t doing something completely new, but he’s showing that even when he was going right last year, he still had more in the tank.
But if you’ve been following the Tigers in spring training, you know that even though Torkelson is crushing the ball, he can’t buy a base hit, and that’s a familiar story. In 2022, his xwOBA outpaced his wOBA by 33 points, the 11th-highest difference among all qualified batters. Maybe some of that was bad luck, but the longer it goes on, the more likely it looks the issue is with his batted ball profile. Torkelson hits entirely too many balls on the ground, especially too many of his hard-hit balls, which renders all his loud contact less meaningful. Last year, his average exit velocity was in the 78th percentile, but his xISO, which he underperformed by 35 points, was in the 51st. Take a look at the 15-day rolling averages of Torkelson’s wRC+ and his groundball rate:
The two are pretty much mirror images. Torkelson was terrible when he put the ball on the ground and great when he didn’t. He ran a 40.3% groundball rate in 2022 and is currently at 35.9% in spring training.
This spring, Torkelson has also been getting better pitches to hit by being more aggressive earlier in the count. As a result, he’s walked at less than half his 2022 clip, and his strikeout rate has stayed the same. It’s great that he’s crushing the ball in spring training, and his .278/.328/.389 slash line is still much better than last year’s. All the same, it looks like hitting the ball harder will not, on its own, take him to the next level.
Mark Vientos
Speaking of leveling up, Jon Heyman reported on Friday that Mark Vientos had a better shot to make the Mets’ opening day roster than Brett Baty. Then on Saturday, both Vientos and Baty were reassigned to minor league camp. After both players torched the minors last year and spring training this year, GM Billy Eppler performed the Thank You Mario! But Our Princess Is in Another Castle routine, explaining that the pair still have “some development objectives to reach.” When asked what those objectives were, Eppler served reporters a delectable word salad: “Just continuing to get tested in different game situations. Learning the speed, when to give ground, when to take ground. Just being put in different types of circumstances, different types of situations.”
Of all players with at least 15 balls in play recorded by Statcast, Vientos ran the second-highest average exit velocity of the spring at 97.5 mph. He had a 60% hard-hit rate over 20 recorded BIP. On his non-recorded balls in play, he went 8-for-14 with three doubles, so it’s not as if he just happened to hit the ball hard when the cameras were on. Baty has been performing quite well himself, although his exit velocities are more in the Really Quite Good range rather than the Destroyer of Worlds range.
Spring Training Super Smash Bros.
Player
AVG
OBP
SLG
EV
HH%
Mark Vientos
.278
.310
.481
98.1
63.2
Brett Baty
.325
.460
.425
93.1
41.2
SOURCE: Baseball Savant
Both players are 23, and it’s pretty clear that Baty has all the seasoning he needs to get a real shot. It would be surprising if he didn’t get called up to take over at third base after a few weeks of working on his defense continuing to get tested in different game situations.
Vientos is a different story for a couple reasons. First, he’s well and truly blocked, so much so that Eric Longenhagen, who ranked him as the organization’s sixth-ranked prospect last July, mentioned him as a trade candidate. Vientos is a third baseman in theory, but he doesn’t field well. He’s blocked by Eduardo Escobar and Baty at third and by Alonso at first. Our depth charts have Darin Ruf 러프 and Tommy Pham getting the lion’s share of PAs against lefties, with Daniel Vogelbach mashing righties as usual.
Next is Vientos’ profile. He has absolutely slugged his way up the Mets’ system, with a .210 ISO over five minor league seasons, running decent walk rates and extremely high strikeout rates. ZiPS projects him for a 107 wRC+ this year, but with a 32.6% strikeout rate. Last year only one qualified batter had a higher strikeout rate. Vientos will need every last bit of that power if he’s going to be an effective big league hitter.
If that profile sounds familiar, it’s because everything you just read about Vientos applies equally to Ruf. ZiPS sees him bouncing back from a rocky 2022 to post a 111 wRC+ with a .178 ISO and a 28.8% strikeout rate. It’s understandable that the team would give the 36-year-old Ruf a chance to prove that he can regain his old form before casting him aside for a rookie with essentially the exact same profile.
Still, it must be frustrating for Vientos, who has done everything to the baseball save light it on fire in trying to make the team this spring. He didn’t see great results during his brief big league debut last year, but he posted a 45.8% hard-hit rate and a 93.3 mph exit velocity across 24 batted balls and 41 PAs. He would seem to be as good an option as Ruf right now, and if the 23-year-old should ever close up any of the holes in his game — chasing less, elevating the ball more — all that loud contact should yield big results.
We conclude our rankings of the game’s position players with a deep dive on designated hitters.
Does anyone miss seeing pitchers hit? My guess is that the vast majority of you don’t, and for good reason. Pitchers have become increasingly dominant, which only increases the value of quality hitters, many of whom are utilized at the DH position. Some, like 42-year-old Nelson Cruz, fit the 1973 Orlando Cepeda mold, while others, like Shohei Ohtani… well, there are no others like Shohei Ohtani. If there has ever been a baseball unicorn, the Angels’ two-way superstar is just that.
Not all of players who see time at DH are defensive liabilities. Some clubs are blessed with positional depth and are looking for a way to fit a player into the lineup — Giancarlo Stanton and AJ Pollock are examples — while for others, it’s a matter of safeguarding health. Byron Buxton and Tyler Stephenson stand out in this regard. Read the rest of this entry »
Matt Duffy is in camp with the Kansas City Royals on a minor-league contract, and as is common for veteran players in his situation, he has multiple opt-out clauses. Whether he ends up exercising any of them remains to be seen. The 32-year-old infielder is on the bubble with days left before the start of the regular season, and even if he doesn’t make the Opening Day roster, there is a chance that he would accept a Triple-A assignment with a call-up in mind. All Duffy knows for certain is that he wants to keep playing.
“I’ve kind of made the decision that they are going to have the rip the jersey off of me,” said Duffy, who has battled injuries throughout his seven big-league seasons. “If I were to call it a career at some point in the next five years, I would find myself saying, ‘Man, I wish I’d have played one more year.’ Life post-baseball is going to be so much longer than anything the grind can throw at me. At the end of the day, I really enjoy what this game does for me in terms of pushing me to learn something new.”
Duffy is 12-for-36 on the spring, and he can provide more-than-adequate defense at multiple positions. Assuming he can stay healthy, he can help a big-league team — be it the Royals or someone else — for the foreseeable future. Even so, he knows that the clock is ticking. While many players who are asked about their post-baseball plans deflect the question, Duffy is forthcoming on the subject. Read the rest of this entry »
Before I started at FanGraphs, most of my writing was about the Phillies. When I took this gig, I made a promise that I’d continue to write about my favorite team, joking that this was merely “one more place to gush about Rhys Hoskins.” I must admit, this isn’t how I hoped to fulfill that promise.
On Thursday afternoon, Hoskins was manning first in a Grapefruit League contest against the Tigers. It was a happy day for Philadelphia, with Trea Turner, Kyle Schwarber, and J.T. Realmuto making their return from the World Baseball Classic. The Phillies were fielding what could have been their Opening Day lineup for the very first time. This wasn’t just any old Thursday in March; it was a chance to see how the reigning NL champs planned to defend their title.
Things got off to a promising start when Schwarber doubled and Hoskins drove him home in the bottom of the first. Woefully, the good feelings wouldn’t last for long. The following inning, Austin Meadows hit a high-bouncing grounder along the first-base line, and Hoskins turned to chase it into shallow right field. He nearly made the play, but the ball slipped out of his glove, like a scoop of ice cream falling from the top of the cone. As he moved to retrieve the ball, he took an awkward turn. One step later, and Hoskins was crumpled on the grass in pain:
It was immediately clear that something was wrong. Bailey Falter signaled for help from the dugout as Bryson Stott called for time. Every Phillie on the field came to check on their fallen teammate. Soon, the paramedics would cart him away. Read the rest of this entry »
Below is an evaluation of the prospects in the Boston Red Sox farm system who readers should consider “imminent big leaguers,” players who might reasonably be expected to play in the majors at some point this year. This includes all prospects on the 40-man roster as well as those who have already established themselves in the upper levels of the minors but aren’t yet rostered. I tend to be more inclusive with pitchers and players at premium positions since their timelines are usually the ones accelerated by injuries and scarcity. Any Top 100 prospects, regardless of their ETA, are also included on this list. Reports, tool grades, and scouting information for all of the prospects below can also be found on The Board.
This is not a top-to-bottom evaluation of the Red Sox farm system. I like to include what’s happening in minor league and extended spring training in my reports as much as possible, since scouting high concentrations of players in Arizona and Florida allows me to incorporate real-time, first-person information into the org lists. However, this approach has led to some situations where outdated analysis (or no analysis at all) was all that existed for players who had already debuted in the majors. Skimming the imminent big leaguers off the top of a farm system will allow this time-sensitive information to make its way onto the site more quickly, better preparing readers for the upcoming season, helping fantasy players as they draft, and building site literature on relevant prospects to facilitate transaction analysis in the event that trades or injuries foist these players into major league roles. There will still be a Red Sox prospect list that includes Mikey Romero, Eddinson Paulino, Wikelman Gonzalez and all of the other prospects in the system who appear to be at least another season away. As such, today’s list includes no ordinal rankings. Readers are instead encouraged to focus on the players’ Future Value (FV) grades. Read the rest of this entry »
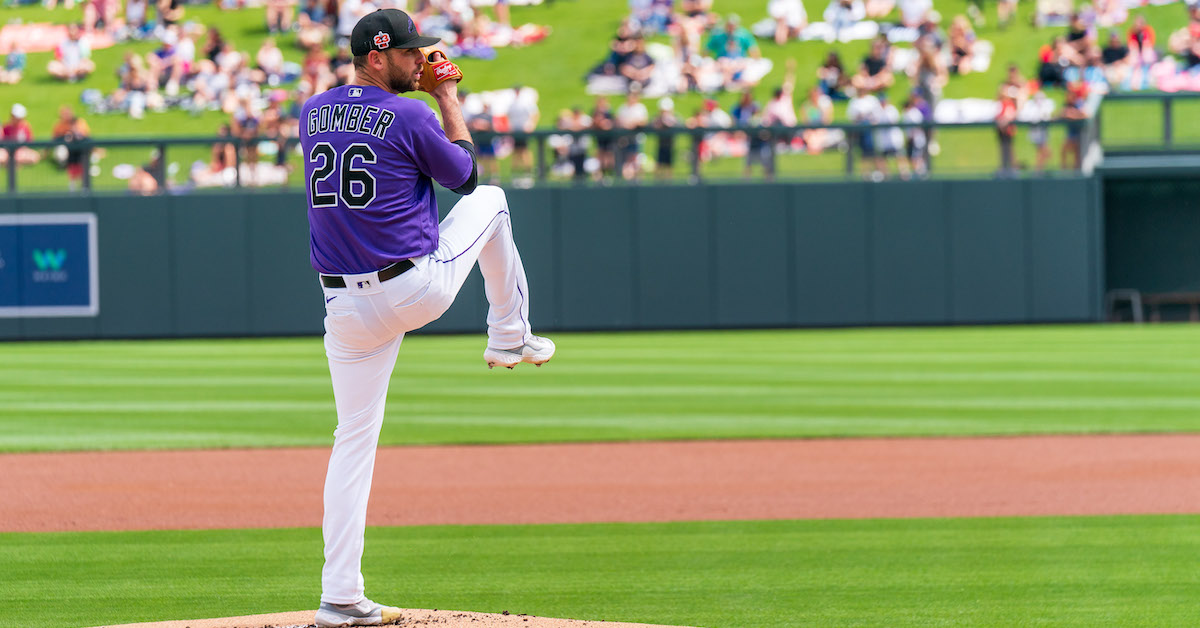
This is my third post about Rockies pitchersin the past seven weeks. We at FanGraphs try to touch on every corner of the league, but why on Earth would one writer feel compelled to spend so much energy on what’s traditionally been the weak side of the ball for a team that’s probably going to finish last in its division?
It’s because I’m… you know what, obsessed is too strong a word. It’s a little pointed. Let’s say “fascinated” instead. I’m fascinated by the 30-year conundrum that is building a winning pitching staff on a team that plays in a unique environment.
Being a mile above sea level doesn’t affect all sports in the same way; for instance, for speed skating, thinner air makes for less wind resistance and better ice conditions, which is why 20 of the 21 senior long-track world records recognized by the ISU were set on one of two high-altitude ovals. But a pitcher needs air resistance not only to slow fly balls down before they leave the yard, but to generate movement on breaking pitches. (Of course, pitchers make more money than speed skaters, and also don’t have to wear those terribly unflattering full-body spandex suits on TV, so it’s kind of a wash.) Read the rest of this entry »