Effectively Wild Episode 1975: Backdoor Curve


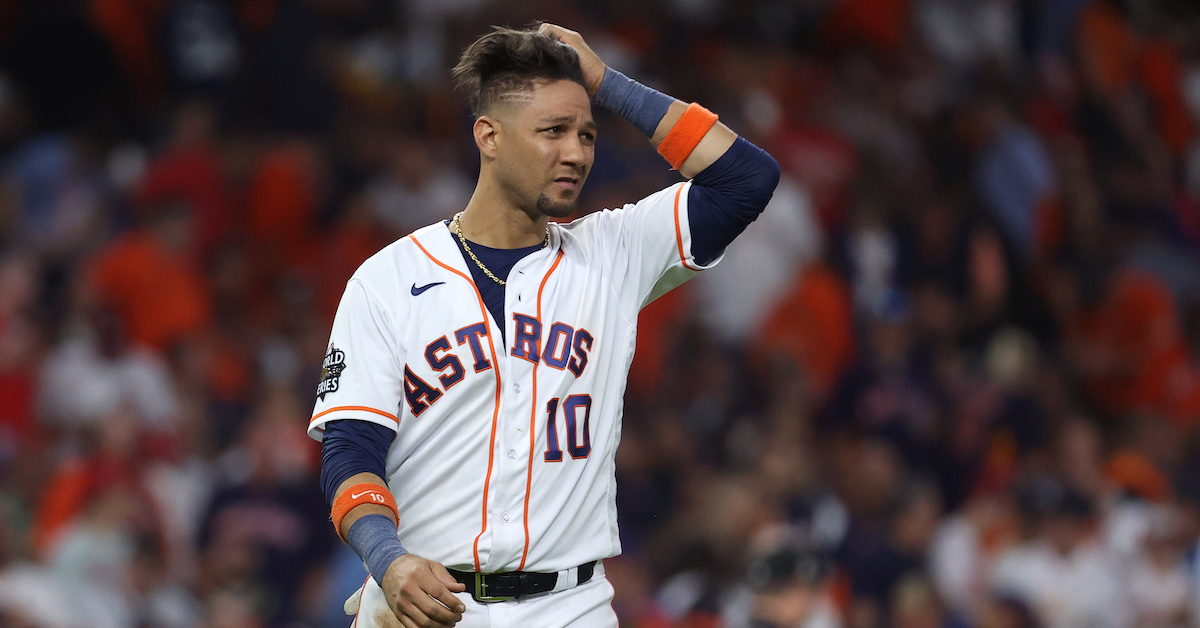
Ben Lindbergh and Meg Rowley begin with a little loose talk about Kiké Hernández’s revelation that he sharted during the 2020 NLDS, and pin down the precise instant of the accident with audio evidence. Then (23:59) they banter about whether it’s oxymoronic for MLB to have multiple “co-exclusive” official betting partners, MLB hiring local media execs to prepare for an RSN collapse (30:27), how the Blue Jays could make use of ex-Astros GM James Click (33:37), MLB lobbying state governments for exceptions to minimum-wage laws (39:51), a wave of injuries in spring training (44:30), and an umpire-less inning (48:06). After that (51:06), they answer listener emails about whether a Triple-A team in midseason form could defeat a pre-spring-training average MLB team or team of MLB all-stars, forgetting player handedness, the fluky debut of Livan Soto, whether Barry Bonds could still hit home runs, triple-digit uniform numbers, changing one’s mind about boycotting MLB, “hitter” vs. “position player,” the effects of starting separate unions for pitchers and hitters, and what a “partial shift” means in 2023, plus a Past Blast from 1975 (1:43:31) and a follow-up on the Past Blast from 1974 (1:46:37), featuring Gregg Trueman, son of sabermetric pioneer Richard E. (Dick) Trueman.
Audio intro: Billy Bragg, “Accident Waiting to Happen”
Audio outro: Monsters of Folk, “Ahead of the Curve”
Link to Red Sox Twitter video
Link to the instant of the shart
Link to 2020 NLDS G1 at B-Ref
Link to Meg on Bradley
Link to new “co-exclusive” press release
Link to 2021 “co-exclusive” press release
Link to MLB’s local media hirings
Link to Drellich on MLB and RSNs
Link to article on Click’s hiring
Link to article on Click and Crane
Link to Ben on front-office secrecy
Link to Seeking Rents on MLB lobbying
Link to Drellich on MLB lobbying
Link to EW on possible book bans
Link to Lux injury video
Link to thread on umpire-less baseball
Link to Handley’s framing
Link to MLB on the umpire-less inning
Link to ESPN on the umpire-less inning
Link to EW on unnecessary 9th innings
Link to EW listener emails database
Link to Soto/Bouchard leaderboard
Link to Voros’s Law
Link to Soto’s record on Stathead
Link to article about Bonds’s cycling
Link to Bonds on Strava
Link to 75-year-old Appling’s HR
Link to Adler on uniform numbers
Link to Neshek on SABRCast
Link to 2020 Keyser column
Link to revised MLBPA logo
Link to MLB on “strategic” shifts
Link to 1975 Past Blast source
Link to high school expanded DH
Link to “Ohtani rule”
Link to David Lewis’s Twitter
Link to David Lewis’s Substack
Link to 1974 Past Blast
Link to Trueman’s 1974 article
Link to Trueman’s 1959 article
Link to Pete Palmer wiki
Link to Earnshaw Cook wiki
Link to The Numbers Game
Link to 1964 SI article
Link to SABR’s Mills data
Link to Palmer on Player Win Averages
Link to Dick Trueman archive
![]() Sponsor Us on Patreon
Sponsor Us on Patreon
![]() Facebook Group
Facebook Group
![]() Twitter Account
Twitter Account
![]() EW Subreddit
EW Subreddit
![]() Effectively Wild Wiki
Effectively Wild Wiki
![]() iTunes Feed (Please rate and review us!)
iTunes Feed (Please rate and review us!)
![]() Get Our Merch!
Get Our Merch!
![]() Email Us: podcast@fangraphs.com
Email Us: podcast@fangraphs.com
Podcast (effectively-wild): Play in new window | Download
Subscribe: RSS