Notes
Cavalli was dominant over his first few frames on Wednesday, dealing first-pitch strikes to most of his opposing batters and sending them down in order until a weak, bloop single in the fourth. His command faltered later in the game, and he allowed the opposing lineup to string together a few hits, then issued a couple of free passes (one walk, one HBP) and was pulled before he could get himself out of the sixth inning.
You might think that he plowed his way through the order the first couple of times by way of a whirlwind of whiffs – he did, after all, lead the minors in strikeouts in 2021. But many of those Ks were accrued in the early part of last season, as Cavalli began his rapid ascent through the Nationals system. He had a whopping 44.9% strikeout rate in his seven High-A games, then made 11 Double-A starts and fanned 32.9% of those opponents. But when he reached Triple-A for a six-start stint to close out the season, his strikeout rate dipped significantly, with the more advanced batters keying in on heaters that would’ve blown by bats at the lower levels. Read the rest of this entry »
Jeff: What do we make of Semien? Same slow start as last year, or something else?
12:03
Dan Szymborski: I’m still on slow start.
12:03
Ryan: What language do you primarily code in? Does the answer depend on the project? I.e the ZIPS model vs. a random Thursday article research
12:04
Dan Szymborski: Depends. I’m not a coder, I’m a math guy who codes a little when he’s stuck doing. I use a combination of Excel with some statistical package third party add-ons and Visual Basic
Jazz Chisholm Jr.’s first full season in the major leagues was somehow both a success and a disappointment. League average offensive production from someone who only hit Double-A in 2019, with solid defense to boot? That’ll get you 2 WAR in just over 500 plate appearances, an impressive showing. He cranked 18 homers as well – all in all, a statistically solid debut.
On the other hand, he did it in a way that looked nothing like his minor league numbers. Chisholm’s intrigue had always stemmed from his sneaky power. Despite his diminutive frame – he’s listed at 5-foot-11, but I’d take the under – he put up impressive raw exit velocities and excellent home run numbers. He hit 25 homers in just 501 plate appearances in 2018, then followed it up with another 21 in 458 plate appearances in ’19. Those are serious numbers, and it’s no accident that Eric Longenhagen graded Chisholm’s raw power as a 60 on the 20-80 scale.
Despite his 18 bombs, though, he didn’t really display the thump he’s capable of. It’s not that he didn’t have the raw power we thought he did – he posted an 84th percentile maximum exit velocity – but quite frankly, he just hit too many grounders. You can look at his minor league GB/FB ratios, compare it to last year, and see the change:
Jazz Chisholm Jr., Batted Balls by Year
Year
Level
GB/FB
GB%
FB%
2016
R
1.72
49.7%
28.9%
2017
A
0.86
35.3%
41.2%
2018
A-A+
0.82
35.0%
42.5%
2019
AA
0.25
15.0%
59.5%
2020
MLB
0.72
37.1%
51.4%
2021
MLB/AAA
1.59
48.8%
30.7%
Aside from a brief and grounder-heavy rookie ball debut, Chisholm has avoided putting the ball on the ground. You can’t hit a home run on a grounder, no matter how hard you try. That’s how he ended up with average isolated power in 2021 despite his prodigious pop. He just couldn’t elevate, plain and simple.
This season, that’s in the past. He’s come out firing on all cylinders, hitting .295/.337/.611 with six homers in his first 105 plate appearances. He’s probably not going to keep hitting .295, but he probably will keep up his power output, because he’s back to doing what he used to do best: getting the ball in the air with great regularity. His groundball-to-fly ball ratio is back down to 0.76, his 30.6% groundball rate is the 12th-lowest in the majors, and he’s elevating and celebrating as well as he ever did in the minors.
Call it rocketed-ball science: if you have Chisholm’s power, putting the ball in the air is the best thing you can do. In his major league career so far, when Chisholm can’t get the ball in the air (which I defined as launch angles of five degrees or below), he’s hitting .252 with a .289 slugging percentage, good for a .237 wOBA. That’s awful – and that’s when he puts the ball in play. That’s when the good results are supposed to come.
When he gets above the five degree mark, good things start to happen. He’s hitting .421 with an .870 slugging percentage. If you’re a wOBA person, that works out to .531. That’s the good stuff – the kind of premium production on contact scouts expected out of Chisholm. This isn’t some “oh, he’s just on a hot streak in 2022 that’s the majority of his production” nonsense, either; cut 2022 out, and he’s hitting .412 with an .848 slugging percentage.
Think my five degree cutoff was arbitrary? It absolutely was! Let’s do it again at 10 degrees. Under 10 degrees, Jazz is hitting .327 with a .375 slug. At 10 or more, he’s batting .388 with an .881 slug. No matter how you slice it, when he can keep himself from hitting the ball into the ground, good things happen.
So why doesn’t he do it all the time? Because of pitching, basically. You don’t get to hit off a tee and launch moon shots (named after Wally Moon, thanks Effectively Wild!) all day. Pitchers want grounders or whiffs, and where they locate the ball has a lot to do with what happens after hitters connect.
The lower the pitch, the higher your chances of hitting a grounder, obviously. Even as he’s made strides at putting the ball in the air, Chisholm is hitting grounders on 41.7% of his batted balls when he makes contact in the lower third of the zone. That number stood at 55.3% last year.
Make contact in the middle third, and what kind of hitter you are does more to determine the outcomes. Last year, Chisholm stayed on the ground on exactly 50% of his batted balls that were in the middle third of the strike zone height-wise. This year, that’s down to 35.7%. By the time you get to the upper third, you almost can’t help but elevate. Chisholm hit grounders on 30.2% of his batted balls that originated from the upper third of the strike zone last year, right around league average for that area of the zone. This year, that’s down to 10%.
In other words, Jazz is finding a way to put everything in the air again, like he always has. The question, then, should be what happened last year. As it turns out, he had a few stretches of productive air contact, but spent a few months with some absurdly high groundball rates, torpedoing the whole operation:
I’ll be honest with you: I can’t completely explain this one. It’s not like he’s fixing it with approach, at least not entirely. Sure, he’s swinging more at pitches in the upper third of the zone, but he’s swinging more at pitches in the lower third as well. More of his contact has come in the lower third of the zone this year, in fact.
I can speculate, though. I watched a giant pile of at-bats from the peak of his grounder-heavy spell last year and tried to pick something out that could explain the change. This is extremely non-scientific, but here, watch him hit a grounder on August 31 last year on a fastball right down the pipe:
Now, for a baseline, here he is hitting a grounder on a fastball right down the pipe this April:
Is that difference in swing responsible for the huge change in groundball rate? I’m hesitant to pin it all on that. But he clearly looks less comfortable in the first clip; he’s bouncing around, his hands are meaningfully higher at pitch release, and his lower body looks to me like it’s slightly out of sync at the point of contact.
I’m absolutely not a hitting coach. I wouldn’t take what I’m saying here as gospel. But if you asked me which hitter was more likely to do damage, I’d take the one who stayed still, kept his hands lower, and looked more balanced on his follow-through.
He’s doing other things too, of course. He’s making far more contact over the heart of the plate (61% of his batted balls this year compared to 50% last year), and those are easier pitches to hit. He’s more aggressive over the heart of the plate in general – 78% swing rate this year against 70% last year – while chasing fewer breaking balls outside the strike zone. The more you do that, the more you get pitches to hit.
It’s not resulting in more walks, but that might change. Challenging Chisholm is a tricky proposition; he still swings and misses quite a bit in the zone, but he does a ton of damage when he connects. The equation was a lot easier last year, when he was putting the ball on the ground far too often. Now, you’re liable to watch a jog around the bases if you get too comfortable with throwing him pitches in the zone. Thus far, pitchers haven’t given in. They’re getting their strikeouts, but Chisholm is turning plenty of those in-zone pitches into souvenirs.
Of course, he can hit home runs outside the zone too. Just ask Mark Melancon, Chisholm’s latest victim:
I’d like to have a better answer for you. I’d like to give you one simple statistic that explains Chisholm’s new form. I don’t have one, though. I think it’s a confluence of many things. He’s swinging at better pitches. He looks more locked in at the plate. He’s returning to his old batted ball distribution – maybe this has basically been him the whole time. Whatever it is though, it boils down to this: when Chisholm is rolling, he’s got top-shelf power and the batted ball distribution to take advantage of it. Only time will tell if he can keep it up, but things look pretty rosy in Miami at the moment.
As offense dips down, it was bound to happen. Reid Detmers of the Angels threw the first solo no-hitter of the year last night, facing only 28 batters as he beguiled the Rays’ lineup for nine innings. But this no-hitter wasn’t filled with drama, or even short on offense. The Angels put up 12 runs, powered by a two-homer game from Mike Trout. One of baseball’s unique charms is that the two halves of the game are disconnected; you can have a tense chase of a no-hitter on one side and silly season on the other. Silly season? Well, let’s get right to it.
Top of the Early Innings
Detmers didn’t exactly roll out of bed dealing. After a first-pitch ball, he laid one in there, and Yandy Díaz tagged it for the hardest-hit ball that anyone on either team managed all game. Luckily, it was into the ground and straight at shortstop Andrew Velazquez. Wander Franco followed with another hard-hit grounder, and Harold Ramirez ended the inning with a sinking liner right at left fielder Brandon Marsh. Read the rest of this entry »
It wasn’t long ago that the Cardinals viewed Paul DeJong as a foundational player. Coming off a 25-homer 2017 season in which he was the runner-up in the NL Rookie of the Year voting, they signed him to a six-year, $26 million extension — a record at the time for a player with less than a year of service time. But since his 30-homer All-Star showing in 2019, he’s battled injuries, illness, and himself with diminishing returns. On Tuesday, the Cardinals addressed his increasing struggles by optioning the 28-year-old shortstop to Triple-A Memphis.
DeJong is hitting just .130/.209/.208 for a 30 wRC+, ranking among the bottom four in the majors in all four of those categories among players with at least 80 plate appearances (he has 86). His dismal showing has followed two disappointing seasons with very different shapes, a 2021 campaign in which he hit for power with little else (.197/284/.390/, 86 wRC+, 19 HR) and a ’20 season in which he showed little pop (.250/322/.349, 87 wRC+, 3 HR).
Despite missing nearly three weeks (but just 11 games) when the Cardinals had a COVID-19 outbreak in August 2020, DeJong actually rebounded and hit quite well until mid-September of that season, but he closed in a 6-for-46 funk that dragged his numbers down, and went just 2-for-10 in the Wild Card Series against the Padres as the Cardinals were eliminated. He missed a month in May and June of last season due to a non-displaced rib fracture, then tweaked his back later in the year, and started just 19 of the team’s final 47 games as fill-in Edmundo Sosa outplayed him. Sosa, who hit .271/.346/.389 (104 wRC+) last year, got the call in the Wild Card Game, which the Cardinals lost to the Dodgers. Read the rest of this entry »
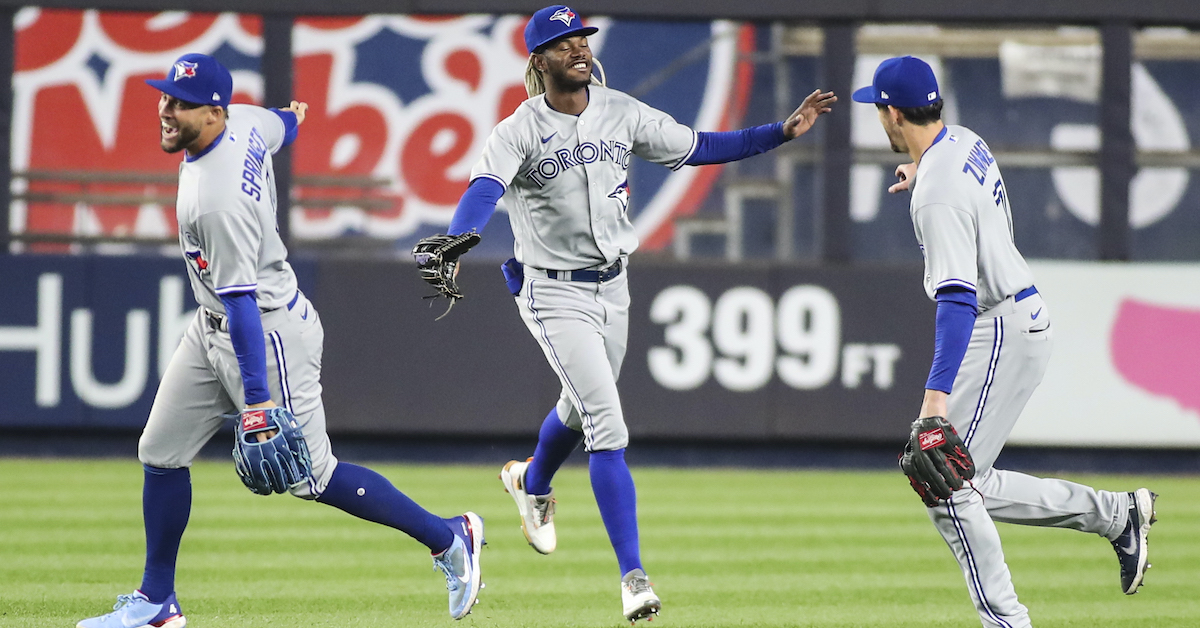
It’s a fun time to be a Blue Jays fan. (Well, Tuesday night’s loss to the Yankees notwithstanding.) Vladimir Guerrero Jr.’s titanic home runs are fun, George Springer’s diving catches are fun, and Kevin Gausman’s wicked splitters are fun. Basically, the entire team is a blast to watch. To a casual fan, Toronto must look like the best baseball has to offer. And to a serious nerd like myself, Toronto also looks like the best baseball has to offer — in one specific regard, that is.
Here at FanGraphs, I’ve written extensively about the shift. It’s a subject I’m passionate about not only because there’s a lot of room for analysis and debate, but also because teams seemingly never agree on how to use it, and dissent is entertaining. The Padres only shift against left-handed hitters. The Dodgers shift against everyone! Last season, it looked like teams started to cut down on shifts against right-handed hitters. This season, they’re more popular than ever. And if there’s a protagonist in the latest (and potentially last) story surrounding baseball’s grasp of the shift and all its variations, it’s none other than the Toronto Blue Jays.
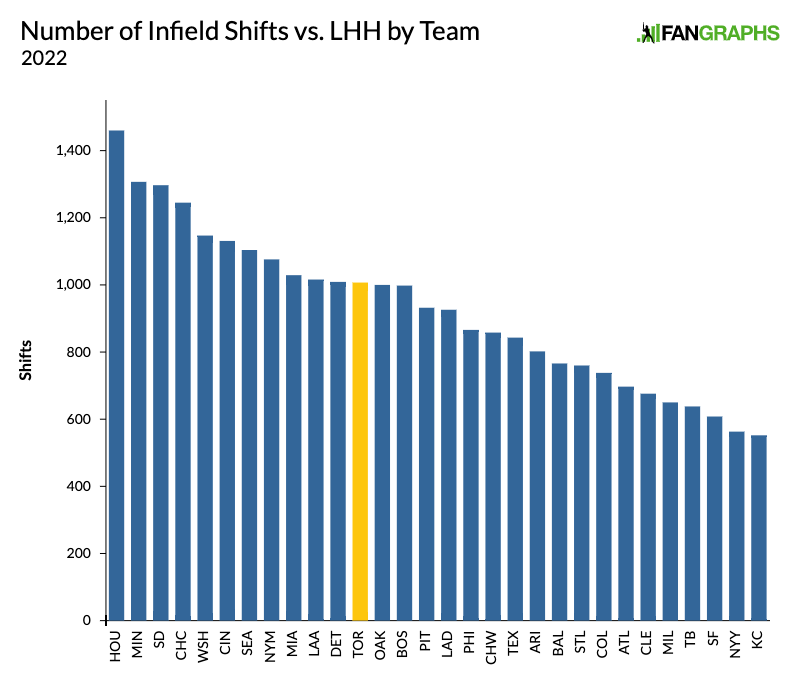
I’m hardly the first to take note of this. Summarizing the season’s first weekend, Mike Petriello wrote about how the Blue Jays were shifting against everyone. Emma Baccellieri covered the continued rise of infield shifts and how Toronto has been leading the charge. In addition, what follows isn’t anything groundbreaking. These observations have been made before, but they bear repeating because they’re ridiculous. It’s as if the Blue Jays are participating in an entirely different game. But if we just look at the most common variety of shifts, the ones against lefties, there’s nothing all that special to be found:
A quick note on this graph and those ahead: they display volume and not rate, making them inaccurate in judging which teams are the most and least shift-enthusiastic. For example, while the Yankees are 29th by number of shifts against lefties, they’re 23rd by shift rate, simply because their pitching has faced a league-trailing number of left-handed hitters. But for the purposes of this article, using each team’s total seemed like the best option. You’ll get to see why later on.
Getting back to the point, the Blue Jays are around the middle of the pack when it comes to shifting against lefties. They follow a rare shift-related consensus but not overly so, which is that most left-handed hitters are good shift candidates. Why? Compared to right-handed hitters, lefties pull a higher rate of groundballs and tend to strike out more often when faced with the shift. A standard lefty alignment also leaves considerably fewer holes in the infield. Even the most conservative teams are shifting way more against lefties than they did some three or four years ago.
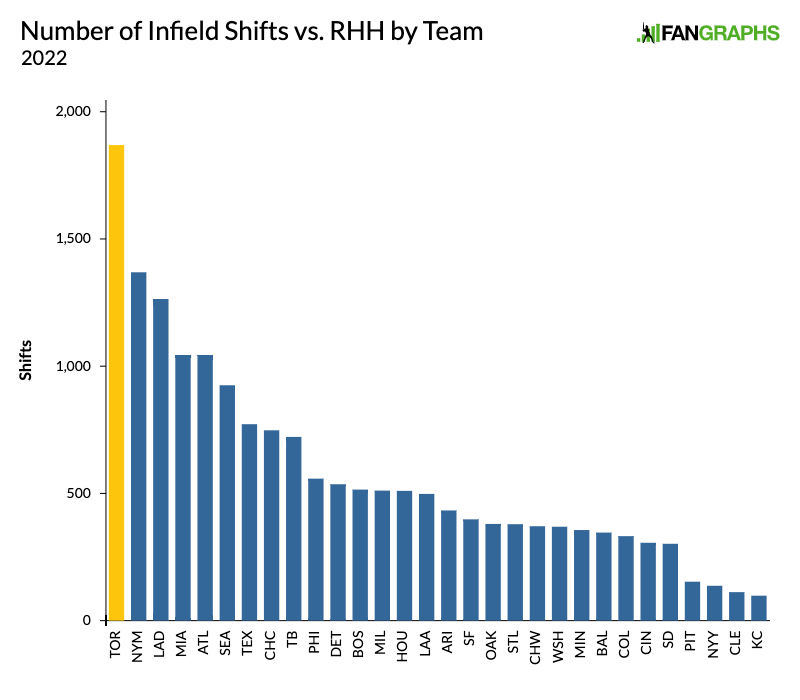
In that sense, the Blue Jays are moderates. But not for long, because this is where things kick into overdrive. While all teams have shifted against a righty at least once this season, extremists are few and far between. That’s because those righties are a risky bunch; they don’t pull as many of their grounders and strike out less often against the shift. A standard righty alignment can cover the pull side, but any ball hit even slightly the other way has base hit potential. Most teams prefer to focus on the lefties. The Blue Jays, though? They simply do not care:
What’s fascinating is just how fast the Blue Jays came around to the idea of targeting right-handed hitters. They shifted against righties in 11.3% of opportunities last season, a rate that has skyrocketed to 66.4% this year. Some time during the offseason, the Jays’ front office folks pondered the possibility of this, ran the numbers, and arrived at the conclusion that it is indeed viable. I have no idea what sort of revelations led to such a rapid shift in philosophy, and from the outside looking in, they seem bonkers. Public research suggests that shifting against so many righties is a bad idea. But evidently, certain teams are arguing otherwise. The Blue Jays, beyond joining them, are now spearheading their campaign.
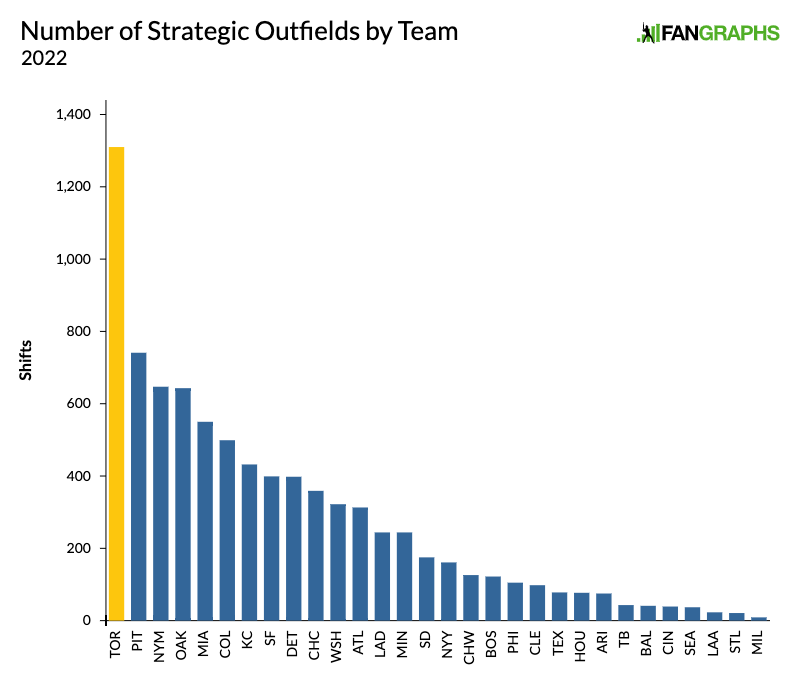
Teams aren’t only paying attention to their infield defense, however. As both Rob Arthur and Russell Carleton have detailed, outfield positioning has had a far greater impact on hitter BABIP than infield shifts, which receive the bulk of the sports media spotlight. One method teams use to snag hard-hit line drives and fly balls is shading the centerfielder to the right (versus lefties) or the left (versus righties). Hitters also tend to pull their air balls, and it’s those pulled balls that are the most dangerous. Labeled as a “strategic” outfield on Baseball Savant, it’s subtle, effective, and has spread across the league. Let’s see where the Blue Jays stand in terms of usage:
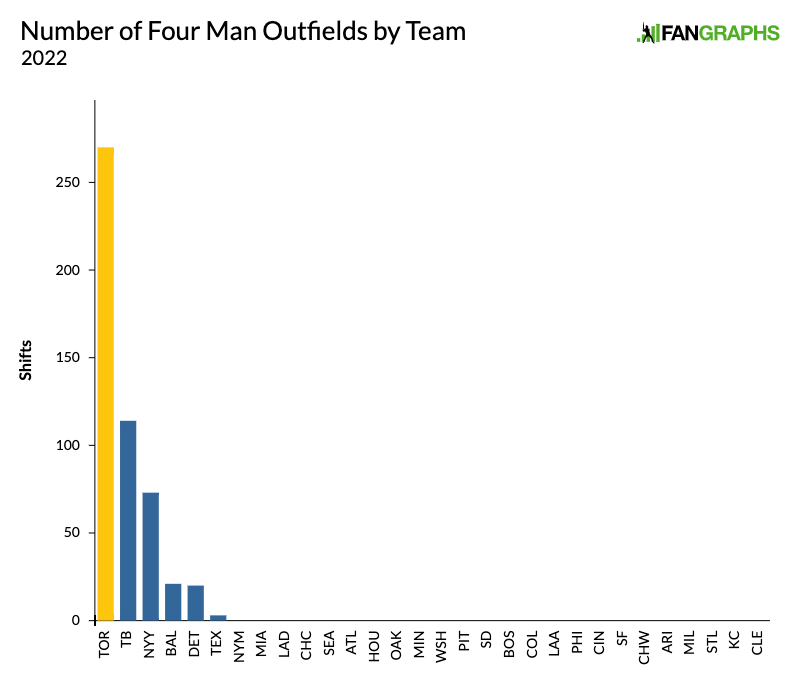
There’s not much to add here. The Jays are once again in first place, and this time by an even greater margin. They alone have accounted for 16% of all strategic outfields this season. Since these outfield shifts happen concurrently with infield ones, it’s pretty much never the case that Toronto’s defense is normal. Regardless of your feelings about the shift, you kind of have to applaud this dedication, right? Oh, and the Blue Jays are also connoisseurs of the four-man outfield, which few teams attempt due to the risk involved. It’s certainly an acquired taste, but the Blue Jays have a voracious appetite:
This graph isn’t missing any values — there really are only six teams thus far who have dared to place four men in the outfield. Fittingly, the Blue Jays’ total is greater than that of the five other teams combined. It’s interesting how among the six, four of them are AL East teams. That’s partly because of Joey Gallo and Anthony Rizzo, two Yankees who rank first and second in most four-man outfields faced. But what separates the Blue Jays is their relentlessness. Rather than reserve four-man outfields for extremely specific situations, they’ve been keen on using them against select hitters without consideration for the opposing pitcher or count. They aren’t just dipping their toes in the water; they seem fully committed.
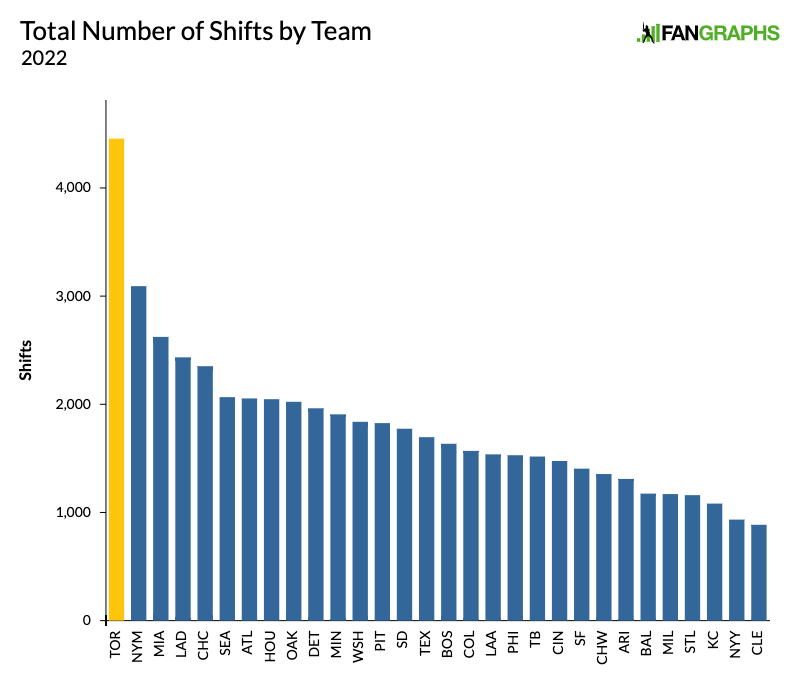
In conclusion, the Blue Jays shift a lot. How much is a lot? This much is a lot:
A bunch of teams squished together, with one Toronto skyscraper towering over them. That graph perfectly encapsulates why the Blue Jays have been so unbelievable this season. The players are good, sure, but from a front office perspective, this is also what a desire to win looks like. Not that a maximalist approach is necessarily good, but the Blue Jays sure seem convinced that more than 4,000 shifts and counting are an integral part of their formula. They’re all in! That can’t be said about a lot of teams.
What I’m not going to do here is try and figure out what their reasoning is, and if it really is sensible. That’s maybe an article for later — no math this time. The Blue Jays’ aggressive ways do give us plenty of questions to consider, however. Did their acquisition of Matt Chapman encourage them to push the limits of what’s possible in the infield? Does the spacious outfield of Rogers Center give them an incentive to cover extra ground? Or have they somehow found a way to nullify the walk penalty? For now, though, I’m content with stepping back and admiring their efforts. If the shift does becomes a relic of baseball’s past, we’ll always have the 2022 Blue Jays to remind us how far it was taken.
Every year, Byron Buxton seems to find another gear. With the exception of his abbreviated 2018 (94 plate appearances in the majors), Buxton’s OPS has increased every single season compared to the year before. In 2022, partly thanks to becoming a fastball-crushing machine since the start of last year, he’s continued this pattern, hitting .278/.342/.722 in 79 plate appearances (all stats are through Monday’s action). He’s even tied for the league lead in home runs with nine, especially impressive given that he’s missed more than a third of Minnesota’s games.
It’s that last fact that is troubling, as Buxton’s career has been hampered by an unfortunate inability to stay healthy. And it hasn’t been one, consistent problem that keeps him out of games but rather a succession of nagging ones, with each season bringing a mystery grab bag of misfortune. This year, it’s been a sore knee from a slide, a hand contusion, and a hip problem. Last year, it was a hip, a hamstring, and a broken hand. Before 2021, he missed time due to a concussion, a sore left shoulder, a sprained left foot, a torn labrum, another concussion, a hit by a pitch to the wrist, a different strain to the same wrist, a broken toe, serious migraines after an outfield wall collision, a strained groin, and a sprained knee — and that doesn’t count the myriad day-to-day issues.
The last time Buxton played even 100 games in a season was in 2017 (while there were only 60 games in 2020, he still missed a third of them). I was born in 1978; growing up, Eric Davis was the five-tool, mega-skilled exemplar of the dynamic superstar who couldn’t stay healthy, but even he still managed to get into 130 games a year during his 1986–90 peak. Buxton debuted almost seven years ago, in June 2015, and barely has three years’ worth of playing time in the majors to go along with another half-season in the minors due to Minnesota’s early proclivity for demoting him every time he fell into a slump. Read the rest of this entry »
Ben Lindbergh and Meg Rowley banter about Josh Naylor’s record eight RBI after the eighth inning and the hot-hitting Guardians, José Ramírez taking a hometown discount to stay in Cleveland, Rangers manager Chris Woodward’s seemingly misinterpreted joke about Yankee Stadium, the perils of interpreting text-only quotes, Mets hitting coach Eric Chávez’s theory about MLB selectively juicing the ball, another way in which life is getting harder for hitters, Josh VanMeter’s nightmare inning as an emergency catcher for the Pirates, and Rays pitcher Calvin Faucher’s rude welcome in the majors, plus a Stat Blast (1:14:26) about Sean Hjelle, Tyler Rogers, and the greatest disparities in consecutive pitchers’ release points, a note about a Bill Veeck plan to sign a “giant” hitter, and a few followups.
This season, Eric and Tess Taruskin will each have a minor league roundup post that runs during the week, with the earlier post recapping some of the weekend’s action. You can read previous installments of our prospect notes here.
Darius Vines, RHP, Atlanta Braves Level & Affiliate: Double-A Mississippi Age: 24 Org Rank:TBDFV: 35+
Weekend Line: 6.1 IP, 4 H, 3 R, 0 BB, 11 K
Notes
Even though Vines had K’d a batter per inning leading up to it, his trademark changeup hadn’t been consistently plus this year until Sunday’s outing. It’s actually been Vines’ fastball, which has lift and carry through the strike zone, that has induced most of his swings and misses this year, even though he hasn’t had any kind of velo spike and is still sitting in the 89-92 mph range and topping out close to 94. A fringy, low-80s slurve rounds out a solid if unspectacular pitch mix that has been weaponized by Vines’ command. Fastball playability, a good changeup, and plenty of strikes drive spot starter projection here. Vines will likely enter the offseason on Atlanta’s 40-man bubble. Read the rest of this entry »
Liam Hendriks got shelled last night. After it looked like the White Sox had put the game away — they led 8–2 after the bottom of the eighth inning — the Guardians made things interesting by stringing together hits, errors, and walks to trim the deficit to 8–4. With two outs, Tony La Russa called for Hendriks, who promptly surrendered a single and a grand slam to tie the game.
It was the the first blemish on what otherwise would have been a sterling week for Hendriks. From May 2 to May 7, he’d been an absolute workhorse, making five appearances in six days without allowing a run. We’ll probably never know whether Monday’s game — his sixth in eight days — was affected by fatigue; Hendriks wouldn’t likely admit that even if it were the case. But it’s reasonable to wonder whether something could have gone differently, somewhere in the sequence of events, that gave the White Sox a better chance of hanging on last night.
Six games in eight days is an effective cap on reliever usage these days. No reliever has thrown seven games in eight days in the past three years; six games in eight days has happened 23 times over that same stretch. Hendriks himself accounts for three of those, with the rest a hodgepodge mix of closers and low-leverage middle relievers and Raisel Iglesias as the only other pitcher with multiple entries. Read the rest of this entry »