Kwang Hyun Kim Returns to Korea

With no clear end in sight to the owner’s lockout, free agent Kwang Hyun Kim 김광현 has decided to return to Korea for the 2022 season. On Monday, Jeeho Yoo of Yonhap News reported that Kim has signed a four-year deal with the SSG Landers (previously the SK Wyverns). The deal is worth 15.1 billion won ($12.3 million dollars) and breaks the record for largest KBO contract that was previously held by Dae-Ho Lee 이대호 and Sung-bum Na 나성범. In a statement released by the Landers, Kim said, “I was able to challenge myself in the majors because of support from fans here. I decided I wanted to give back to them once I returned to the KBO. The Landers recognized my value with the biggest contract ever in the KBO — I didn’t have to think long and hard about the reunion.”
Kim returns to his old team in Incheon, a squad that has missed the playoffs both years since he made the jump to the major leagues after the 2019 season: They placed ninth in the 10 team league in 2020 but came up half a game short of qualifying for the Wild Card game in 2021. Kim solidifies a starting rotation that also includes former major league pitchers Iván Nova and Wilmer Font. Font led the Landers pitching staff with a 3.46 ERA and a 3.25 FIP, but the four pitchers in the rotation behind him all had ERAs and FIPs over five. With Kim back in the fold, the Landers are likely one of the preseason favorites heading into the regular season.
I asked former FanGraphs contributor Sung Min Kim for some additional context on Kwang Hyun Kim’s return to the KBO.
“Landers are now in a very good position, especially with their pitching staff. Not only do they get one of the better KBO pitchers back in their rotation, but they also bet highly on Wilmer Font, who pitched very well with them in ’21, and Iván Nova, and they also have two solid Korean-born starters in Jong Hoon Park and Seung Won Moon set to return mid-season from injuries. Those five pitchers would make up the best rotation in all of KBO, and make them instant pennant favorites for 2022. They will certainly be a very fun team to watch.”
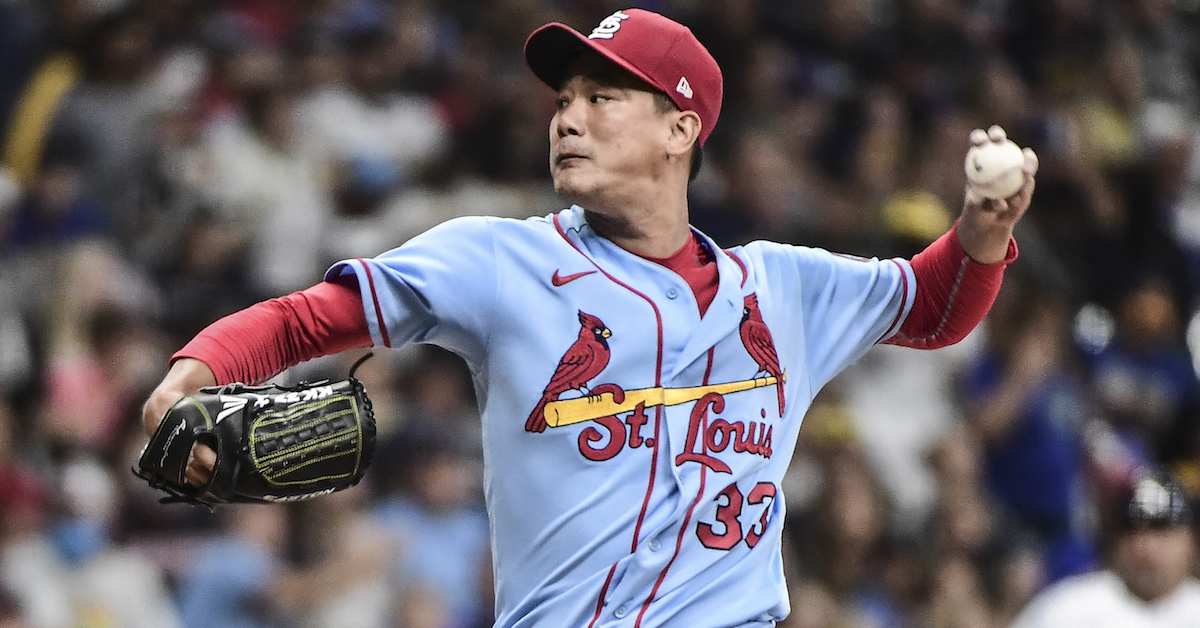
Kim’s time in America was anything but easy. A club legend while playing for the Wyverns from 2007-19, he made the transition to the US prior to the 2020 season. Unfortunately, his introduction to the major leagues was interrupted by a global pandemic. The next season was a little more normal, but his two-year deal with the Cardinals expired at the end of 2021 and the 33-year-old again found himself in strange circumstances, with the owner’s lockout disrupting his foray into MLB free agency.
While pitching for St. Louis, Kim’s role was as settled as the circumstances around him these past two years. He began the 2020 season as the Cardinals closer, notching his first professional save in his first major league appearance. A COVID outbreak on the team forced him into the starting rotation soon after, and he made seven starts during the remainder of the abbreviated regular season with an additional start in the Cardinals Wild Card series against the Padres. He allowed just nine total runs to score against him in those eight regular season appearances, good for a 1.62 ERA.
Last year, two separate stints on the injured list limited Kim to 21 starts and six relief appearances. The second of those trips to the IL came in mid-August after the Cardinals had acquired J.A. Happ and Jon Lester to bolster their rotation for the stretch run. Kim returned after two weeks on the sidelines but had lost his spot in the rotation by then. He made two more starts through the end of the season but was mostly relegated to mop up duty in the bullpen over the last month of the season.
All told, he made 28 starts during his time with the Cardinals and seven additional relief appearances. He compiled 1.8 WAR with an excellent 2.97 ERA that outpaced a more middling 4.34 FIP. He never racked up big strikeout totals, instead relying on good command and a solid ability to limit hard contact. Just 25.6% of the plate appearances against him ended with a hard hit batted ball, right in line with the league average over the last two seasons. He allowed a 6.3% barrel rate during his time in the majors and just a .348 expected wOBA on contact.
On the pitcher’s decision to return to Korea, Sung Min Kim had this to say:
“I think he was always inclined to stay in the US and try to prolong his career in the US by signing with another team. He’s had a desire to challenge himself in the majors for a long while, even before he signed with the Cardinals. With his age and the decreased velocity he showed during his two seasons in St. Louis, I wasn’t sure what the market looked like for him, especially given that he was relegated to a bullpen role later in 2021. I think, with the lockout taking awhile, him missing his family being back in Korea, and definitely having a clearer role guaranteed back in KBO, it was very hard to say no to a lucrative deal to come back.”
Kim’s departure from the US creates an even bigger hole in the depleted free agent starting pitching market. Twelve of the 18 starters listed on our top 50 free agents list signed new deals prior to the lockout. That leaves very few options for teams looking to bolster their rotations once the offseason resumes. Kim was ranked 35th on that list of top free agents, ahead of Zack Greinke, Michael Pineda, and Yusei Kikuchi. Though he probably wasn’t likely to land a significant payday from an MLB club, he could have been a solid back-of-the-rotation option for a contending team that needs a bit more depth in their rotation. Those teams that might have been interested in Kim’s services are now limited to looking at starters like Pineda, Kikuchi, Tyler Anderson, and Garrett Richards.
This may also be the first instance of the ongoing owner’s lockout influencing a player to leave the US to find other opportunities abroad. Obviously, Kim returning to his home country to play for the same team he starred for previously is a unique circumstance, but the fact that there was no clear end to his free agent limbo in America had to have entered into his decision-making process when opting to return to Korea. Kim chose to leave behind the uncertainty of MLB for a record-setting KBO deal.
If negotiations between MLB and the Players Association continue to drag on, jeopardizing more and more of the regular season, it wouldn’t be surprising to see players consider signing with international leagues to give them some guarantee of earnings and playing time. Bryce Harper already joked about playing in Japan and Taiwan on his Instagram account:
What's the size of your jersey??
? https://t.co/YgSUH0sEp5#BryceHarper #?????????@bryceharper3 #?? #?? #?????? #giants #?? #tokyo #?? #???? #tokyogiants pic.twitter.com/jJW2yNcULa— ????????????? (@TokyoGiants) March 1, 2022
It’s not hard to imagine a situation where MLB players start to seriously consider their options abroad if progress towards a new CBA deal hasn’t been made. Opening day in Korea is set for April 2, while the Nippon Professional Baseball season begins on March 25. That gives players an increasingly narrow window to make a decision. Established stars like Harper probably won’t be making the jump to Asia this year, but for players still mired in free agency or on the fringe of a major league roster and ineligible to play in minor leagues, a guaranteed paycheck and playing time in a foreign league could become increasingly enticing.