To the surprise of no one, the Dodgers are good. They lead all of major league baseball with a 10-2 record. They’ve outscored their opponents by 32 runs. Barring catastrophic injuries or a long run of bad luck, they seem poised to end the season as one of the league’s winningest teams.
You may be wondering where I’m going with this. It’s to introduce the idea that good teams are good by design. In a game whose goal is to maximize runs scored and minimize runs allowed, their hitters launch dingers, their pitchers compile strikeouts, and numerous depth players allow them to deal with injuries. But today, I want to focus on a single characteristic: plate discipline. As of writing, the Dodgers have the lowest in O-Swing% in the league. They’re also second in Z-Contact%, behind only the Astros. Laying off bad pitches, making contact with hittable ones – that seems like a recipe for success. And currently, no Dodger hitter is more emblematic of this approach than Max Muncy.
We haven’t written much about the first baseman here at FanGraphs. One reason might be that he isn’t the flashiest athlete – like Trout, he achieves greatness through consistent production at the plate. Theatrics are kept to a minimum, save for when he feuded with Madison Bumgarner. But another, more relevant reason might be that Muncy had remained true to himself since 2018, his breakout year. Sure, his wRC+ plummeted in 2020, but he sported an uncharacteristically low BABIP in one of baseball’s weirdest seasons. Besides that quirk, nothing much had changed. He drew his share of walks; he hit for power.
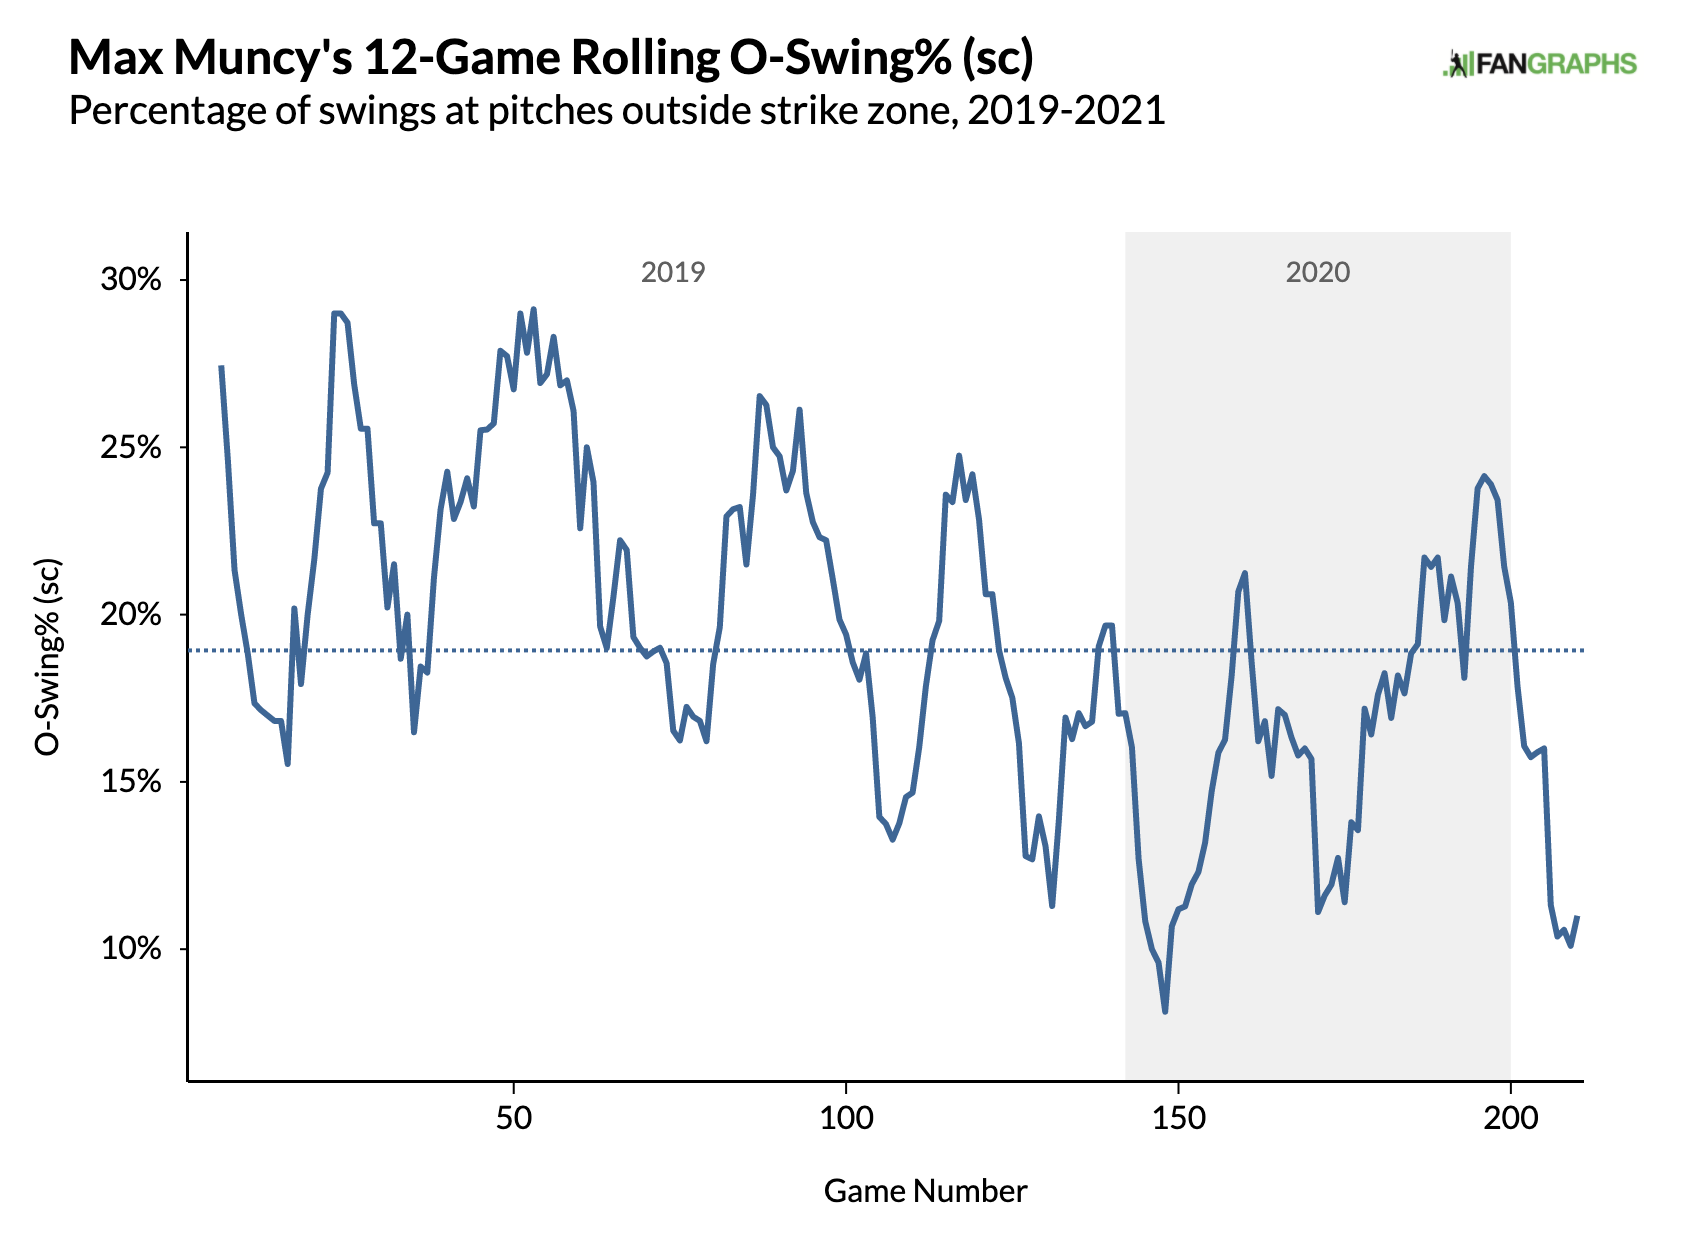
That is, until now. Somehow, someway, Muncy has become an even more extreme version of his patient, slugging self. His O-Swing rate of 12.5% is the lowest among all hitters, which is also the lowest of his career. But wait, that’s based on 12 games! How do you know this isn’t some small-sample blip? I wondered about that too, but looking at his rolling O-Swing% tells a different story, one which began in 2019:
Read the rest of this entry »

